xylocopa
A to-do list that runs your Claude Code agents — capture anywhere, dispatch in parallel, review from your phone.
Python★ 51
Home Assistant integration for smart-plug appliance monitoring: detects cycles, matches programs, estimates time remain…
 3dg1luk43
A Home Assistant custom component to monitor washing machines via smart sockets, learn power profiles, and estimate completion time using shape-correlation matching.
Caution
ELECTRICAL SAFETY WARNING: Using smart plugs such as Shelly or Sonoff with high-amperage appliances (washing machines, dryers, dishwashers) carries significant risk.
sensor.<name>_energy_total) come built in.Designed for new users to get up and running quickly.
This integration is a default repository in HACS.
Click the button below to open the repository in HACS:
Click Download.
Restart Home Assistant.
Alternatively, open HACS > Integrations > Explore & Download Repositories > Search for "WashData".
custom_components/ha_washdata folder from the latest release.custom_components directory.Follow these steps to get accurate results quickly.
That is the whole wizard - setup is just device type, power sensor, and minimum power. (Earlier versions had an optional "Create First Profile" step; it was removed in 0.5.1. The panel's Setup Card now guides you through creating your first profile.)
Then open the WashData panel. After setup, a WashData entry appears in the Home Assistant sidebar - that panel is where you do everything: Overview (live status + manual recording + a Setup Card that guides your next step), Cycles, Profiles, Settings, Playground, Store (when online features are enabled), and Advanced (which contains Maintenance, Diagnostics, and ML Training sub-tabs). The integration's Configure dialog keeps only three essentials (device type, power sensor, minimum power); every other setting and action lives in the panel.
If you are using Zigbee2MQTT with smart plugs, ensure your device reporting is responsive enough for accurate matching:
WashData does not come with pre-built profiles because every machine model is different. You teach it your cycles from the WashData panel (the sidebar entry).
This gives you the cleanest data.
If you prefer to just use it and label later:
WashData matches cycles using power-consumption shape, cycle duration, and total energy - not temperature or spin-speed settings directly. This affects how granular your profile library should be.
Programs with clearly different durations or power patterns are always distinguished well:
| Example pair | Why it works |
|---|---|
| Quick Wash (~20 min) vs Cotton (~3 h) | Huge duration gap - no ambiguity |
| Wash-only vs Wash+Dry | Drying adds 100–200 min and significant extra energy |
| Cotton vs Delicates | Different agitation/heating patterns and often different durations |
Programs that differ only in temperature or spin speed (e.g. Cotton 40°C vs Cotton 60°C) often produce similar power shapes and durations. The matcher will attempt to distinguish them using correlation and energy differences, but:
Phase-aware time remaining (0.5.1, opt-in). Temperature variants differ mostly in how long they spend heating. WashData can budget each cycle stage (heating / wash / spin) separately so the time-remaining estimate stays accurate across variants, even when the overall shape looks the same. Enable it per device with "Use phase-aware time remaining" in Settings (currently available for washing machines and washer-dryers). It only refines the ETA - it never changes which program is matched.
Create separate profiles for every wash+dry combination you use regularly (e.g. "Cotton 40°C Wash", "Cotton 40°C + Cupboard Dry"). The drying phase adds so much duration and energy that wash-only vs wash+dry is one of the easiest distinctions for the matcher to make.
Start with a small set of your most-used and most-different programs, then add temperature/spin variants gradually as you accumulate history.
Once profiles are created, WashData starts matching new cycles automatically.
If "Auto-Detect" isn't working perfectly, use the panel's Settings tab to tune the logic for your specific machine (each field has a hover tooltip, and observed-cycle suggestions appear inline).
📊 Click here for a Visual Guide to these settings - Graphs explaining what the numbers actually do.
| Problem | Likely Cause | Solution |
|---|---|---|
| Cycle Starts Too Early | Smart plug reports brief power spikes during boot/standby. | Increase Start Energy Threshold (e.g., to 2 Wh). This forces the machine to consume actual energy before stating "Running". |
| Cycle Ends Too Early | Machine pauses (soaking) or has long low-power intervals. | Increase Off Delay. Give it more time (e.g. 5 mins) to wait before deciding the cycle is truly finished. |
| False "Ghost" Cycles | High-power usage at the very end (e.g. anti-crease or pump-out) triggers a new start. | Increase Minimum Off Gap (e.g. to 120s). Forces a mandatory cooldown period between cycles. |
| "Unknown" Matches | Your profiles are too strict or variance is high. | Increase Duration Tolerance (e.g. 0.25). Allows ±25% duration difference when matching. |
| Notifications Too Late | You want to know before it finishes. | Set Notify Before End Minutes (e.g. 5). Get an alert 5 minutes before the estimated finish time. |
| Persistent 'Running' State | Integration stays locked to a long profile after a short cycle diverged. | Handled automatically: divergence detection reverts to Detecting... once match confidence drops below 60% of its peak score, so a mis-matched long profile no longer keeps the state locked. |
Pro Tip: Once WashData has analysed enough of your history, tuning suggestions appear inline in Settings next to each affected field - click Use to accept one, or Apply all in the banner to take them together. Nothing is ever applied automatically.
WashData exposes a diagnostic sensor: sensor.<name>_suggested_settings.
0 means there are currently no actionable recommendations.> 0 means recommendations are ready to review.When this sensor is above 0, open the panel's Settings tab: suggested values appear inline next to the relevant fields with a one-click Use (or Apply all). Review them and Save only the changes you agree with. Suggested values are optional and are never forced automatically.
Phases are descriptive labels for distinct power stages within a cycle (e.g., "Pre-Wash", "Heating", "Spin").
{{ trigger.event.data.* }} variables), the cycle notification lifecycle, message placeholders, companion-app payload keys, the full Events reference, and entity attributes.Everything is managed from the WashData panel in the Home Assistant sidebar. Its tabs:
| Tab | What you do there |
|---|---|
| Overview | Live state, power chart, progress with a color-coded phase timeline, and time remaining, a program selector, feedback attention cards, a Setup Card that guides your next step on new devices (record a profile, browse the community store, resolve suggestions), and Manual Recording (start/stop) right here on the home screen. |
| Cycles | Cycle history (with per-cycle energy cost), paginated with Load more; open a cycle to label, trim, split, merge, or delete it; multi-select for compare / merge / bulk relabel / delete, a 10s undo on deletes, and a "needs review" filter. Heavy edits (trim / split / merge / rebuild envelopes) run as background tasks with a header progress pill, so the panel never freezes. |
| Profiles | Create (+ New Profile), rename, rebuild, group, and clean up profiles; per-profile average cost and a duration sparkline; a Phase Catalog sub-tab and a phase-range editor. |
| Settings | All tunables (detection, matching, timing, notifications, energy price, ...), each with a tooltip and inline suggestions, behind a Basic / Advanced toggle. Includes the opt-in phase-aware time-remaining toggle. Notifications includes an Automations section (see below). |
| Playground | Power-user what-if tools, all driven by the real detection/matching/estimation engine (not an approximation), presented as one workbench. Simulate: load a stored cycle and replay it exactly as the integration would run it - real detector state band, model-estimated time-left / progress / live match confidence / current phase updating as you scrub or play, a synchronized event timeline (detected → match committed → notification points → finished) and a side rail of alerts (overrun, did-not-finish, unmatched, …); drag the detection thresholds to re-run instantly. Test on history: replay your recent cycles into a per-cycle results table with drill-down and a before/after diff when you edit a setting. Optimize: find the setting value that best meets an objective (match accuracy, end-timing, false-end rate, duration off-target, ambiguity) as a 1D curve or a 2D heatmap, then apply the best. |
| Store | The Community Store (shown when online features are enabled): browse shared appliance setups by brand/model, adopt a matching device to skip recording from scratch, and share your own programs. |
| Advanced | Sub-tabs for My Preferences, Diagnostics (storage stats, maintenance actions, and config export / import), a Maintenance log with service reminders, Logs, Panel Settings, Access Control (per-user RBAC), and ML Training (the opt-in on-device training, matcher tuning, and runtime-models toggle; shown only when ML training is available). The gear icon controls online features (opt-in) that unlock the Store tab and the brand/model pickers. |
The integration's Configure dialog (Settings → Devices & Services → WashData) is now a small stub with just device type, power sensor, and minimum power - everything else lives in the panel. (The panel itself is a custom sidebar entry at /ha-washdata; open it from the Home Assistant sidebar.)
Notifications are built on automations. The old built-in custom-action editor has been removed; instead, Settings → Notifications → Automations lists the automations that use a device and creates new ones (blank, or prefilled with a cycle trigger). Any custom actions from an older setup keep firing and can be converted to an automation or removed from that section. See NOTIFICATIONS.md.
Click a section to expand screenshots and descriptions.
Device selector and live status
The device bar at the top shows all configured appliances at a glance - state badge, pending suggestions count, and review queue. Clicking any card switches the active device without leaving the panel.
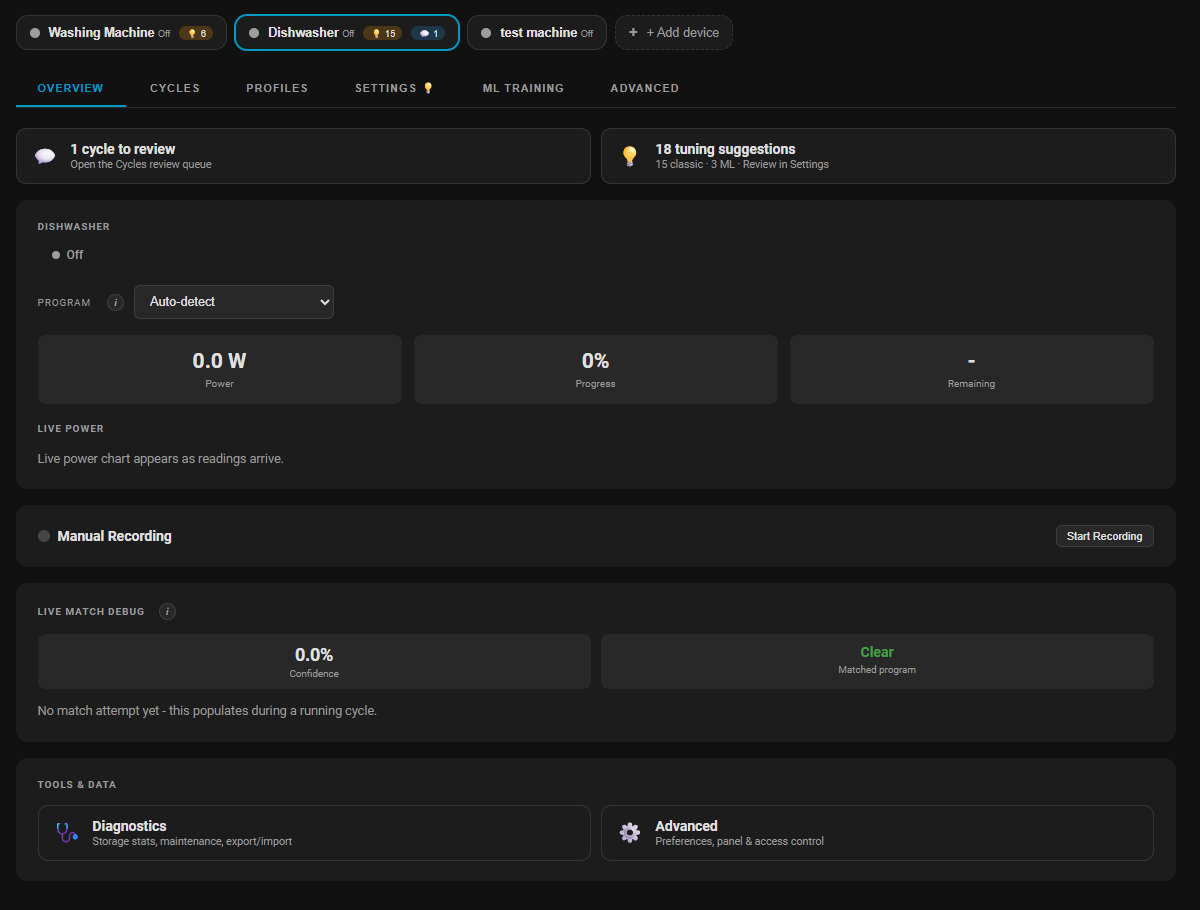
The Overview tab shows the current state (Off / Running / Detecting), a live power reading, and the progress and time-remaining estimates once a cycle is matched. A single Setup Card guides your next step depending on how far along the device is (record your first program, browse the community store, widen coverage, or resolve tuning suggestions), and feedback attention cards surface finished cycles that need review - so you act without hunting through menus. Manual Recording lives here too - hit Start Recording before you run a new program to get a clean reference cycle.
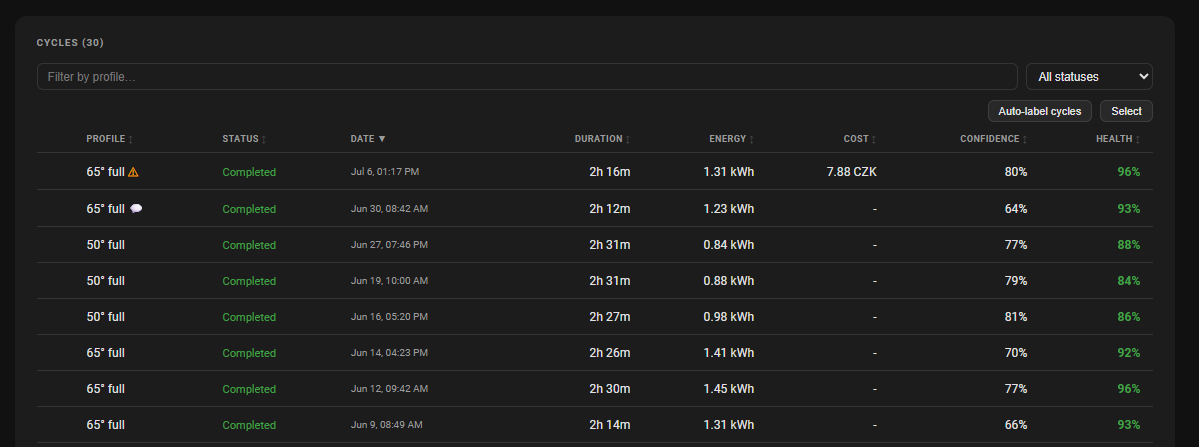
Cycle history list
Every completed cycle is listed with profile, status, date, duration, energy, cost, match confidence, and cycle-health score. Sortable columns; filter by profile name or status (completed / interrupted / unknown / needs review).
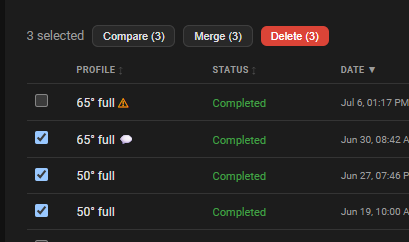
Multi-select actions
Tick two or more cycles to reveal the bulk action bar: Compare overlays their power curves side by side, Merge fuses two mis-split runs into one, and Delete removes them permanently.
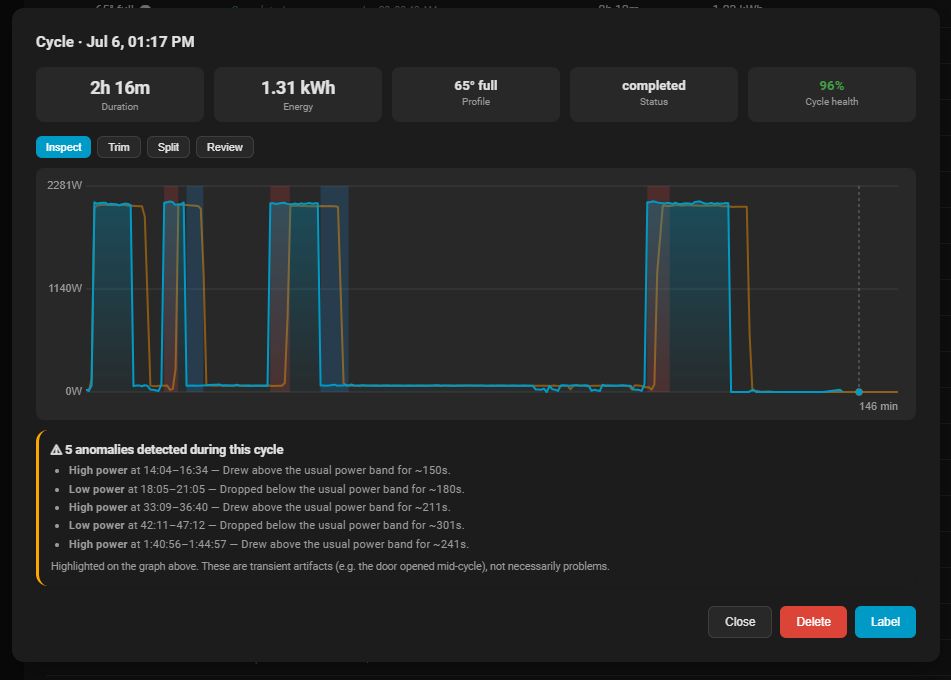
Inspect - power graph and anomaly report
Opening a cycle shows its power trace overlaid on the matched profile's envelope. Shaded regions highlight detected artifacts (door-open pauses, out-of-band spikes/dips). The anomaly list below the graph describes each event with its timestamp and duration so you can judge whether it was intentional (e.g. adding clothes mid-cycle) or a detection problem.
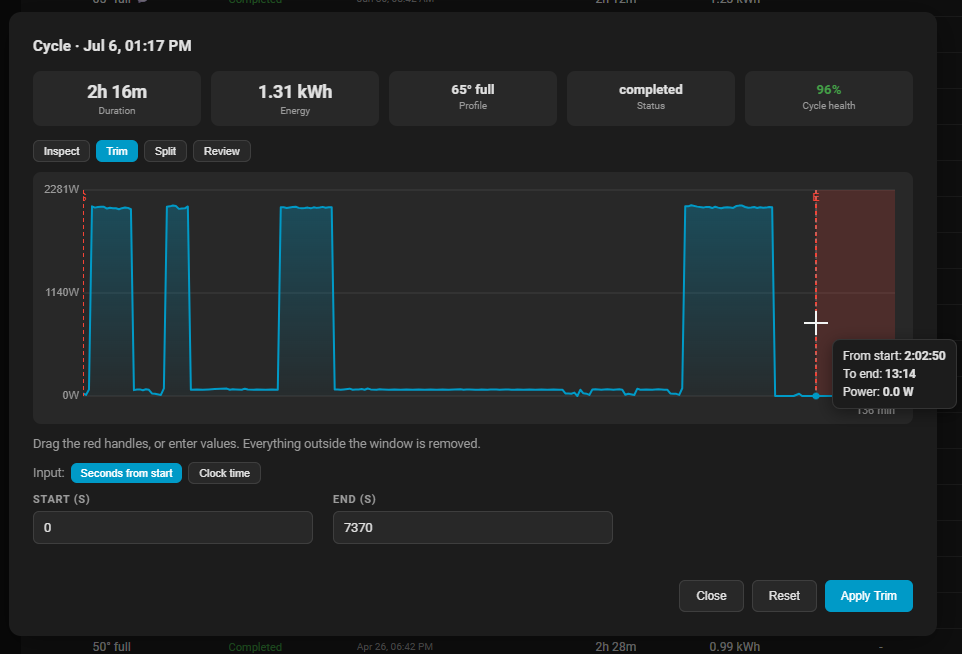
Trim - remove noise from cycle boundaries
Drag the red handles on the graph, or type exact offsets, to crop a late-detected start or an overrun tail. Everything outside the window is discarded when you hit Apply Trim.
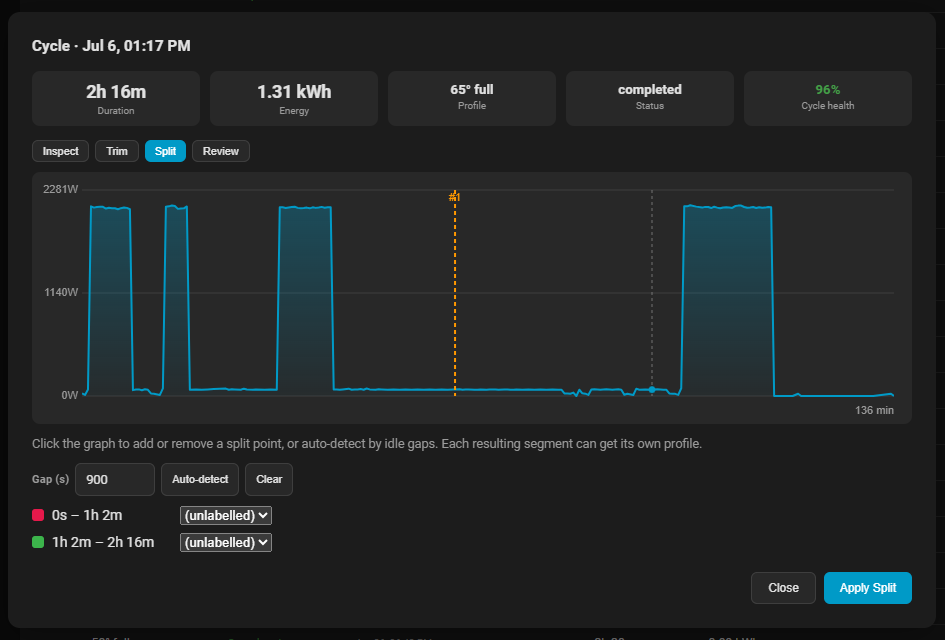
Split - divide one run into separate cycles
Click on the graph to place split points, or use Auto-detect to find idle gaps automatically. Each resulting segment gets its own profile dropdown so you can label wash and dry phases of a combo cycle separately.
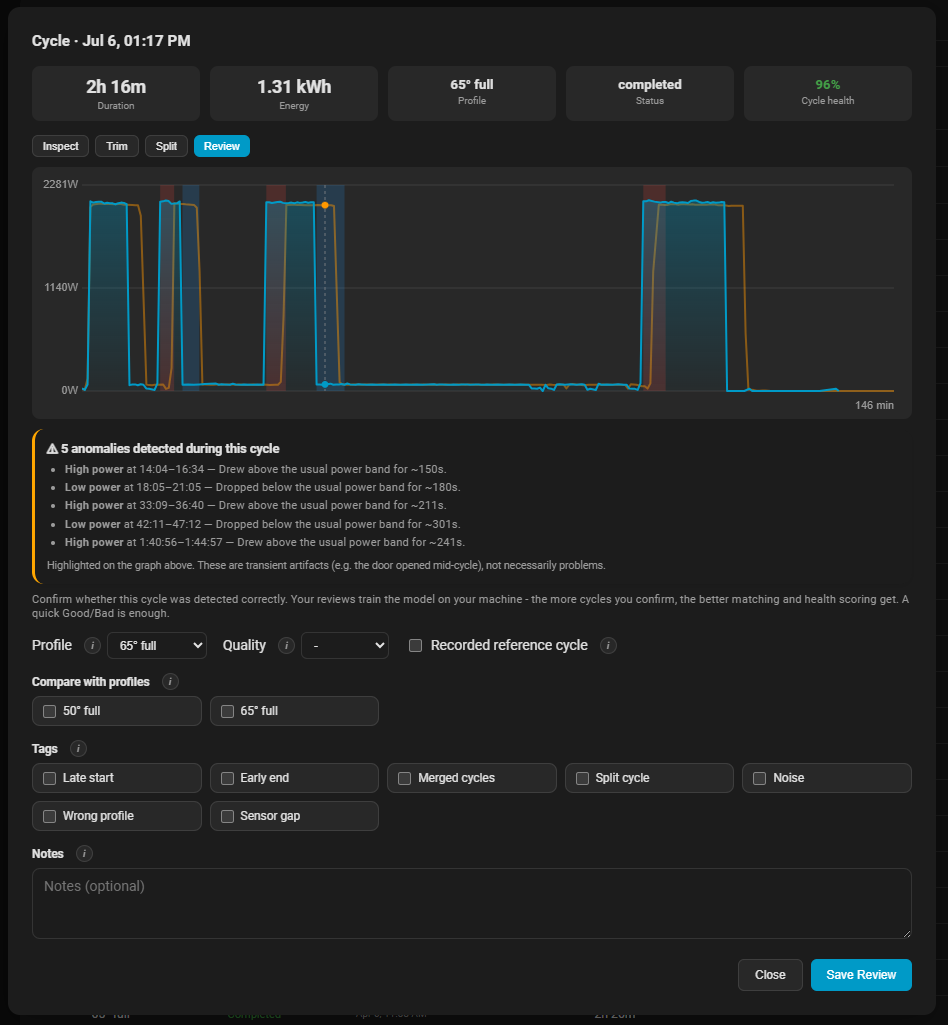
Review - confirm, tag, and teach the model
Set the correct profile and a quality rating (Good / Bad), tick issue tags (Late start, Noise, Wrong profile, …), compare against alternative profiles side by side, and add free-text notes. Saved reviews feed the on-device ML model and refine future matching.
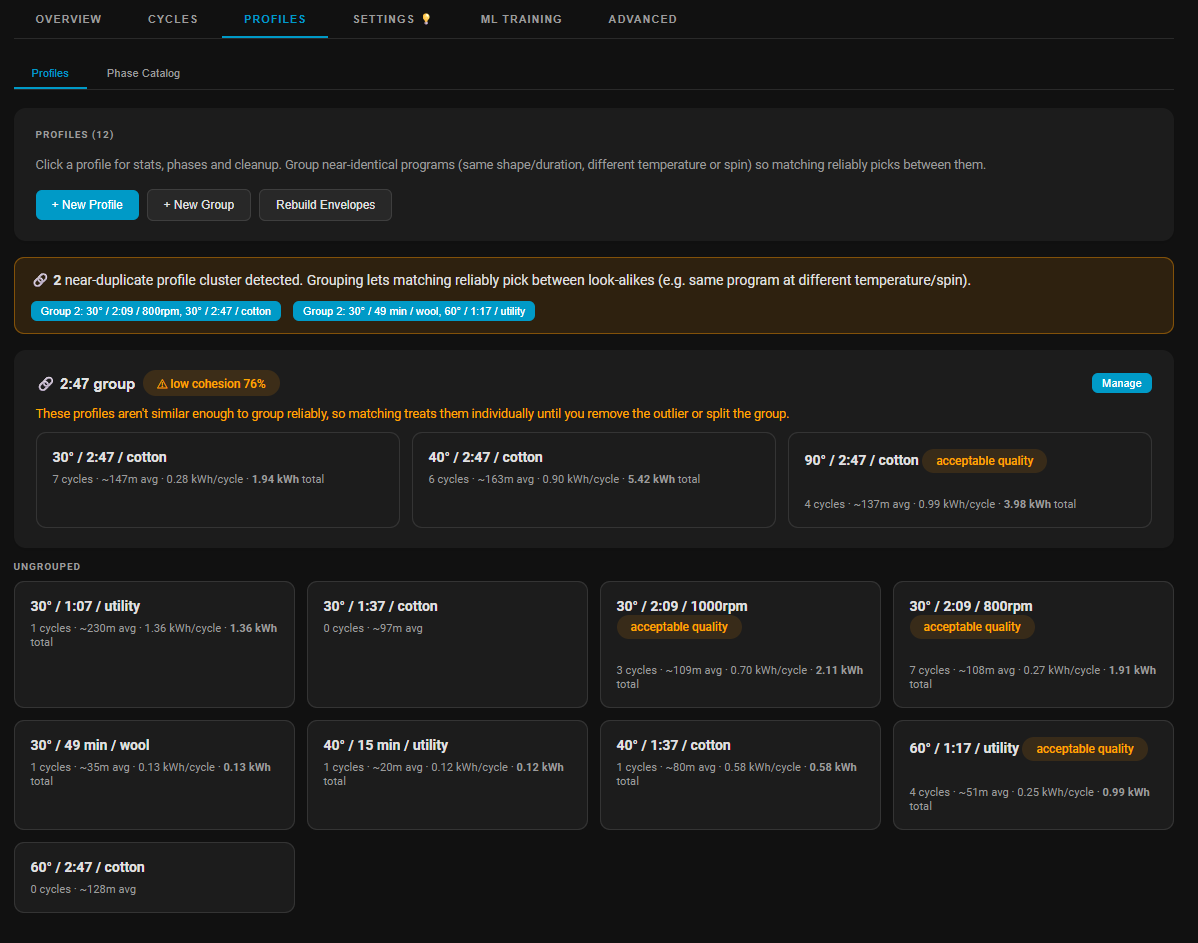
Profile library
All learned programs are shown as cards with cycle count, average duration, per-cycle energy, and accumulated total. A quality badge ("acceptable quality") appears once enough cycles have been labelled. A yellow banner calls out near-duplicate clusters and invites you to group them so the matcher can reliably pick between look-alike programs (same shape, different temperature or spin speed).
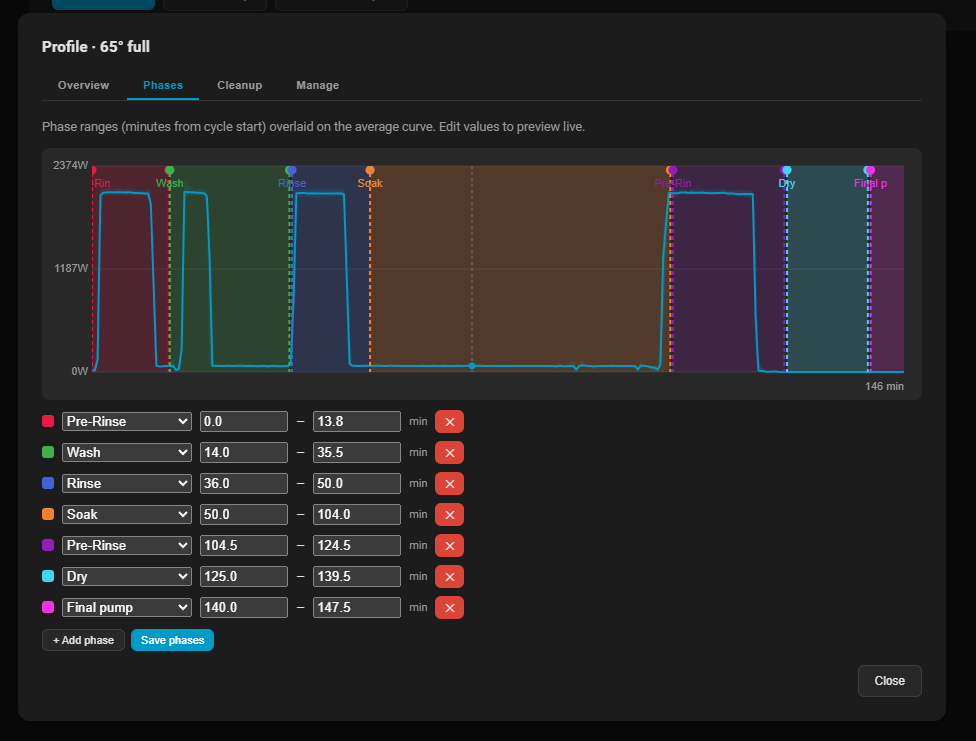
Phases - visual phase-range editor
Open any profile and switch to the Phases tab to see every labelled cycle's average curve with coloured phase bands overlaid. Drag boundary values or type minute offsets to map Pre-Rinse, Wash, Rinse, Soak, Spin, Dry and other phases to time ranges. The live progress readout on the Overview tab uses these ranges to display the current phase name.
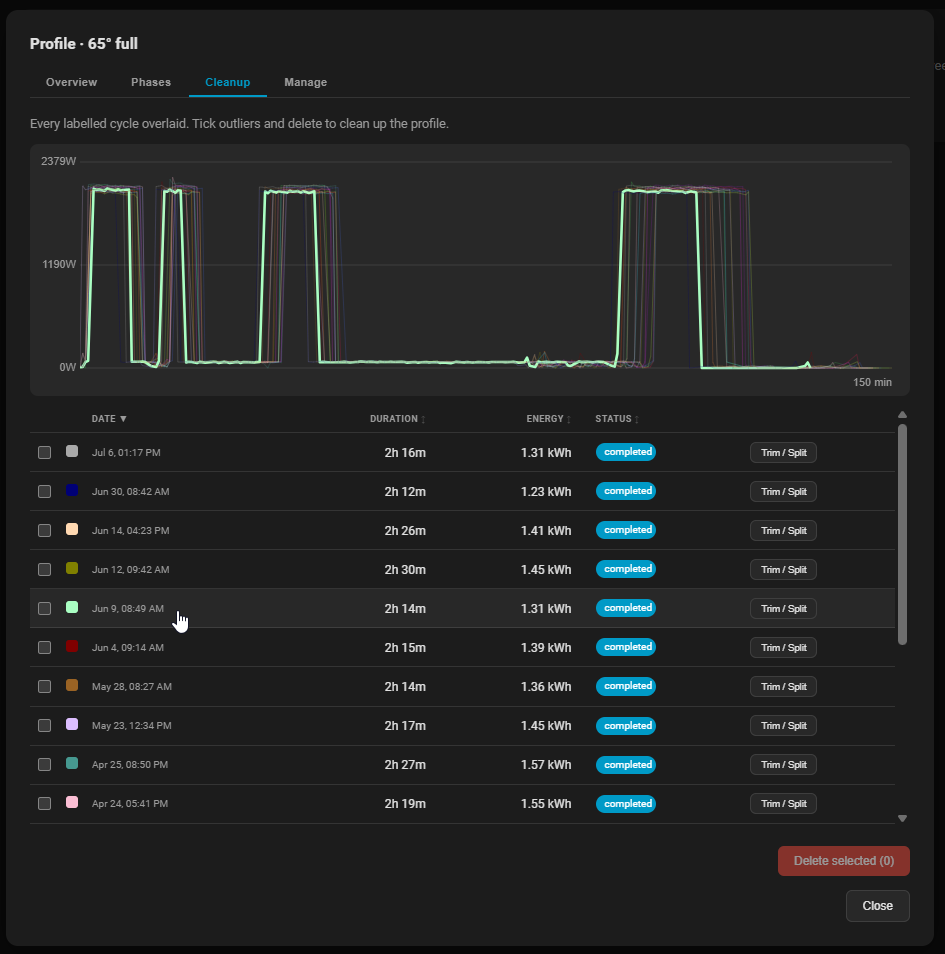
Cleanup - spot and remove outlier cycles
The Cleanup tab overlays every labelled cycle as a spaghetti graph. Hover a row in the table to highlight that cycle's curve; tick the checkbox to select it; hit Delete selected to remove outliers that are pulling the profile envelope out of shape. Scroll position is preserved while you tick boxes.
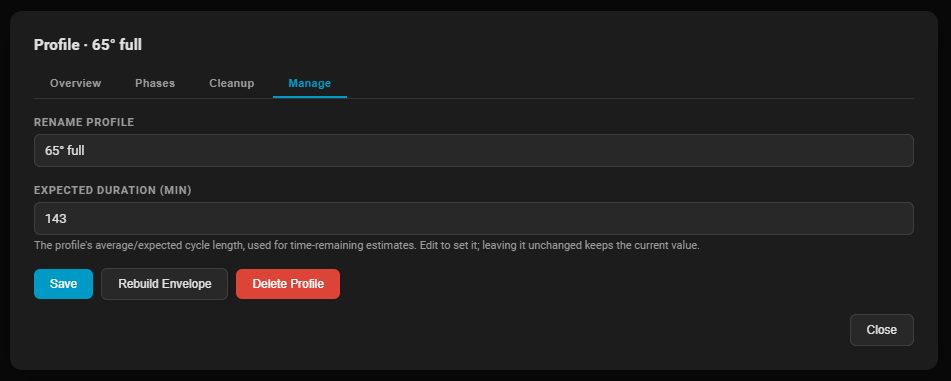
Manage - rename, retune, delete
Set the expected duration (used for time-remaining estimates before the cycle completes its first 50%), rebuild the envelope after cleanup, or delete the profile entirely.
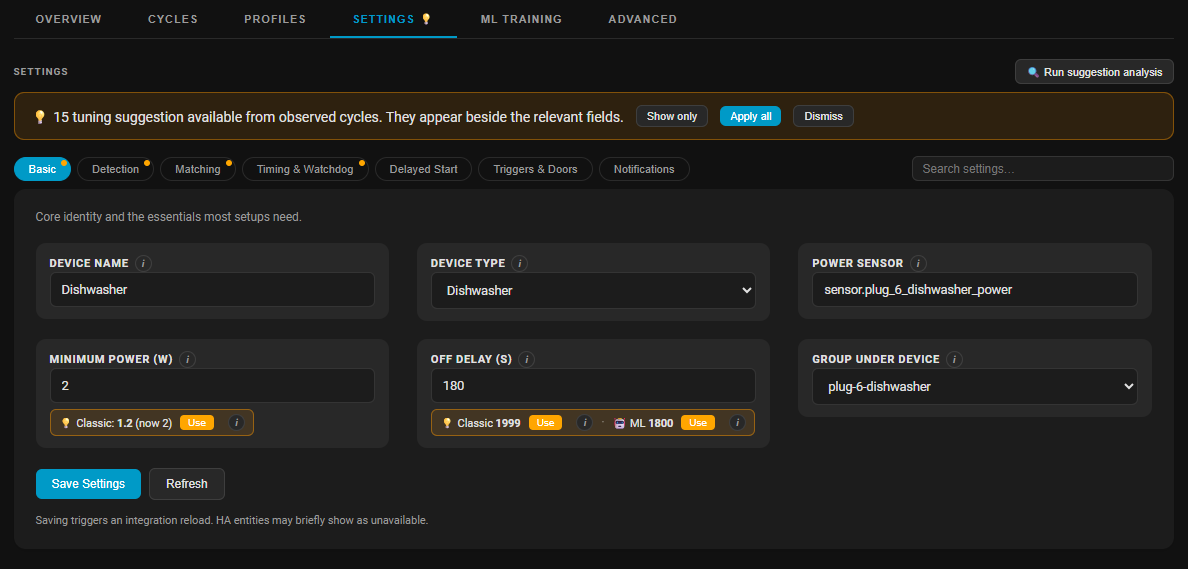
Basic section - core identity
Device name, device type (sets detection defaults), power sensor entity, minimum power threshold, off delay, and HA device grouping. Inline suggestion chips appear when WashData's analysis finds a better value from your cycle history - click Use to accept or ignore them individually, or Apply all in the banner.
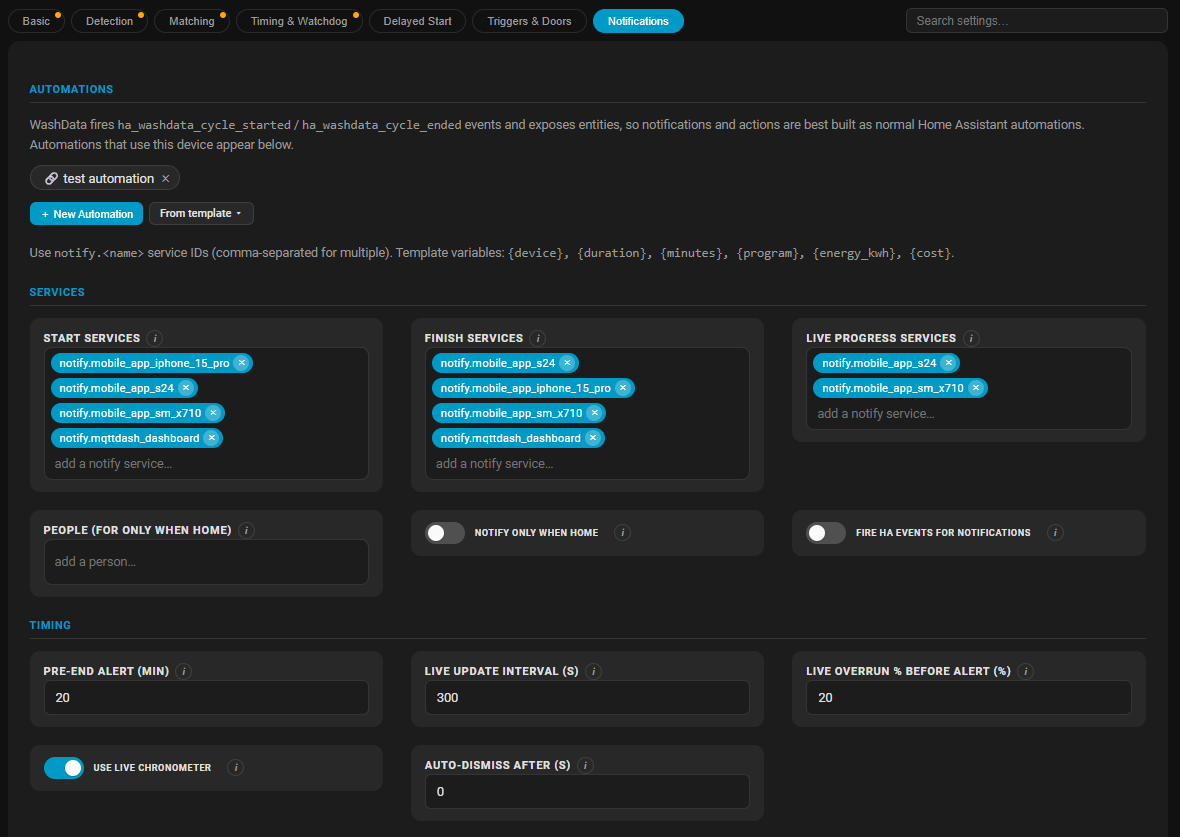
Notifications section - push alerts and automations
Configure push targets for cycle-start, finish, and live-progress events using a filterable entity picker (type to narrow the list). The Automations section links to the HA automations that already reference this device and lets you create new ones from a blank or prefilled template. Pre-end alert timing, live-update interval, and overrun threshold live here too.
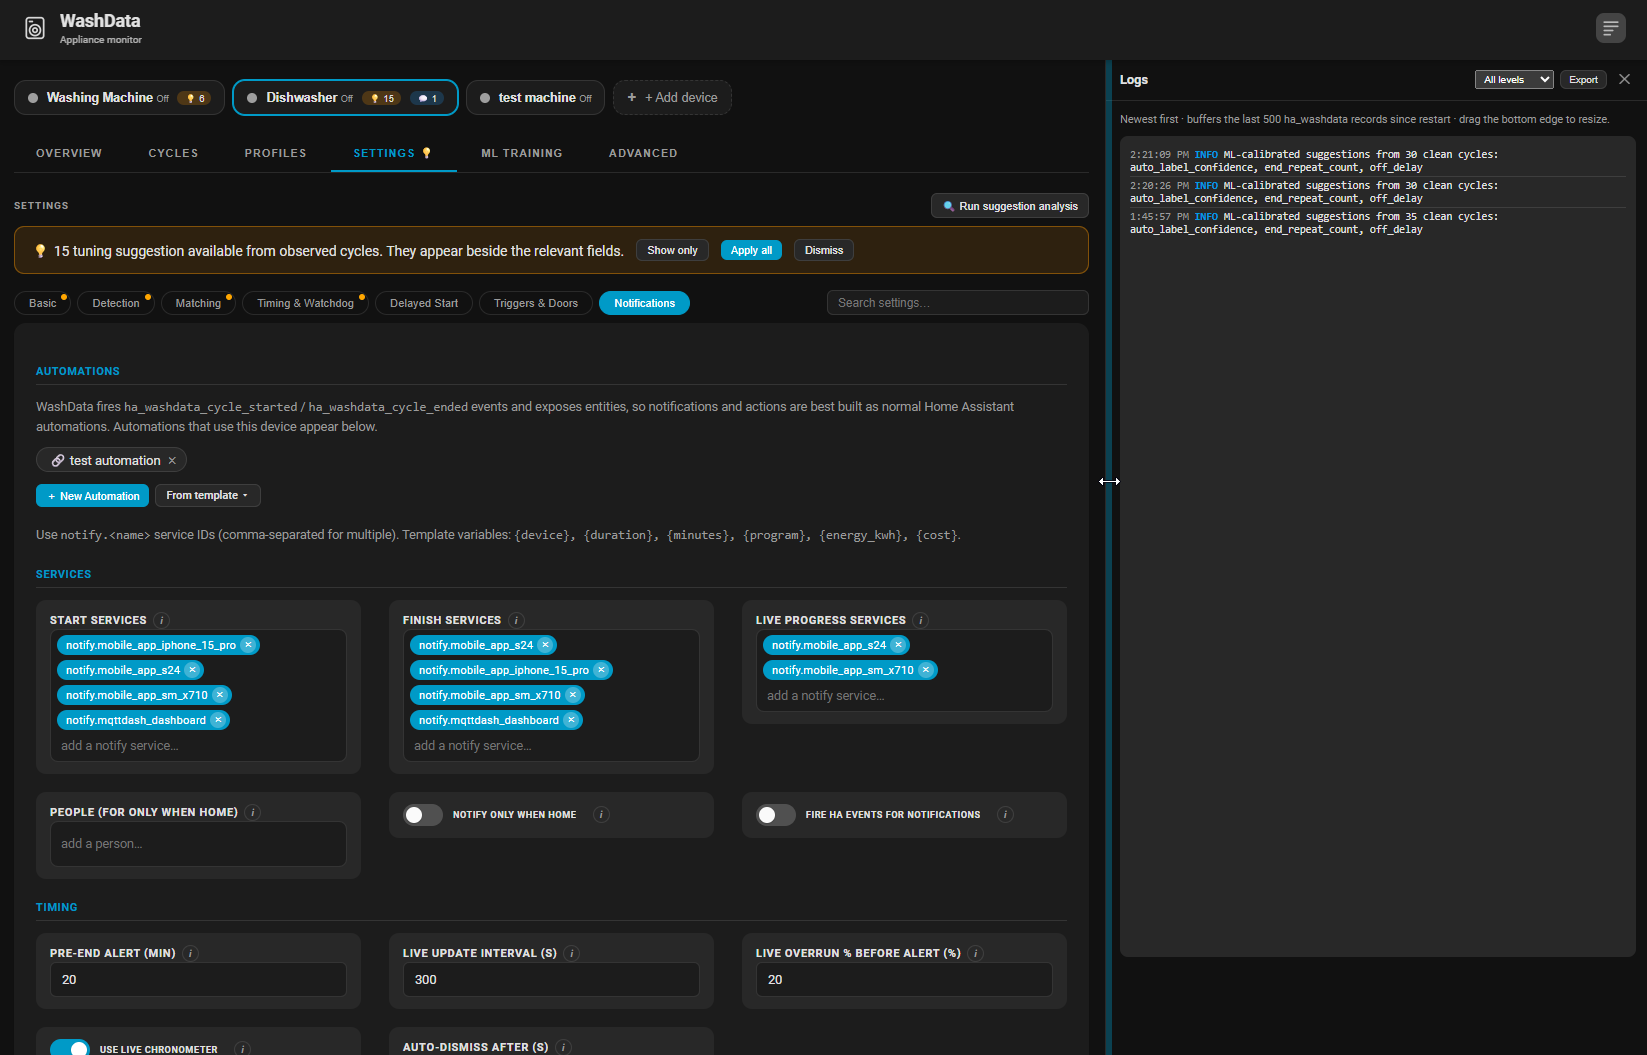
Log drawer
The log panel slides in from the right edge of any Settings view. It streams the last 500 WashData log lines, filterable by level (Info / Warning / Error). Drag the left edge of the drawer to resize it; the width and open/closed state persist across page refreshes.
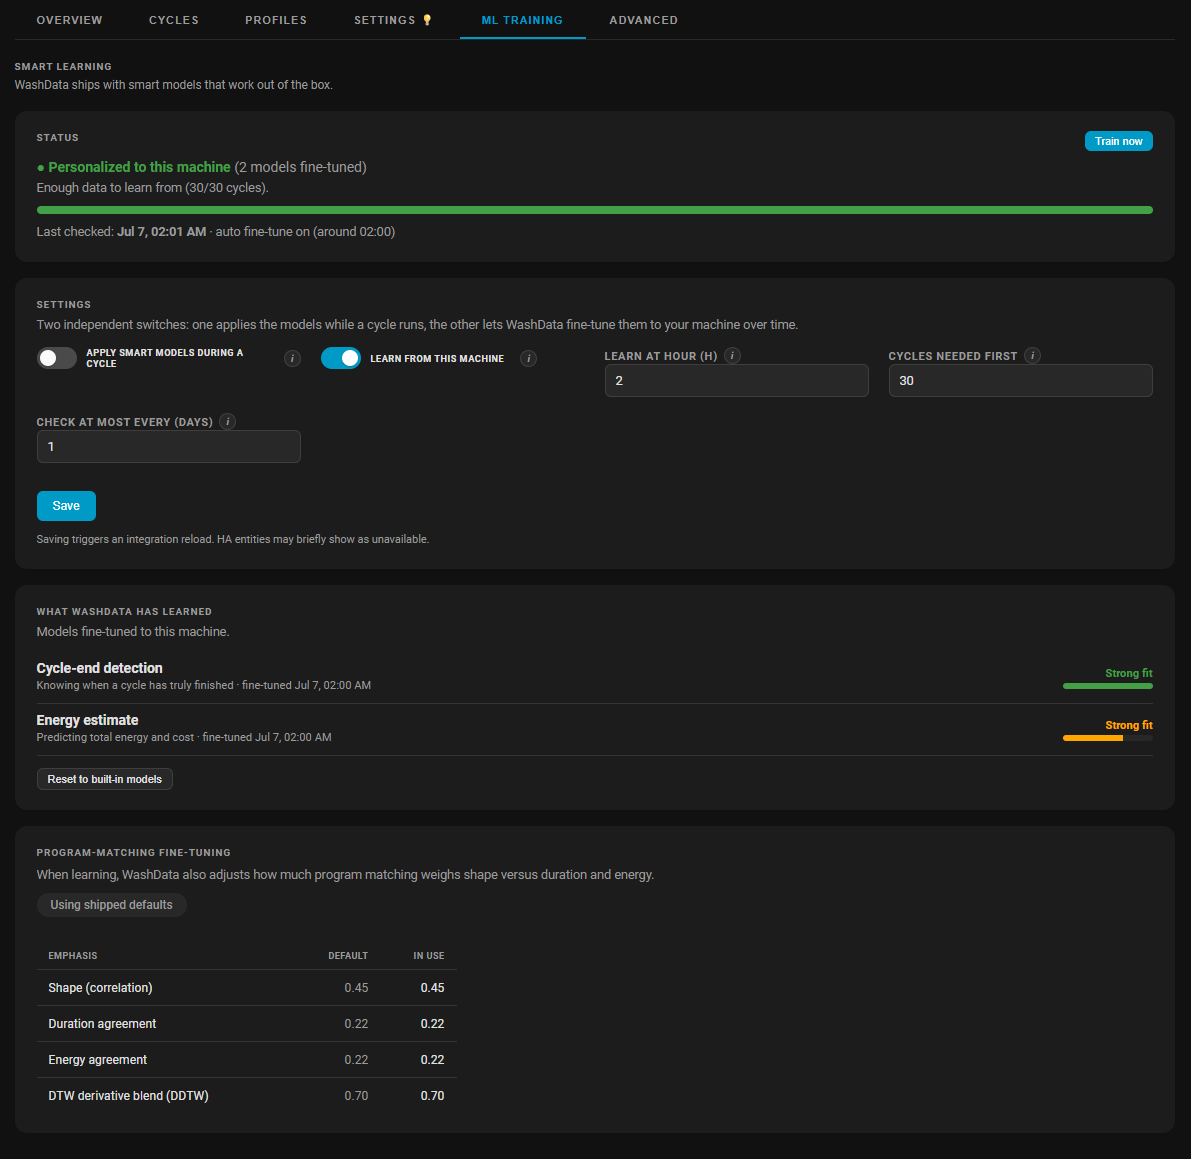
Status, settings, and learned models
The ML Training tab is the single home for all on-device learning. The Status card shows whether models are personalized to your machine or still using the shipped baselines, with a data-readiness progress bar and last-trained timestamp. The Settings section has two independent toggles: one that applies models during a live cycle, and one that lets WashData retrain overnight. What WashData has learned lists each capability (cycle-end detection, energy estimate) with a plain-language fit chip (Strong fit / Improving / …) and a colour bar so you can see quality at a glance without reading numbers.
The Program-matching fine-tuning table shows whether per-device matching weights (shape vs duration vs energy) have diverged from the shipped defaults after tuning against your labelled history.
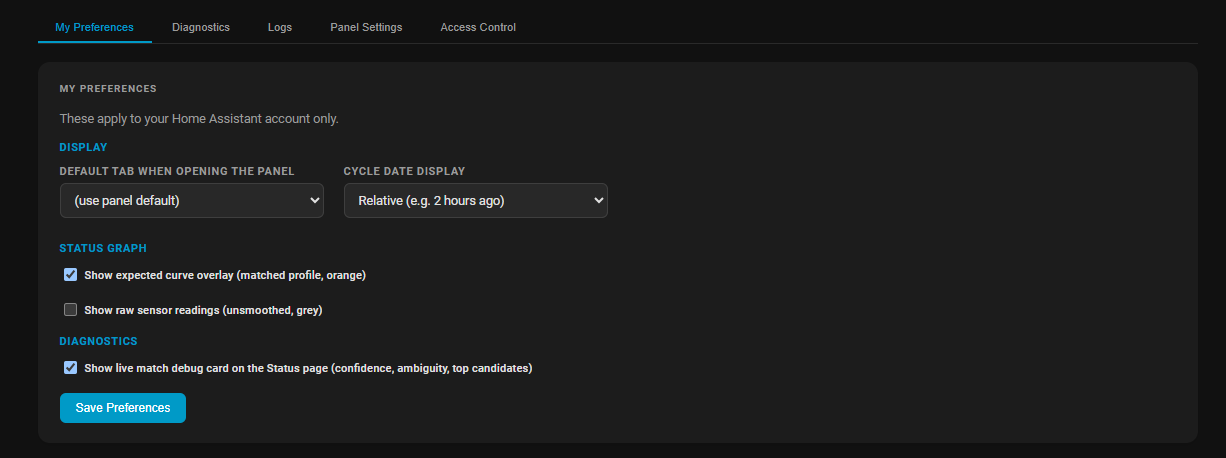
My Preferences
Per-HA-account display options: default landing tab, cycle date format (relative or absolute), whether to show the expected-curve overlay on the power graph, and the live match debug card visibility.
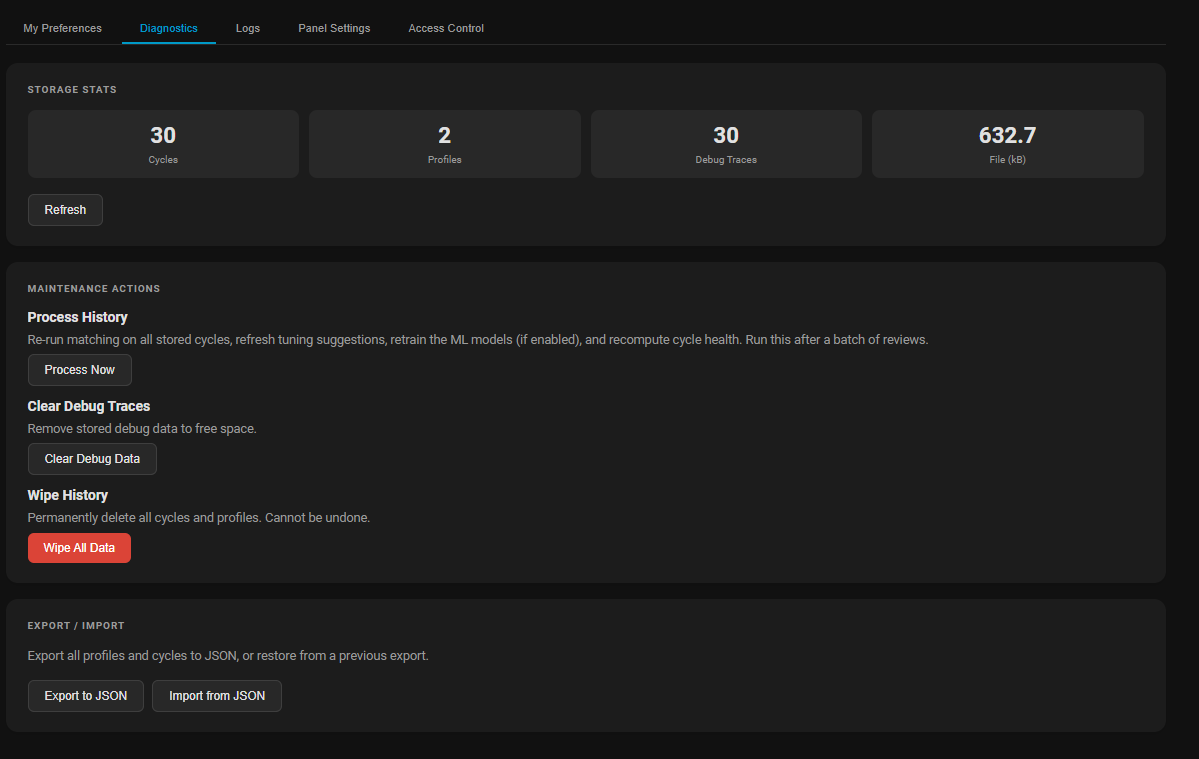
Diagnostics
Storage stats (cycle count, profile count, file size), and three maintenance actions: Process History re-runs matching and ML retraining on all stored cycles after a batch of reviews; Clear Debug Traces frees space; Wipe All Data is the nuclear option. Export / Import lets you back up the full profile and cycle database to JSON or restore from a previous export (also accepts HA diagnostics downloads).
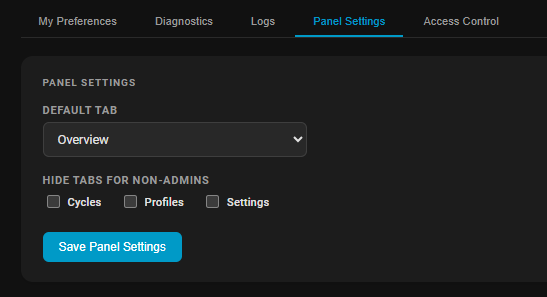
Panel Settings
Admin-level defaults: which tab opens by default for all users, and which tabs (Cycles, Profiles, Settings) are hidden from non-admin users.
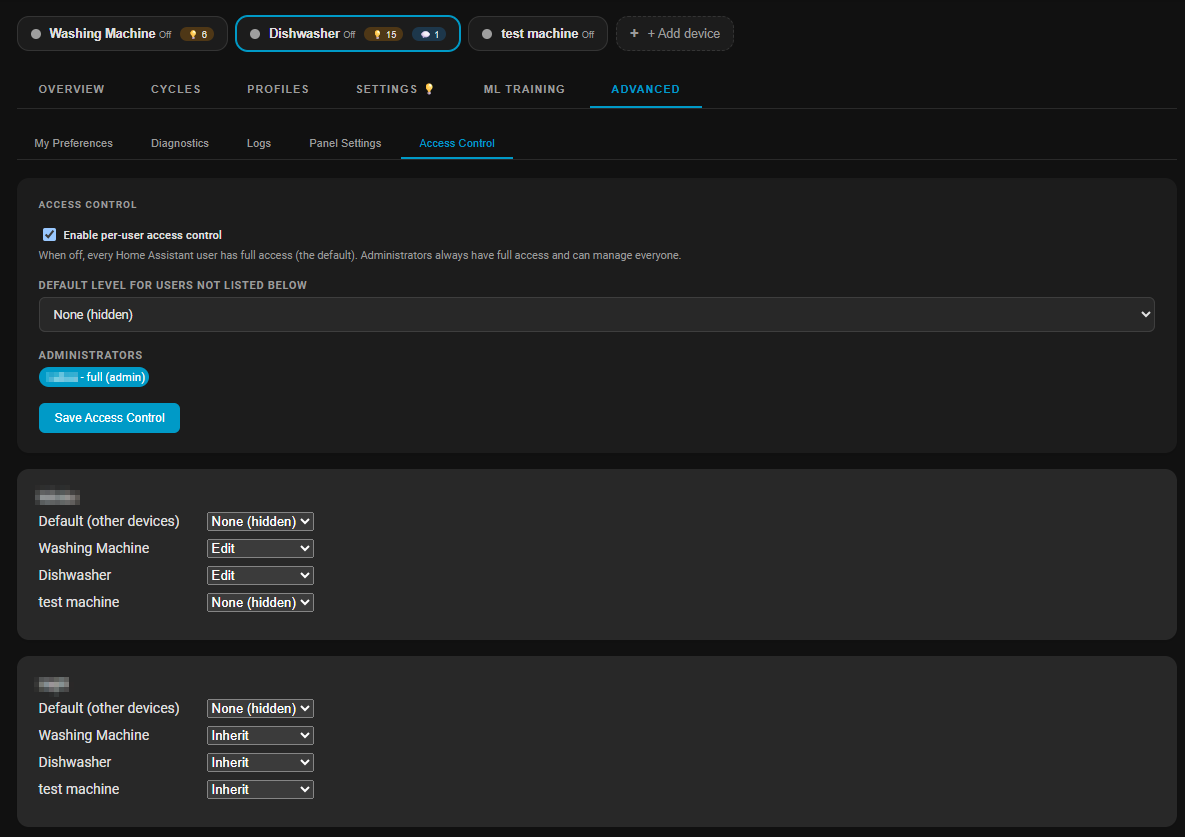
Access Control
Per-user RBAC. Enable per-user control, set the fallback level for unlisted users (View / Edit / None), and override per device for each HA account. Administrators always have full access and can manage everyone's permissions from this screen.
sensor.<name>_state: Current status. Possible values: idle, starting, running, paused, user_paused, ending, finished, anti_wrinkle, interrupted, force_stopped, rinse, clean, delay_wait, unknown.sensor.<name>_program: Best-matched profile name. While a cycle is matched it also carries a reference_profile attribute - a compact [[offset_s, watts], ...] curve of the program's expected power over time (with duration_s and cycle_count) for energy-management automations; see NOTIFICATIONS.md.sensor.<name>_time_remaining: Smart countdown (locks during high-variance phases).sensor.<name>_total_duration: Total predicted duration (Elapsed + Remaining). Ideal for timer-bar-card.sensor.<name>_cycle_progress: 0–100% (resets after unload timeout).sensor.<name>_cycle_count: Total completed cycles stored - use in automations to schedule maintenance by cycle count.sensor.<name>_energy_total: Lifetime energy in kWh (total_increasing) - add it to the Home Assistant Energy dashboard to track consumption over time.sensor.<name>_current_phase: Active cycle phase label (e.g. "Rinsing", "Spin").sensor.<name>_pump_runs_today: (Pump device type only) Completed pump cycles in a rolling 24-hour window.binary_sensor.<name>_running: Simple on/off running state.button.<name>_pause_cycle: Pause the active cycle (available while Running/Starting/Ending and not already paused).button.<name>_resume_cycle: Resume a user-paused cycle.button.<name>_force_end_cycle: Force-terminate a stuck cycle.switch.<name>_auto_maintenance: Toggle nightly database cleanup.Most management is done from the WashData panel, but these services are available for automations:
ha_washdata.export_config: Full JSON backup of all settings, profiles, and cycle history.ha_washdata.import_config: Restore from a JSON backup. Accepts regular WashData exports and HA diagnostics download files.ha_washdata.pause_cycle: Pause the active cycle programmatically (e.g. from an energy-tariff automation).ha_washdata.resume_cycle: Resume a user-paused cycle.ha_washdata.record_start / record_stop:
Manually start/stop a recording. Useful for automations (e.g. triggering from a physical button or separate sensor).
service: ha_washdata.record_start
data:
  device_id: "washer_device_id"
ha_washdata.label_cycle: Assign a profile to a cycle in history programmatically.WashData registers an Assist conversation intent (HaWashdataStatus) so you can ask your
voice or text assistant about an appliance in plain language and get a live answer:
Home Assistant does not let a custom integration inject sentences into the built-in
conversation agent at runtime, so you wire the trigger phrases once with a sentence pack.
A ready-to-use English pack ships at docs/custom_sentences/en/ha_washdata.yaml:
copy it to <config>/custom_sentences/en/ha_washdata.yaml and restart Home Assistant.
It maps a wide set of phrases to the HaWashdataStatus intent, with an optional {name}
slot to pick an appliance when you have more than one. The intent works immediately from
automations and the Assist pipeline; the sentence pack is only what teaches Assist which
phrases to route to it. See NOTIFICATIONS.md for the exact YAML.
WashData notifies you in two ways: a ready-made push to per-event targets, or your own
Home Assistant automations triggered by the bus events it fires
(ha_washdata_cycle_started, ha_washdata_cycle_ended, ha_washdata_pump_stuck). The
panel's Notifications → Automations section finds the automations that use a device
and creates new ones (blank, or prefilled with a cycle-started / cycle-finished trigger).
In an automation you template against the event data, e.g.
{{ trigger.event.data.duration }}, {{ trigger.event.data.program }},
{{ trigger.event.data.cycle_data.cost }}.
Every notification option, how to build automations with these variables, the cycle notification lifecycle, message placeholders, companion-app payload keys, and the full event payload reference are documented in NOTIFICATIONS.md.
The more real-world cycle data WashData has, the smarter its detection becomes - across different appliance brands, ages, and programs.
If you'd like to help, you can submit a diagnostics export directly from Home Assistant. It takes less than 2 minutes and requires no technical knowledge.
How to export:
🔒 Privacy: The export contains your appliance's power data and integration settings. It does not include your name, home details, location, or any other personal information.
💡 Tip: The same diagnostics file you download here can be pasted directly into the panel's Advanced → Diagnostics → Import (config import accepts an HA diagnostics download) to restore profiles and settings on a different HA instance - no manual format conversion needed.
All contributions are used solely to improve the WashData integration.
The WashData Community Store is a free, community-run catalog where users share appliance setups -- programs, reference cycles, and optionally tuned detection settings -- organized by brand and model. If someone else with the same washing machine or dishwasher model has contributed their recorded programs, you can adopt that setup in seconds rather than recording and labelling everything from scratch.
Enabling it: Open the WashData panel, go to the Advanced tab, click the gear icon, and toggle Enable online features on. Then use the Brand and Model pickers to declare which appliance you own. Online features are disabled by default and no data is sent or fetched until you opt in.
Adopting a setup: Once your model is declared, a Browse community setups button appears on the Overview tab's Setup Card for new devices. Click it to see contributed programs for your model, preview their power-cycle waveforms, and import them with a single click. An optional checkbox lets you also adopt the contributor's detection and matching settings -- useful if your machine is the same model and the contributor has already tuned the thresholds.
Sharing your programs: When you have programs with golden reference cycles (cycles marked ⭐ in the Cycles tab, or captured via Record Mode), the Share this device button uploads them to the store. Contributions are reviewed; once five distinct users confirm a setup works for their machine, it is auto-approved. Phase maps and detection settings can optionally be bundled with the share.
See docs/STORE.md for the full guide, including privacy details, contribution tips, and step-by-step instructions.
🇦🇱 Shqip • 🇧🇦 Bosanski • 🇧🇬 Български • 🇭🇷 Hrvatski • 🇨🇿 Čeština • 🇩🇰 Dansk • 🇳🇱 Nederlands • 🇬🇧 English • 🇪🇪 Eesti • 🇫🇮 Suomi • 🇫🇷 Français • 🇩🇪 Deutsch • 🇬🇷 Ελληνικά • 🇭🇺 Magyar • 🇮🇸 Íslenska • 🇮🇹 Italiano • 🇯🇵 日本語 • 🇰🇷 한국어 • 🇱🇻 Latviešu • 🇱🇹 Lietuvių • 🇲🇰 Македонски • 🇳🇴 Norsk • 🇵🇱 Polski • 🇵🇹 Português • 🇧🇷 Português (BR) • 🇷🇴 Română • 🇷🇺 Русский • 🇷🇸 Srpski • 🇸🇰 Slovenčina • 🇸🇮 Slovenščina • 🇪🇸 Español • 🇸🇪 Svenska • 🇹🇷 Türkçe • 🇺🇦 Українська • 🇨🇳 简体中文
Licensed under the GNU Affero General Public License v3.0 or later (AGPL-3.0-or-later). This software is provided free of charge. You are free to use, study, modify, and distribute it under the terms of the AGPL-3.0-or-later. Any modified version that you run as a network service must also be made available as open source under the same licence. See LICENSE for the full terms.
more like this
A to-do list that runs your Claude Code agents — capture anywhere, dispatch in parallel, review from your phone.
Arduino library and MATLAB/Simulink API for the AutomationShield Arduino expansion boards for control engineering educa…
search projects, people, and tags