 FedericoCeratto
agentlytics
Comprehensive analytics dashboard for AI coding agents — Cursor, Windsurf, Claude Code, VS Code Copilot, Zed, Antigravi…
JavaScript★ 555
Dashing is a library to quickly create terminal-based dashboards in Python.
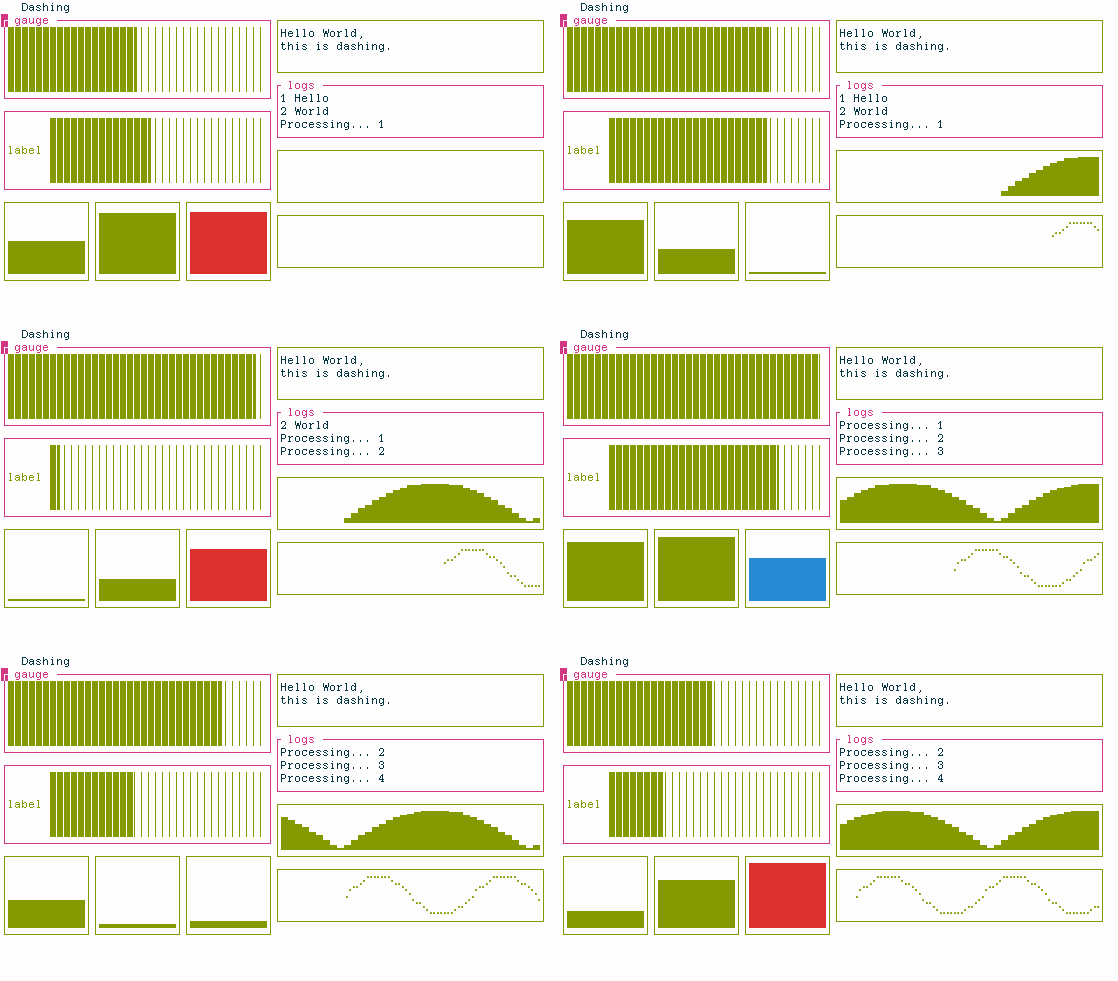
Similar libraries for other languages: termui blessed blessed-contrib
Features: - [x] Sub-character resolution (partially filled blocks) - [x] Horizontal and vertical bars with gradient coloring - [x] Text and log panes with automated scrolling - [x] Automatic scaling of all elements - [x] Vertical and horizontal tile splitting - [x] Braille-filled charts - [x] Theming with 24-bit RGB and HSV colors - [x] Color gradients
The blessed library.
Use packages from your Linux distribution, or:
pip install dashing
See the documentation at https://dashing.readthedocs.io/en/latest/
Usageimport math
from time import time, sleep
from dashing import (
ColorRangeVGauge,
HBrailleChart,
HChart,
HGauge,
HSplit,
Log,
Text,
VChart,
VGauge,
VSplit,
)
if __name__ == '__main__':
ui = HSplit(
VSplit(
HGauge(val=50, title="only title", border_color=5),
HGauge(label="only label", val=20, border_color=5),
HGauge(label="only label", val=30, border_color=5),
HGauge(label="only label", val=50, border_color=5),
HGauge(label="only label", val=80, border_color=5),
HGauge(val=20),
HGauge(label="label, no border", val=55),
HSplit(
VGauge(val=0, border_color=2),
VGauge(val=5, border_color=2),
VGauge(val=30, border_color=2),
VGauge(val=50, border_color=2),
VGauge(val=80, border_color=2, color=4),
VGauge(val=95, border_color=2, color=3),
ColorRangeVGauge(
val=100,
border_color=2,
colormap=(
(33, 2),
(66, 3),
(100, 1),
)
),
)
),
VSplit(
Text('Hello World,\nthis is dashing.', border_color=2),
Log(title='logs', border_color=5),
VChart(border_color=2, color=2),
HChart(border_color=2, color=2),
HBrailleChart(border_color=2, color=2),
# HBrailleFilledChart(border_color=2, color=2),
),
title='Dashing',
)
log = ui.items[1].items[1]
vchart = ui.items[1].items[2]
hchart = ui.items[1].items[3]
bchart = ui.items[1].items[4]
# bfchart = ui.items[1].items[5]
log.append("0 -----")
log.append("1 Hello")
log.append("2 -----")
prev_time = time()
with open_terminal() as terminal:
for cycle in range(0, 200):
ui.items[0].items[0].value = int(50 + 49.9 * math.sin(cycle / 80.0))
ui.items[0].items[1].value = int(50 + 45 * math.sin(cycle / 20.0))
ui.items[0].items[2].value = int(50 + 45 * math.sin(cycle / 30.0 + 3))
vgauges = ui.items[0].items[-1].items
for gaugenum, vg in enumerate(vgauges):
vg.value = 50 + 49.9 * math.sin(cycle / 12.0 + gaugenum)
t = int(time())
if t != prev_time:
log.append("%s" % t)
prev_time = t
vchart.append(50 + 50 * math.sin(cycle / 16.0))
hchart.append(99.9 * abs(math.sin(cycle / 26.0)))
bchart.append(50 + 50 * math.sin(cycle / 6.0))
# bfchart.append(50 + 50 * math.sin(cycle / 16.0))
ui.display(terminal)
sleep(1.0 / 25)
more like this
Comprehensive analytics dashboard for AI coding agents — Cursor, Windsurf, Claude Code, VS Code Copilot, Zed, Antigravi…
meine 🌒 - A CLI file manager and system utility built with Textual. It combines intuitive command parsing with rich t…
Launcher and management utility for running an Astroneer Dedicated Server on Linux using WINE
search projects, people, and tags