
ML-MCU
Code for IoT Journal paper 'ML-MCU: A Framework to Train ML Classifiers on MCU-based IoT Edge Devices'
C★ 51
A dedicated performance counter mainly for micro-controllers. For Cortex-M processors, the Systick will be used by de…
 GorgonMeducer
git clone https://github.com/GorgonMeducer/perf_counter.gitGorgonMeducer/perf_counter
A dedicated performance counter mainly for micro-controllers.
For Cortex-M processors, the Systick will be used by default. The perf_counter shares the SysTick with users' original SysTick function(s) without interfering with it. This library will bring new functionalities, such as performance counter, perfc_delay_us, perfc_delay_ms and clock() service defined in time.h.
A dedicated template is provided to port the perf_counter to different architectures or using a different Timer instead of SysTick in Cortex-M processors.
__cycleof__() , __super_loop_monitor__() , __cpu_usage__(), __cpu_perf__() etc.start_cycle_counter(), stop_cycle_counter() etc.Support ALL Cortex-M processors
Easy to port to a different architecture with a porting template
perfc_delay_us() and perfc_delay_ms() with 64bit return value.
perfc_delay_us_user_code_in_loop() and perfc_delay_ms_user_code_in_loop() for users to override, e.g. feeding the watchdog.get_system_ticks(), get_system_us and get_system_ms().false to perfc_init(), it is possible to use perf_counter in ISRs or global interrupt handling is disabled.perfc_check_task_stack_canary_safe()__PERFC_SAFE to avoid blocking high priority ISRs and tasks. Users should define the system timer priority level with macro __PERFC_SYSTIMER_PRIORITY__ . In Cortex-M, 0 means the highest configurable exception level.__IS_COMPILER_ARM_COMPILER_6__, __IS_COMPILER_LLVM__ etc.__COMPILER_HAS_GNU_EXTENSIONS____IS_COMPILER_SUPPORT_C99____IS_COMPILER_SUPPORT_C11____IRQ_SAFE{...}.with()foreach(), dimof() and CONNECT()using()__PLOOC_VA_NUM_ARGS().__perfc_sync_barrier__() for code barrier.__stack_usage__() and __stack_usage_max__() to measure the stack usage for a given code segment.ISR() to measure the stack usage of a given Cortex-M Exception handling.
__PERFC_STACK_CHECK_IN_ISR__ in project configuration to enable this feature.__PERFC_STACK_WATERMARK_U32__ in your project configuration to override the default watermark, i.e. 0xDEADBEEF.__PERFC_STACK_GROWS_UPWARD__ to switch.perfc_coroutine_stack_remain() to get the stack usage info.__PERFC_COROUTINE_NO_STACK_CHECK__ in compilation command line disables the stack-checking feature.Following functions/macros are deprecated, please use the version with perfc_ as prefix:
init_cycle_counter() -> perfc_init()delay_us() -> perfc_delay_us()delay_ms() -> perfc_delay_ms()CONNECT() -> PERFC_CONNECT()using() -> perfc_using()with() -> perfc_with()foreach() -> perfc_foreach()You can define the macro __PERFC_NO_DEPRECATED__ to disable the alias of the deprecated APIs.
You can measure a specified code segment with a macro helper __cycleof__(), a wrapper of get_system_ticks().
Syntax:
__cycleof__(<Description String for the target>, [User Code, see ref 1]) {
    //! target code segment of measurement
    ...
}
Here, [ref 1] is a small user code to read the measurement result via a local variable __cycle_count__. This User Code is optional. If you don't put anything here, the measured result will be shown with a __perf_counter_printf__.
Note
The first parameter cannot be ignored. If you don't want to give a description string, please pass an empty string i.e. "".
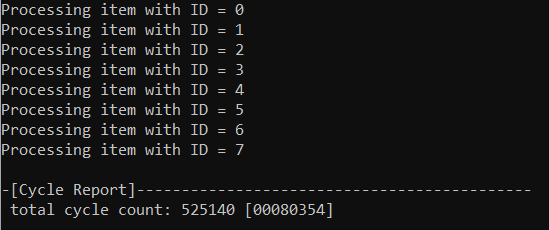
printf() __cycleof__("") {
foreach(example_lv0_t, s_tItem, ptItem) {
__perf_counter_printf__("Processing item with ID = %d\r\n", _->chID);
}
}
You will see the measured result in the console:
__cycle_counter__ int64_t lCycleResult = 0;
/* measure cycles and store it in a dedicated variable without printf */
__cycleof__("delay_us(1000ul)",
/* insert code to __cycleof__ body, "{}" can be omitted */
{
lCycleResult = __cycle_count__; /*< "__cycle_count__" stores the result */
}) {
perfc_delay_us(1000ul);
}
__perf_counter_printf__("\r\n delay_us(1000ul) takes %lld cycles\r\n", lCycleResult);
The result is read out from __cycle_count__and used in other place:
For both bare-metal and OS environments, you can measure the CPU Usage with macro __cpu_usage__() for a given code segment as long as it is executed repeatedly.
Syntax
__cpu_usage__(<Iteration Count before getting an average result>, [User Code, see ref 1]) {
    //! target code segment of measurement
    ...
}
Here, [ref 1] is a small user code to read the measurement result via a local variable __usage__. This User Code is optional. If you don't put anything here, the measured result will be shown with a __perf_counter_printf__.
void main(void)
{
    ...
    while (1) {
        __cpu_usage__(10) {
            perfc_delay_us(30000);
        }
        perfc_delay_us(70000);
    }
    ...
}
__usage__void main(void)
{
...
while (1) {
__cpu_usage__(10, {
float fUsage = __usage__; /*< "__usage__" stores the result */
__perf_counter_printf__("task 1 cpu usage %3.2f %%\r\n", (double)fUsage);
}) {
perfc_delay_us(30000);
}
perfc_delay_us(70000);
}
...
}
Note
The __usage__ stores the percentage information.
For Armv8.1-m processors that implement the PMU, it is easy to measure the CPI (Cycle per Instruction), L1 DCache miss rate and L1 ICache miss ratewith the macro __cpu_perf__().
Syntax:
__cpu_perf__(<Description String for the target>, [User Code, see ref 1]) {
    //! target code segment of measurement
    ...
}
Here, [ref 1] is a small user code to read the measurement result via a local struct variable __PERF_INFO__. This User Code is optional. If you don't put anything here, the measured result will be shown with a __perf_counter_printf__. The prototype of the __PERF_INFO__ is shown below:
struct {
    uint64_t dwNoInstr;                 /* number of instruction executed */
    uint64_t dwNoMemAccess;             /* number of memory access */
    uint64_t dwNoL1DCacheRefill;        /* number of L1 DCache Refill */
    uint64_t dwNoL1ICacheRefill;        /* number of L1 ICache Refill */
    int64_t lCycles;                    /* number of CPU cycles */
    uint32_t wInstrCalib;
    uint32_t wMemAccessCalib;
    float fCPI;                         /* Cycle per Instruction */
    float fDCacheMissRate;              /* L1 DCache miss rate in percentage */
    float fICacheMissRate;              /* L1 ICache miss rate in percentage */
} __PERF_INFO__;
For example, when inserting user code, you can read CPI from __PERF_INFO__.fCPI.
Example 1: measure the Coremark
void main(void)
{
    perfc_init(false);

    __perf_counter_printf__("Run coremark\r\n");

#ifdef __PERF_COUNTER_COREMARK__
    __cpu_perf__("Coremark") {
        coremark_main();
    }
#endif

    while(1) {
        __NOP();
    }
}
The result might look like the following:
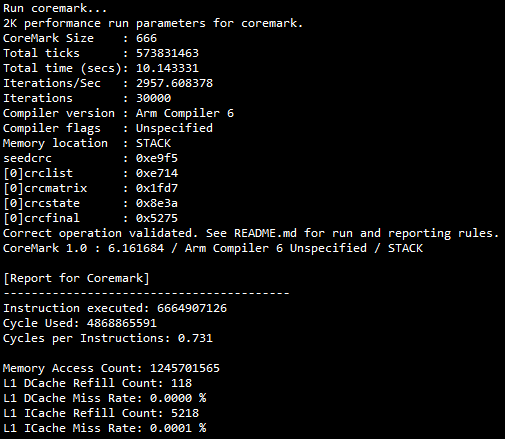
You can get the system timestamp (since the initialization of perf_counter service) via the functions get_system_ticks() and get_system_ms().
Note
The get_system_ms() is NOT a wrapper of the function get_system_ticks().
There are various ways to take advantage of those functions.
get_system_ms() as random seed#include <stdio.h>
#include <stdlib.h>
#include "perf_counter.h"
int main (void)
{
int i, n;
...
n = 5;
/* Initialize random number generator */
srand((unsigned) get_system_ticks());
/* Print 5 random numbers from 0 to 1024 */
for( i = 0 ; i < n ; i++ ) {
__perf_counter_printf__("%d\n", rand() & 0x3FF);
}
return(0);
}
    do {
        int64_t tStart = get_system_ticks();
        __IRQ_SAFE {
            __perf_counter_printf__("no interrupt \r\n");
        }
        __perf_counter_printf__("used clock cycle: %d", (int32_t)(get_system_ticks() - tStart));
    } while(0);
This example shows how to use the delta value of get_system_ticks() to measure the CPU cycles used by a specified code segment. In fact, the __cycleof__() is implemented in the same way:
#define __cycleof__(__STR, ...)                                                 \
            perfc_using(int64_t _ = get_system_ticks(), __cycle_count__ = _,    \
                {__perfc_sync_barrier__();},                                    \
                {                                                               \
                __perfc_sync_barrier__();                                       \
                _ = get_system_ticks() - _ - g_nOffset;                         \
                __cycle_count__ = _;                                            \
                if (__PLOOC_VA_NUM_ARGS(__VA_ARGS__) == 0) {                    \
                    __perf_counter_printf__("\r\n");                            \
                    __perf_counter_printf__("-[Cycle Report]");                 \
                    __perf_counter_printf__(                                    \
                        "------------------------------------\r\n");            \
                    __perf_counter_printf__(                                    \
                        __STR " total cycle count: %ld [%08lx]\r\n",            \
                            (long)_, (long)_);                                  \
                } else {                                                        \
                    __VA_ARGS__                                                 \
                };                                                              \
            })
perf_counter provides the basic timer services for delaying a given period and polling-for-timeout. For example:
perfc_delay_ms(1000);   /* block the program for 1000ms */
perfc_delay_us(50);	  /* block the program for 50us */

while(1) {
    /* return true every 1000 ms */
    if (perfc_is_time_out_ms(1000)) {
        /* print hello world every 1000 ms */
        __perf_counter_printf__("\r\nHello world\r\n");
    }
}
If you are using EventRecorder in MDK, once you deploy the perf_counter, it will provide the timer service for EventRecorder by implementing the following functions: EventRecorderTimerSetup(), EventRecorderTimerGetFreq() and EventRecorderTimerGetCount().
If you have not modified anything in EventRecorderConf.h, you don't have to, and please keep the default configuration. If you see warnings like this:
Invalid Time Stamp Source selected in EventRecorderConf.h!
Please set the macro EVENT_TIMESTAMP_SOURCE to 3 to suppress it.
Important
Please always make sure the macro EVENT_TIMESTAMP_FREQ is 0
By using perf_counter as the reference clock, EventRecorder can have the highest clock resolution on the target system without worrying about the presence of DWT or any conflicting usage of SysTick.
If you want to change the System Frequency, after the change, make sure:
The SystemCoreClock has been updated with the new system frequency. Usually, the HAL will update the SystemCoreClock automatically, but in some rare cases where SystemCoreClock is updated accordingly, you should do it yourself.
please call update_perf_counter() to notify perf_counter.
Some systems (e.g., FreeRTOS) might reconfigure the systick timer to fulfill the requirements of their feature. To support this:
Before the reconfiguration, please call function before_cycle_counter_reconfiguration().
NOTE: This function will stop the SysTick, clear the pending bit, and set the Load register and the Current Value registers to zero.
After the reconfiguration, please call update_perf_counter() to notify perf_counter the new changes.
git clone https://github.com/GorgonMeducer/perf_counter.git
perf_counter folderperf_counter.c and perfc_port_default.c to your project for compilation.Important
Please do NOT add any assembly source files of this perf_counter library to your compilation, i.e. systick_wrapper_gcc.S, systick_wrapper_gnu.s or systick_wrapper_ual.s.
perf_counter.h in the corresponding c source file:#include "perf_counter.h"
perf_counter.h and includes cmsis_compiler.h.perfc_port_insert_to_system_timer_insert_ovf_handler() in your SysTick_Handler()void SysTick_Handler(void)
{
...
perfc_port_insert_to_system_timer_insert_ovf_handler();
...
}
SystemCoreClock is updated with the same value as CPU frequency.Important
Make sure the SysTick_CTRL_CLKSOURCE_Msk bit ( bit 2) of SysTick->CTRL register is 1 that means SysTick runs with the same clock source as the target Cortex-M processor.
void main(void)
{
    //! setup system clock

    /*! \brief Update SystemCoreClock with the latest CPU frequency
     *!        If the function doesn't exist or doesn't work correctly,
     *!        Please update SystemCoreClock directly with the correct
     *!        system frequency in Hz.
     *!
     *!        extern volatile uint32_t SystemCoreClock;
     */
    SystemCoreClockUpdate();

    /*! \brief initialize perf_counter() and pass true if SysTick is
     *!        occupied by user applications or RTOS; otherwise, pass
     *!        false.
     */
    perfc_init(true);

    ...
    while(1) {
        ...
    }
}
Important
Please enable the GNU extension in your compiler. For GCC and CLANG, it is --std=gnu99 or --std=gnu11, and for other compilers, please check the user manual first. Fail to do so, you will not only trigger the warning in perf_counter.h, but also lose the function correctness of __cycleof__() and __super_loop_monitor__(), because __PLOOC_VA_NUM_ARGS() doesn't report 0 when passed with no argument.
#if !__COMPILER_HAS_GNU_EXTENSIONS__
#warning Please enable GNC extensions that is required by __cycleof__() and \
__super_loop_monitor__()
#endif
__PERF_COUNTER__ to your project GLOBALLY. It helps other modules to detect the existence of perf_counter. For Example, LVGL lv_conf_cmsis.h use this macro to detect perf_counter and uses get_system_ms() to implement lv_tick_get().-include "perfc_common.h" (or using equivalent option of your compiler) to the command line GLOBALLY.Enjoy !
Download the cmsis-pack from thecmsis-pack folder. It is a file with name GorgonMeducer.perf_counter.<version>.pack, for example GorgonMeducer.perf_counter.2.2.0.pack
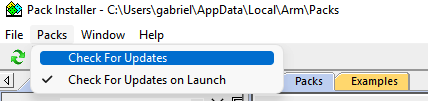
Double-click it to install this cmsis-pack. Once finished, you can find it in your Pack-Installer:
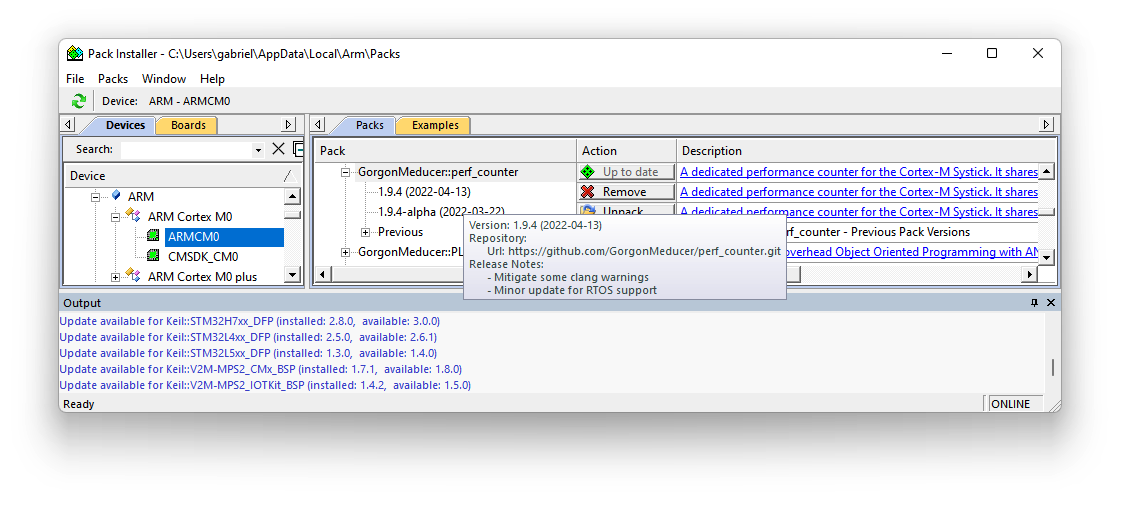
Packs->Check For Updates as shown below:
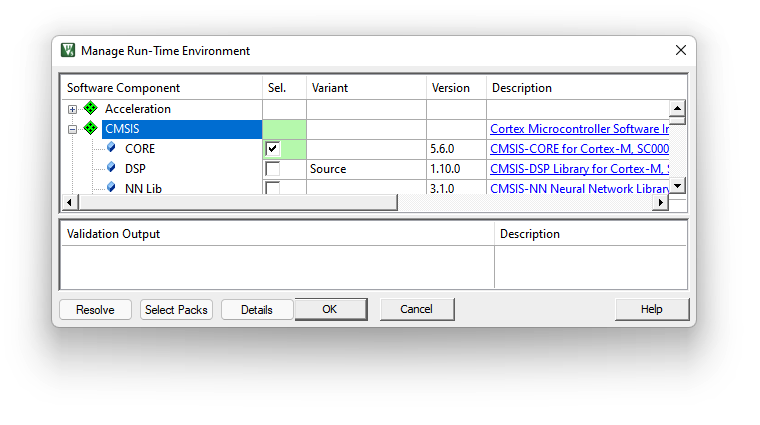
Open the RTE management window, find the Utilities and select the Core::Source inside perf_counter as shown below:
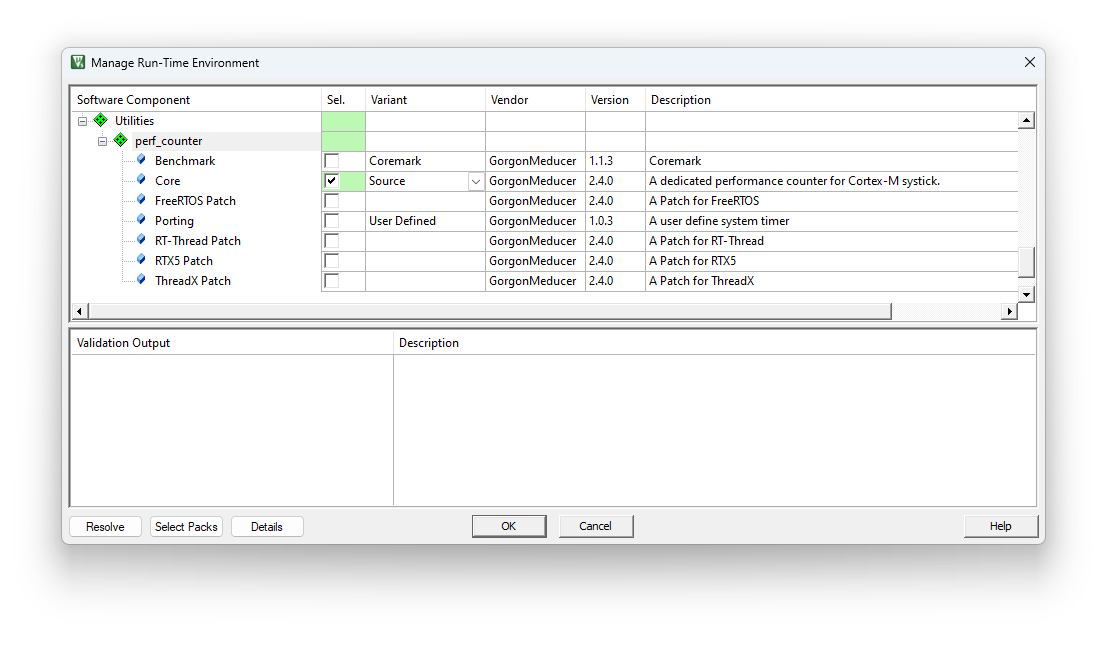
perf_counter.h in the corresponding c source file:#include "perf_counter.h"
perf_counter.h and includes cmsis_compiler.h. Usually, you should do this with RTE, as shown below:SystemCoreClock is updated with the same value as CPU frequency.Important
Make sure the SysTick_CTRL_CLKSOURCE_Msk bit ( bit 2) of SysTick->CTRL register is 1 that means SysTick runs with the same clock source as the target Cortex-M processor.
void main(void)
{
    //! Setup system clock

    /*! \brief Update SystemCoreClock with the latest CPU frequency
     *!        If the function doesn't exist or doesn't work correctly,
     *!        Please update SystemCoreClock directly with the correct
     *!        system frequency in Hz.
     *!
     *!        extern volatile uint32_t SystemCoreClock;
     */
    SystemCoreClockUpdate();

    /*! \brief initialize perf_counter() and pass true if SysTick is
     *!        occupied by user applications or RTOS; otherwise, pass
     *!        false.
     */
    perfc_init(true);

    ...
    while(1) {
        ...
    }
}
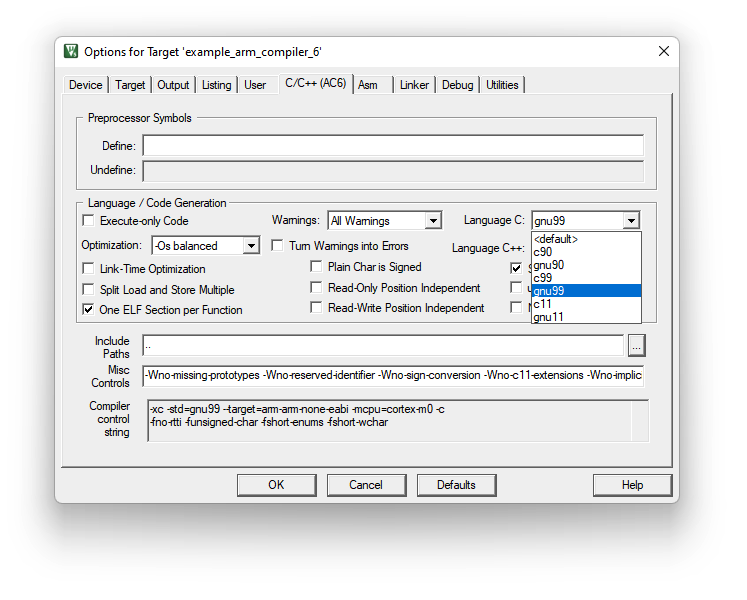
Please enable the GNU extension in your compiler.
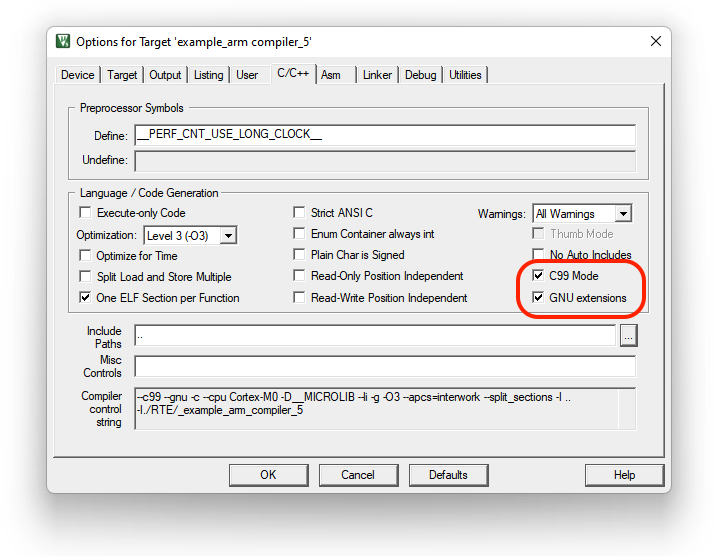
For Arm Compiler 5, please select both C99 mode and GNU extensions in the Option for target dialogue as shown below:
For Arm Compiler 6, please select gnu99 or gnu11 in Language C drop-list as shown below:
Failed to do so, you will not only trigger the warning in perf_counter.h, but also lose the function correctness of __cycleof__() and __super_loop_monitor__(), because __PLOOC_VA_NUM_ARGS() doesn't report 0 when passed with no argument.
#if !__COMPILER_HAS_GNU_EXTENSIONS__
#warning Please enable GNC extensions, that is required by __cycleof__() and \
__super_loop_monitor__()
#endif
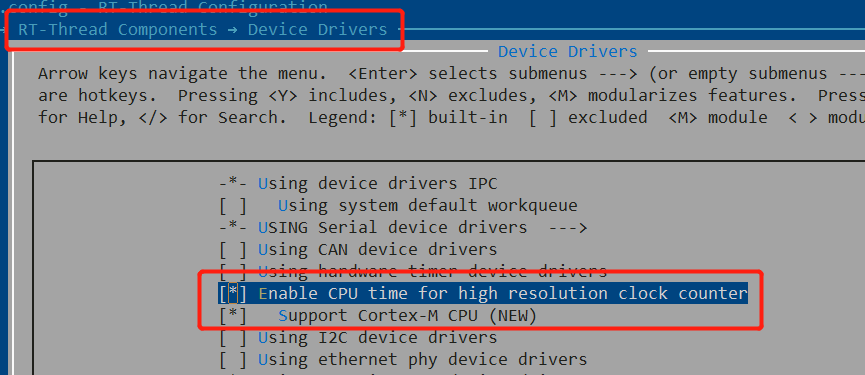
perf_counter has registered as one of the RT-Thread software packages, which locats in system category. In ENV or RT-Thread Studio, you just need to enable cputime framework. RT-Thread will automatically enable perf_counter if you are using Cortex-M architecture.
Enjoy !
Undefined symbol $Super$$SysTick_HandlerThis error usually appears in Arm Compiler 5 and Arm Compiler 6. It is because you haven't implemented any non-weak SysTick_Handler(). Please provide an EMPTY one in any c source file to solve this problem:
void SysTick_Handler(void)
{
}
NOTE: If you deploy perf_counter using cmsis-pack and encounter this issue, please DO NOT call function user_code_insert_to_systick_handler() in this should-be-empty SysTick_Handler().
Since version v2.1.0, I removed the unnecessary bundle feature from the cmsis-pack. If you have used the older version, you will encounter this issue. To solve this problem:
Sorry about this inconvenience.
perfc_delay_ms()?Since version v2.5.0, it is possible to feed the watchdog while waiting for perfc_delay_ms() to return. You can implement a function called perfc_delay_ms_user_code_in_loop() in ANY of your C source file and use it to feed the watchdog:
bool perfc_delay_ms_user_code_in_loop(int64_t lRemainInMs)
{
    UNUSED_PARAM(lRemainInMs); /* the lRemainInMs tells you about the remaining time in ms */

    extern void feed_watchdog(void);

    feed_watchdog();

	  /* return false to exit the perfc_delay_ms() earlier */
    /* usually, we just return true to wait until the end of the target period */
    return true;
}
YES. For such scenario, please initialize the perf_counter with:
perfc_init(false);
and make sure the system timer (e.g. SysTick) is only used by perf_counter. If the SysTick is used by an RTOS or other applications, you can port perf_counter to a different timer using the perfc_port_user.h and perfc_port_user.c stored in the template folder.
The Performance Counter for Microcontrollers, a.k.a. perf_counter is under Apache 2.0 license.
more like this
Code for IoT Journal paper 'ML-MCU: A Framework to Train ML Classifiers on MCU-based IoT Edge Devices'
search projects, people, and tags