perplexity-cli
🧠 A simple command-line client for the Perplexity API. Ask questions and receive answers directly from the terminal! 🚀🚀🚀
Python★ 176
A gping-inspired terminal visualization tool for monitoring real-time hardware sensor data from HWInfo.
 JuanjoFuchs
git clone https://github.com/JuanjoFuchs/hwinfo-tui.gitJuanjoFuchs/hwinfo-tui

A terminal plotting tool for visualizing real-time hardware sensor data from HWInfo64 (Windows), inspired by gping.
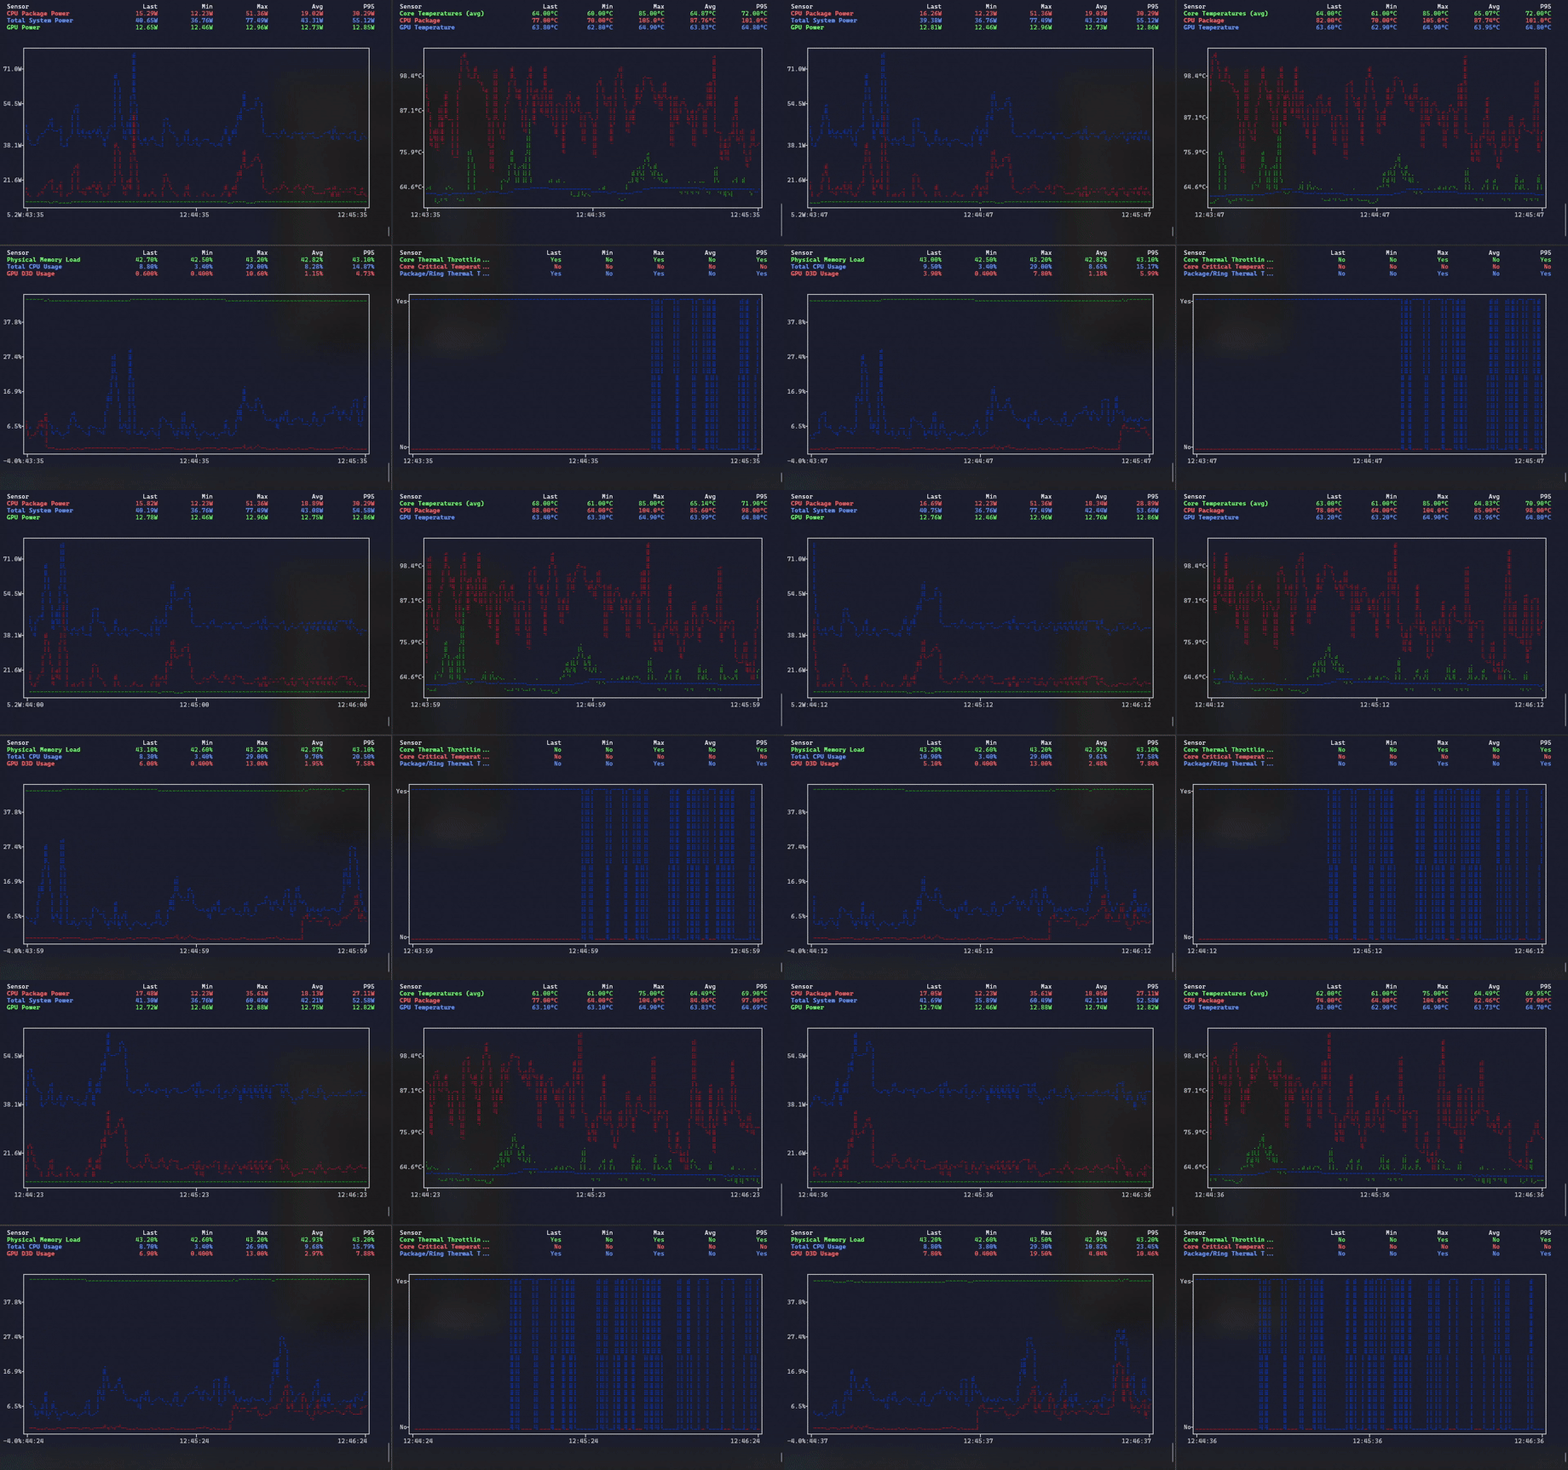
# top left pane
hwinfo-tui monitor sensors.CSV "CPU Package Power" "Total System Power" "GPU Power" --time-window 120 --refresh-rate 1

# bottom left pane
hwinfo-tui monitor sensors.CSV "Physical Memory Load" "Total CPU Usage" "GPU D3D Usage" --time-window 120 --refresh-rate 1

# top right pane
hwinfo-tui monitor sensors.CSV "Core Temperatures" "CPU Package" "GPU Temperature" --time-window 120 --refresh-rate 1

# bottom right pane
hwinfo-tui monitor sensors.CSV "Core Thermal Throttling" "Core Critical Temperature" "Package/Ring Thermal Throttling" --time-window 120 --refresh-rate 1
winget install hwinfo-tui
Or download the portable executable - no installation required.
pip install hwinfo-tui
git clone https://github.com/hwinfo-tui/hwinfo-tui.git
cd hwinfo-tui

# Quick setup (recommended)
./setup.sh  # or setup.bat/setup.ps1 on Windows

# Manual setup
python -m venv venv
source venv/bin/activate  # or venv\Scripts\activate on Windows
pip install -e .
Configure HWInfo64 logging (Windows): Open HWiNFO → Sensors → Start Logging → Choose CSV format and location
Monitor sensors:
# Basic usage
hwinfo-tui monitor sensors.csv "CPU Package"

# Multiple sensors
hwinfo-tui monitor sensors.csv "Core Temperatures" "GPU Temperature" "CPU Package"

# Mixed units with custom settings
hwinfo-tui monitor sensors.csv "Total CPU Usage" "Core Temperatures" --refresh-rate 0.5 --time-window 600
# Single unit (temperature)
hwinfo-tui monitor sensors.csv "Core Temperatures" "GPU Temperature" "CPU Package"

# Single unit (percentage)
hwinfo-tui monitor sensors.csv "Total CPU Usage" "GPU Core Load" "GPU Memory Usage"

# Dual units (temperature + percentage)
hwinfo-tui monitor sensors.csv "Core Temperatures" "Total CPU Usage" "GPU Temperature"

# Dual units (power + temperature)
hwinfo-tui monitor sensors.csv "CPU Package Power" "CPU Package" "GPU Power"

# List available sensors
hwinfo-tui list-sensors sensors.csv
hwinfo-tui list-sensors sensors.csv --unit "°C" --limit 20
Usage: hwinfo-tui [OPTIONS] COMMAND [ARGS]...
A gping-inspired terminal visualization tool for monitoring real-time hardware sensor data from HWInfo.
Options:
--version - Show version information and exit--install-completion - Install completion for the current shell--show-completion - Show completion for the current shell--help - Show this message and exitCommands:
monitor - Monitor hardware sensors in real-timelist-sensors - List all available sensors in the CSV fileUsage: hwinfo-tui monitor [OPTIONS] CSV_FILE SENSOR_NAMES...
Monitor hardware sensors in real-time.
Arguments:
CSV_FILE (required) - Path to HWInfo sensors.csv fileSENSOR_NAMES... (required) - One or more sensor names to monitor (supports partial matching)Options:
-r, --refresh-rate FLOAT - Update frequency in seconds (0.1-60.0) [default: 1.0]-w, --time-window INTEGER - History window in seconds (10-7200) [default: 300]--help - Show this message and exitUsage: hwinfo-tui list-sensors [OPTIONS] CSV_FILE
List all available sensors in the CSV file.
This command helps you discover sensor names for monitoring.
Arguments:
CSV_FILE (required) - Path to HWInfo sensors.csv fileOptions:
-u, --unit TEXT - Filter sensors by unit (e.g., '°C', '%', 'W')-l, --limit INTEGER - Maximum number of sensors to display (1-1000) [default: 50]--help - Show this message and exitHWInfo TUI automatically filters sensors based on their units:
# Third unit [W] would be excluded and show a warning
hwinfo-tui monitor sensors.csv "Core Temperatures" "Total CPU Usage" "CPU Power"
Note: While HWInfo TUI can run on any platform with Python, HWInfo64 is only available for Windows. On other platforms, you can use HWInfo TUI with CSV files generated on Windows.
No matching sensors found
hwinfo-tui list-sensors sensors.csv  # Check available sensors
hwinfo-tui monitor sensors.csv "CPU" "GPU"  # Use partial names
Too many units excluded
File not found
Poor performance
hwinfo-tui monitor sensors.csv "CPU" --refresh-rate 2.0 --time-window 120
Debug mode
HWINFO_TUI_LOG_LEVEL=DEBUG hwinfo-tui monitor sensors.csv "CPU"
Contributions welcome! See CONTRIBUTING.md for guidelines.
# Clone and setup
git clone https://github.com/hwinfo-tui/hwinfo-tui.git
cd hwinfo-tui
./setup.sh  # or setup.bat on Windows

# Activate environment
source ./activate.sh  # or activate.bat/activate.ps1 on Windows

# Run tests
pytest

# Run the app
hwinfo-tui monitor sensors.csv "CPU"
MIT License - see LICENSE file for details.
See CHANGELOG.md for version history and updates.
more like this
🧠 A simple command-line client for the Perplexity API. Ask questions and receive answers directly from the terminal! 🚀🚀🚀
search projects, people, and tags