perplexity-cli
🧠 A simple command-line client for the Perplexity API. Ask questions and receive answers directly from the terminal! 🚀🚀🚀
Python★ 176
Real-time Claude Code usage monitor with predictions and warnings
 Maciek-roboblog
git clone https://github.com/Maciek-roboblog/Claude-Code-Usage-Monitor.gitMaciek-roboblog/Claude-Code-Usage-Monitor
A privacy-first Claude Usage-Ops companion for Claude Code. It combines a Rich live terminal monitor with official statusline rate_limits, machine-readable state/export output, provenance labels, forecasting, and an opt-in local usage warehouse.
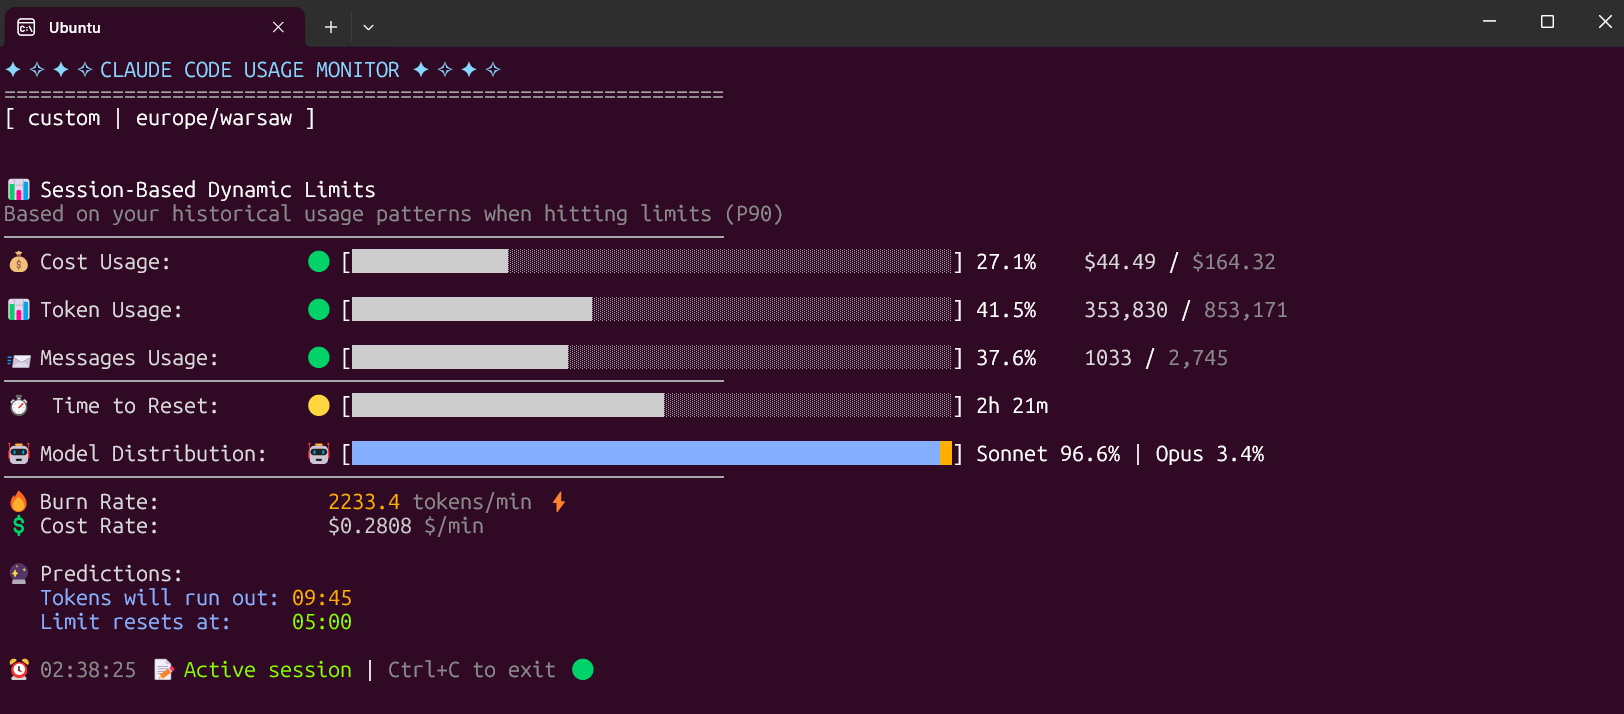
--statusline captures Claude Code's official rate_limits; stale or expired captures fall back to labeled local estimates.--once, --compact, and --write-state all use one versioned snapshot builder with automation exit codes.official, local_estimate, experimental, and unknown confidence.--data-paths, CLAUDE_CONFIG_DIR, and WSL discovery can scan multiple directories without merging unrelated accounts into one 5-hour window.--write-state or --once --output json.The Custom plan is now the default option, specifically designed for 5-hour Claude Code sessions. It monitors three critical metrics:
The Custom plan automatically adapts to your usage patterns by analyzing all your sessions from the last 192 hours (8 days) and calculating personalized limits based on your actual usage. This ensures accurate predictions and warnings tailored to your specific workflow.
Why uv is the best choice:
The fastest and easiest way to install and use the monitor:
# Install directly from PyPI with uv (easiest)
uv tool install claude-monitor

# Run from anywhere
claude-monitor  # or cmonitor, ccmonitor for short
# Clone and install from source
git clone https://github.com/Maciek-roboblog/Claude-Code-Usage-Monitor.git
cd Claude-Code-Usage-Monitor
uv tool install .

# Run from anywhere
claude-monitor
If you don't have uv installed yet, get it with one command:
# On Linux/macOS:
curl -LsSf https://astral.sh/uv/install.sh | sh

# On Windows:
powershell -ExecutionPolicy ByPass -c "irm https://astral.sh/uv/install.ps1 | iex"

# After installation, restart your terminal
# Install from PyPI
pip install claude-monitor

# If claude-monitor command is not found, add ~/.local/bin to PATH:
echo 'export PATH="$HOME/.local/bin:$PATH"' >> ~/.bashrc
source ~/.bashrc  # or restart your terminal

# Run from anywhere
claude-monitor  # or cmonitor, ccmonitor for short
⚠️ PATH Setup: If you see WARNING: The script claude-monitor is installed in '/home/username/.local/bin' which is not on PATH, follow the export PATH command above.
⚠️ Important: On modern Linux distributions (Ubuntu 23.04+, Debian 12+, Fedora 38+), you may encounter an "externally-managed-environment" error. Instead of using --break-system-packages, we strongly recommend:
- Use uv instead (see above) - it's safer and easier
- Use a virtual environment - python3 -m venv myenv && source myenv/bin/activate
- Use pipx - pipx install claude-monitor
See the Troubleshooting section for detailed solutions.
# Install with pipx
pipx install claude-monitor

# Run from anywhere
claude-monitor  # or claude-code-monitor, cmonitor, ccmonitor, ccm for short
# Install with pip in conda environment
pip install claude-monitor

# Run from anywhere
claude-monitor  # or cmonitor, ccmonitor for short
# Show help information
claude-monitor --help
| Parameter | Type | Default | Description |
|---|---|---|---|
| --plan | string | custom | Plan type: pro, max5, max20, team, or custom |
| --custom-limit-tokens | int | None | Token limit for custom plan (must be > 0) |
| --view | string | realtime | View type: realtime, daily, monthly, session, entries, sessions, or burn-rate |
| --output | string | rich | Output format: rich, json, text, or csv |
| --once | flag | False | Measure once, print a snapshot, and exit |
| --compact | flag | False | Single-line compact output for status bars |
| --write-state | flag | False | Write the snapshot to a state file for external tools |
| --state-file | path | None | State file path for --write-state |
| --statusline | flag | False | Run as a Claude Code statusline hook and capture official rate_limits |
| --api | flag | False | Enable the opt-in experimental Anthropic OAuth usage API |
| --data-paths | list | [] | Claude data directories to scan; repeat or comma-separate values |
| --warehouse | flag | False | Persist usage entries to the opt-in local warehouse |
| --warehouse-file | path | None | Usage warehouse file path |
| --warehouse-retention-days | int | 365 | Days of warehouse records to retain |
| --timezone | string | auto | Timezone (auto-detected). Examples: UTC, America/New_York, Europe/London |
| --time-format | string | auto | Time format: 12h, 24h, or auto |
| --theme | string | auto | Display theme: light, dark, classic, or auto |
| --refresh-rate | int | 10 | Data refresh rate in seconds (1-60) |
| --refresh-per-second | float | 0.75 | Display refresh rate in Hz (0.1-20.0) |
| --reset-hour | int | None | Daily reset hour (0-23) |
| --date-format | string | None | Date format for daily/monthly table periods |
| --abbreviate-tokens | flag | False | Abbreviate token counts in table views |
| --sparklines | flag | False | Show opt-in sparklines in table views |
| --filter-models | string | all | Use all models, or anthropic to exclude routed non-Claude models |
| --set-terminal-title | flag | False | Set the terminal title from the usage snapshot |
| --title-format | string | "{pct}% {plan}" | Terminal title template using pct, plan, used, limit, cost, reset |
| --hide-model-distribution | flag | False | Hide the model distribution bar |
| --no-header | flag | False | Hide the header banner |
| --no-emoji | flag | False | Render plain output without emoji |
| --log-level | string | INFO | Logging level: DEBUG, INFO, WARNING, ERROR, CRITICAL |
| --log-file | path | None | Log file path |
| --debug | flag | False | Enable debug logging |
| --version, -v | flag | False | Show version information |
| --clear | flag | False | Clear saved configuration |
| Plan | Token Limit | Cost Limit | Description |
|---|---|---|---|
| pro | 19,000 | $18.00 | Claude Pro subscription |
| max5 | 88,000 | $35.00 | Claude Max5 subscription |
| max20 | 220,000 | $140.00 | Claude Max20 subscription |
| team | estimate | unverified | Team label; prefer official statusline or --plan custom |
| custom | P90-based | (default) $50.00 | Auto-detection with ML analysis |
The tool can be invoked using any of these commands:
The monitor automatically saves your preferences to avoid re-specifying them on each run:
What Gets Saved:
Configuration Location: ~/.claude-monitor/last_used.json
Usage Examples:
# First run - specify preferences
claude-monitor --plan pro --theme dark --timezone "America/New_York"

# Subsequent runs - preferences automatically restored
claude-monitor --plan pro

# Override saved settings for this session
claude-monitor --plan pro --theme light

# Clear all saved preferences
claude-monitor --clear
Key Features:
--plan)# Default (Custom plan with auto-detection) claude-monitor # Alternative commands claude-code-monitor # Full descriptive name cmonitor # Short alias ccmonitor # Short alternative ccm # Shortest alias # Exit the monitor # Press Ctrl+C to gracefully exit
If running from source, use python -m claude_monitor from the src/ directory.
Use these surfaces when another tool needs current usage without scraping the Rich TUI:
# One-shot JSON snapshot with source/confidence/provenance fields
claude-monitor --once --output json

# Compact one-line status output
claude-monitor --once --compact

# Keep an atomically-written state file up to date for status bars and dashboards
claude-monitor --write-state --state-file ~/.claude-monitor/state/latest.json

# Install as a Claude Code statusline hook to capture official rate_limits
claude-monitor --statusline
--once exits with automation-friendly codes: 0 ok, 10 near limit, 11 limit hit, 20 indeterminate/no active session, and 30 no data or config error. When official statusline data is fresh it wins; otherwise the snapshot falls back to a labeled local estimate.
The warehouse is opt-in and local-only. It stores versioned records by source, account, project, model, and day so history can outlive Claude's 30-day cleanup.
# Start persisting usage locally
claude-monitor --warehouse

# Export warehouse-backed entries as JSON
claude-monitor --warehouse --view entries --output json

# Export session percentiles and burn-rate reports as CSV
claude-monitor --warehouse --view sessions --output csv
claude-monitor --warehouse --view burn-rate --output csv
# Custom plan with P90 auto-detection (Default)
claude-monitor --plan custom

# Pro plan (~44,000 tokens)
claude-monitor --plan pro

# Max5 plan (~88,000 tokens)
claude-monitor --plan max5

# Max20 plan (~220,000 tokens)
claude-monitor --plan max20

# Custom plan with explicit token limit
claude-monitor --plan custom --custom-limit-tokens 100000
# Reset at 3 AM
claude-monitor --reset-hour 3

# Reset at 10 PM
claude-monitor --reset-hour 22
# Real-time monitoring with live updates (Default)
claude-monitor --view realtime

# Daily token usage aggregated in table format
claude-monitor --view daily

# Monthly token usage aggregated in table format
claude-monitor --view monthly
# Adjust refresh rate (1-60 seconds, default: 10)
claude-monitor --refresh-rate 5

# Adjust display refresh rate (0.1-20 Hz, default: 0.75)
claude-monitor --refresh-per-second 1.0

# Set time format (auto-detected by default)
claude-monitor --time-format 24h  # or 12h

# Force specific theme
claude-monitor --theme dark  # light, dark, classic, auto

# Clear saved configuration
claude-monitor --clear
The default timezone is auto-detected from your system. Override with any valid timezone:
# Use US Eastern Time
claude-monitor --timezone America/New_York

# Use Tokyo time
claude-monitor --timezone Asia/Tokyo

# Use UTC
claude-monitor --timezone UTC

# Use London time
claude-monitor --timezone Europe/London
# Enable debug logging
claude-monitor --debug

# Log to file
claude-monitor --log-file ~/.claude-monitor/logs/monitor.log

# Set log level
claude-monitor --log-level WARNING  # DEBUG, INFO, WARNING, ERROR, CRITICAL
| Plan | Token Limit | Best For |
|---|---|---|
| custom | P90 auto-detect | Intelligent limit detection (default) |
| pro | ~19,000 | Claude Pro subscription |
| max5 | ~88,000 | Claude Max5 subscription |
| max20 | ~220,000 | Claude Max20 subscription |
rate_limits are treated as the live source of truth when fresh.--once, --compact, and --write-state.--statusline: Capture official Claude Code rate_limits.--once, --compact, --output json|text|csv: Script-friendly snapshot/report output.--write-state, --state-file: Atomic state files for companion tools.--warehouse, --warehouse-file, --warehouse-retention-days: Durable local usage history.--data-paths: Scan multiple Claude data directories without collapsing them.--filter-models anthropic: Exclude routed non-Claude models from Claude limit math.--set-terminal-title, --title-format: Snapshot-based terminal title updates.--no-header, --no-emoji, --hide-model-distribution: Glanceable display controls.claude-monitor; Python 3.9+ is still required.The new version features a complete rewrite with modular architecture following Single Responsibility Principle (SRP):
| Component | Description |
|---|---|
| CLI Module | Pydantic-based |
| Settings/Config | Type-safe |
| Error Handling | Sentry-ready |
| Rich Terminal UI | Adaptive Theme |
| Component | Key Responsibilities |
|---|---|
| Central Control Hub | Session Mgmt · Real-time Data Flow · Component Coordination |
| Data Manager | Cache Mgmt · File I/O · State Persist |
| Session Monitor | Real-time · 5 hr Windows · Token Track |
| UI Controller | Rich Display · Progress Bars · Theme System |
| Analytics | P90 Calculator · Burn Rate · Predictions |
| Component | Core Features |
|---|---|
| Core Models | Session Data · Config Schema · Type Safety |
| Analysis Engine | ML Algorithms · Statistical · Forecasting |
| Terminal Themes | Auto-detection · WCAG Colors · Contrast Opt |
| Claude API Data | Token Tracking · Cost Calculator · Session Blocks |
🔄 Data Flow: Claude Config Files → Data Layer → Analysis Engine → UI Components → Terminal Display
Claude Code operates on a 5-hour rolling session window system:
Example Session Timeline: 10:30 AM - First message (Session A starts at 10 AM) 03:00 PM - Session A expires (5 hours later)
12:15 PM - First message (Session B starts 12PM) 05:15 PM - Session B expires (5 hours later 5PM)
The monitor calculates burn rate using sophisticated analysis:
| Plan | Limit (Tokens) | Cost Limit | Messages | Algorithm |
|---|---|---|---|---|
| Claude Pro | 19,000 | $18.00 | 250 | Fixed local estimate |
| Claude Max5 | 88,000 | $35.00 | 1,000 | Fixed limit |
| Claude Max20 | 220,000 | $140.00 | 2,000 | Fixed limit |
| Claude Team | estimate | unverified | unknown | Label only; use statusline or custom |
| Custom | P90-based | (default) $50.00 | 250+ | Machine learning |
# Core dependencies (automatically installed)
pytz>=2023.3                # Timezone handling
rich>=13.7.0                # Rich terminal UI
pydantic>=2.0.0             # Type validation
pydantic-settings>=2.0.0    # Configuration management
numpy>=1.21.0               # Statistical calculations
pyyaml>=6.0                 # Configuration files
tomli>=1.2.0                # pyproject fallback on Python <3.11
tzdata                      # Windows timezone data
tzlocal>=5.0                # Windows local timezone to IANA resolver
wcwidth>=0.2.13             # Terminal display-width calculation
When using the default Pro plan:
The auto-detection system:
Scenario: You start work at 9 AM and want tokens to reset aligned with your schedule.
# Set custom reset time to 9 AM
./claude_monitor.py --reset-hour 9

# With your timezone
./claude_monitor.py --reset-hour 9 --timezone US/Eastern
Benefits:
Scenario: You often work past midnight and need flexible reset scheduling.
# Reset at midnight for clean daily boundaries
./claude_monitor.py --reset-hour 0

# Late evening reset (11 PM)
./claude_monitor.py --reset-hour 23
Strategy:
Scenario: Your token limits seem to change, and you're not sure of your exact plan.
# Auto-detect your highest previous usage
claude-monitor --plan custom_max

# Monitor with custom scheduling
claude-monitor --plan custom_max --reset-hour 6
Approach:
Scenario: You're working across different timezones or traveling.
# US East Coast
claude-monitor --timezone America/New_York

# Europe
claude-monitor --timezone Europe/London

# Asia Pacific
claude-monitor --timezone Asia/Singapore

# UTC for international team coordination
claude-monitor --timezone UTC --reset-hour 12
Scenario: You just want to see current status without configuration.
# Just run it with defaults
claude-monitor

# Press Ctrl+C after checking status
Scenario: Analyzing your token usage patterns over different time periods.
# View daily usage breakdown with detailed statistics
claude-monitor --view daily

# Analyze monthly token consumption trends
claude-monitor --view monthly --plan max20

# Export daily usage data to log file for analysis
claude-monitor --view daily --log-file ~/daily-usage.log

# Review usage in different timezone
claude-monitor --view daily --timezone America/New_York
Use Cases:
Start with Default (Recommended for New Users)
# Pro plan detection with auto-switching
claude-monitor
Known Subscription Users
# If you know you have Max5
claude-monitor --plan max5

# If you know you have Max20
claude-monitor --plan max20
Unknown Limits
# Auto-detect from previous usage
claude-monitor --plan custom_max
   # Begin monitoring when starting Claude work (uv installation)
   claude-monitor

   # Or development mode
   ./claude_monitor.py
   # Easy installation and updates with uv
   uv tool install claude-monitor
   claude-monitor --plan max5
   # Add to ~/.bashrc or ~/.zshrc (only for development setup)
   alias claude-monitor='cd ~/Claude-Code-Usage-Monitor && source venv/bin/activate && ./claude_monitor.py'
Monitor Burn Rate Velocity
Strategic Session Planning
   # Plan heavy usage around reset times
   claude-monitor --reset-hour 9
   # Always use your actual timezone
   claude-monitor --timezone Europe/Warsaw
Terminal Setup
Workflow Integration
   # Start monitoring with your development session (uv installation)
   tmux new-session -d -s claude-monitor 'claude-monitor'

   # Or development mode
   tmux new-session -d -s claude-monitor './claude_monitor.py'

   # Check status anytime
   tmux attach -t claude-monitor
Large Project Development
# Setup for sustained development
claude-monitor --plan max20 --reset-hour 8 --timezone America/New_York
Daily Routine:
Learning & Experimentation
# Flexible setup for learning
claude-monitor --plan pro
Sprint Development
# High-intensity development setup
claude-monitor --plan max20 --reset-hour 6
For contributors and developers who want to work with the source code:
# Clone the repository
git clone https://github.com/Maciek-roboblog/Claude-Code-Usage-Monitor.git
cd Claude-Code-Usage-Monitor

# Install in development mode
pip install -e .

# Run from source
python -m claude_monitor
The new version includes a comprehensive test suite:
# Run tests
cd src/
python -m pytest

# Run with coverage
python -m pytest --cov=claude_monitor --cov-report=html

# Run specific test modules
python -m pytest tests/test_analysis.py -v
Using a virtual environment is strongly recommended because:
If you don't have venv module available:
# Ubuntu/Debian
sudo apt-get update
sudo apt-get install python3-venv

# Fedora/RHEL/CentOS
sudo dnf install python3-venv

# macOS (usually comes with Python)
# If not available, install Python via Homebrew:
brew install python3

# Windows (usually comes with Python)
# If not available, reinstall Python from python.org
# Make sure to check "Add Python to PATH" during installation
Alternatively, use the virtualenv package:
# Install virtualenv via pip
pip install virtualenv

# Then create virtual environment with:
virtualenv venv
# instead of: python3 -m venv venv
# 1. Clone the repository
git clone https://github.com/Maciek-roboblog/Claude-Code-Usage-Monitor.git
cd Claude-Code-Usage-Monitor

# 2. Create virtual environment
python3 -m venv venv
# Or if using virtualenv package:
# virtualenv venv

# 3. Activate virtual environment
# On Linux/Mac:
source venv/bin/activate
# On Windows:
# venv\Scripts\activate

# 4. Install Python dependencies
pip install pytz
pip install rich>=13.0.0
# 5. Make script executable (Linux/Mac only)
chmod +x claude_monitor.py

# 6. Run the monitor
python claude_monitor.py
After initial setup, you only need:
# Navigate to project directory
cd Claude-Code-Usage-Monitor

# Activate virtual environment
source venv/bin/activate  # Linux/Mac
# venv\Scripts\activate   # Windows

# Run monitor
./claude_monitor.py  # Linux/Mac
# python claude_monitor.py  # Windows

# When done, deactivate
deactivate
Create an alias for quick access:
# Add to ~/.bashrc or ~/.zshrc
alias claude-monitor='cd ~/Claude-Code-Usage-Monitor && source venv/bin/activate && ./claude_monitor.py'

# Then just run:
claude-monitor
On modern Linux distributions (Ubuntu 23.04+, Debian 12+, Fedora 38+), you may encounter:
error: externally-managed-environment
× This environment is externally managed
Solutions (in order of preference):
   # Install uv first
   curl -LsSf https://astral.sh/uv/install.sh | sh

   # Then install with uv
   uv tool install claude-monitor
   # Install pipx
   sudo apt install pipx  # Ubuntu/Debian
   # or
   python3 -m pip install --user pipx

   # Install claude-monitor
   pipx install claude-monitor
   python3 -m venv myenv
   source myenv/bin/activate
   pip install claude-monitor
pip install --user claude-monitor --break-system-packages
⚠️ Warning: This bypasses system protection and may cause conflicts. We strongly recommend using a virtual environment instead.
If claude-monitor command is not found after pip installation:
   # Look for the warning message during pip install:
   # WARNING: The script claude-monitor is installed in '/home/username/.local/bin' which is not on PATH
   # Add this to ~/.bashrc or ~/.zshrc
   echo 'export PATH="$HOME/.local/bin:$PATH"' >> ~/.bashrc

   # Reload shell
   source ~/.bashrc  # or source ~/.zshrc
   # Find where pip installed the script
   pip show -f claude-monitor | grep claude-monitor
python3 -m claude_monitor
If you have multiple Python versions:
   python3 --version
   pip3 --version
   python3.11 -m pip install claude-monitor
   python3.11 -m claude_monitor
uv tool install claude-monitor
If you encounter the error No active session found, please follow these steps:
Initial Test: Launch Claude Code and send at least two messages. In some cases, the session may not initialize correctly on the first attempt, but it resolves after a few interactions.
Configuration Path: If the issue persists, consider specifying a custom configuration path. By default, Claude Code uses ~/.config/claude. You may need to adjust this path depending on your environment.
CLAUDE_CONFIG_DIR=~/.config/claude ./claude_monitor.py
Claude Monitor stays a CLI-first, privacy-first core. GUIs, tray apps, hardware
dashboards, and provider adapters belong in separate repositories; they should
consume the state/export protocol through --write-state or
--once --output json instead of parsing the Rich TUI or reimplementing the
analyzer.
# Long-running file for status bars, tray apps, and dashboards
claude-monitor --write-state --state-file ~/.claude-monitor/state/latest.json

# One-shot JSON for hooks and scripts
claude-monitor --once --output json
Claude Monitor's built-in limit window is the Claude Code subscription quota.
OpenCode, LiteLLM, Gemini/Qwen, z.ai, Bedrock, and other provider data should be
modeled as separate source adapters with their own source.kind. Adapters should
default to Claude Code data unless the user explicitly selects another source,
and they must not auto-merge OpenCode/API/provider entries into the Claude
5-hour subscription window.
For Cursor and Claude Desktop there is no local usage/limit signal comparable to
Claude Code's JSONL logs or statusline rate_limits, so they are out of scope
for built-in live limit tracking unless such a signal becomes available.
Have questions, suggestions, or want to collaborate? Feel free to reach out!
📧 Email: maciek@roboblog.eu
Whether you need help with setup, have feature requests, found a bug, or want to discuss potential improvements, don't hesitate to get in touch. I'm always happy to help and hear from users of the Claude Code Usage Monitor!
MIT License - feel free to use and modify as needed.
Want to contribute? Check out our Contributing Guide!
A special thanks to our supporters who help keep this project going:
Ed - Buy Me Coffee Supporter
"I appreciate sharing your work with the world. It helps keep me on track with my day. Quality readme, and really good stuff all around!"
⭐ Star this repo if you find it useful! ⭐
more like this
🧠 A simple command-line client for the Perplexity API. Ask questions and receive answers directly from the terminal! 🚀🚀🚀
Comprehensive analytics dashboard for AI coding agents — Cursor, Windsurf, Claude Code, VS Code Copilot, Zed, Antigravi…
Skill Claude Code de veille tech francophone. Agrège les flux RSS (Journal du Hacker, Human Coders News…) et produit un…
A to-do list that runs your Claude Code agents — capture anywhere, dispatch in parallel, review from your phone.
search projects, people, and tags