agentlytics
Comprehensive analytics dashboard for AI coding agents — Cursor, Windsurf, Claude Code, VS Code Copilot, Zed, Antigravi…
JavaScript★ 555
Automated developer-oriented status page with alerting and incident support
 TwiN
TwiN

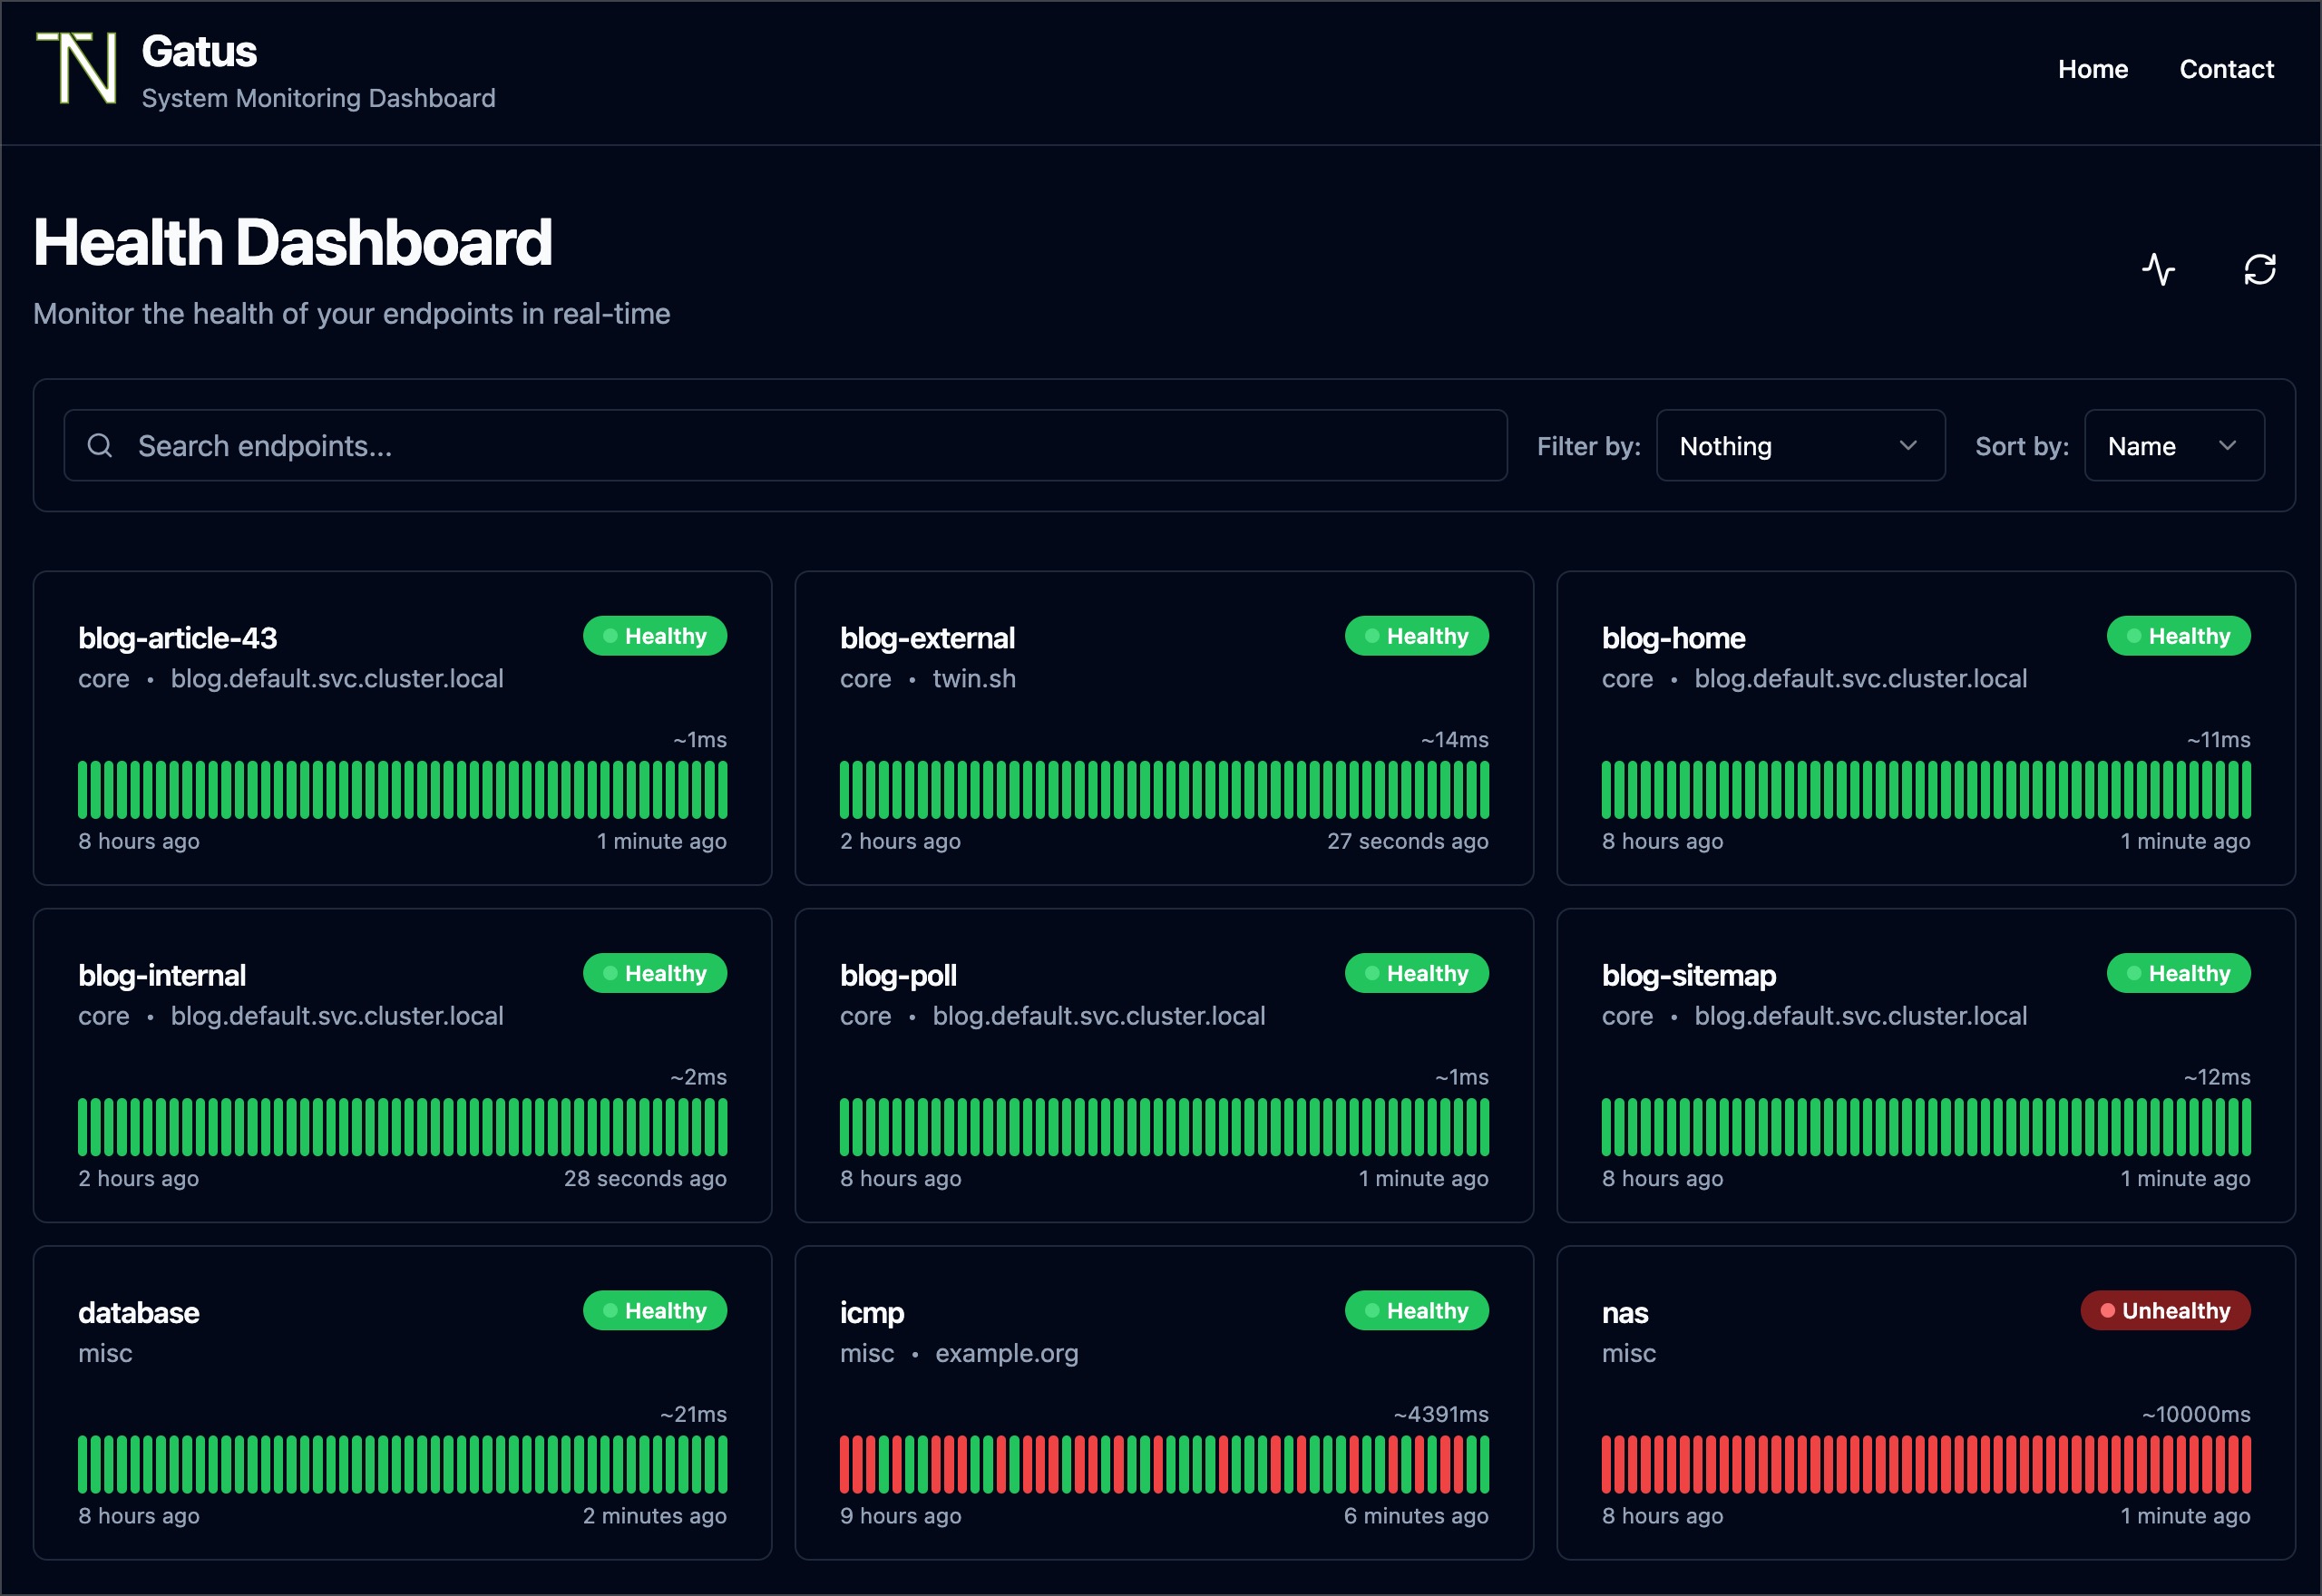
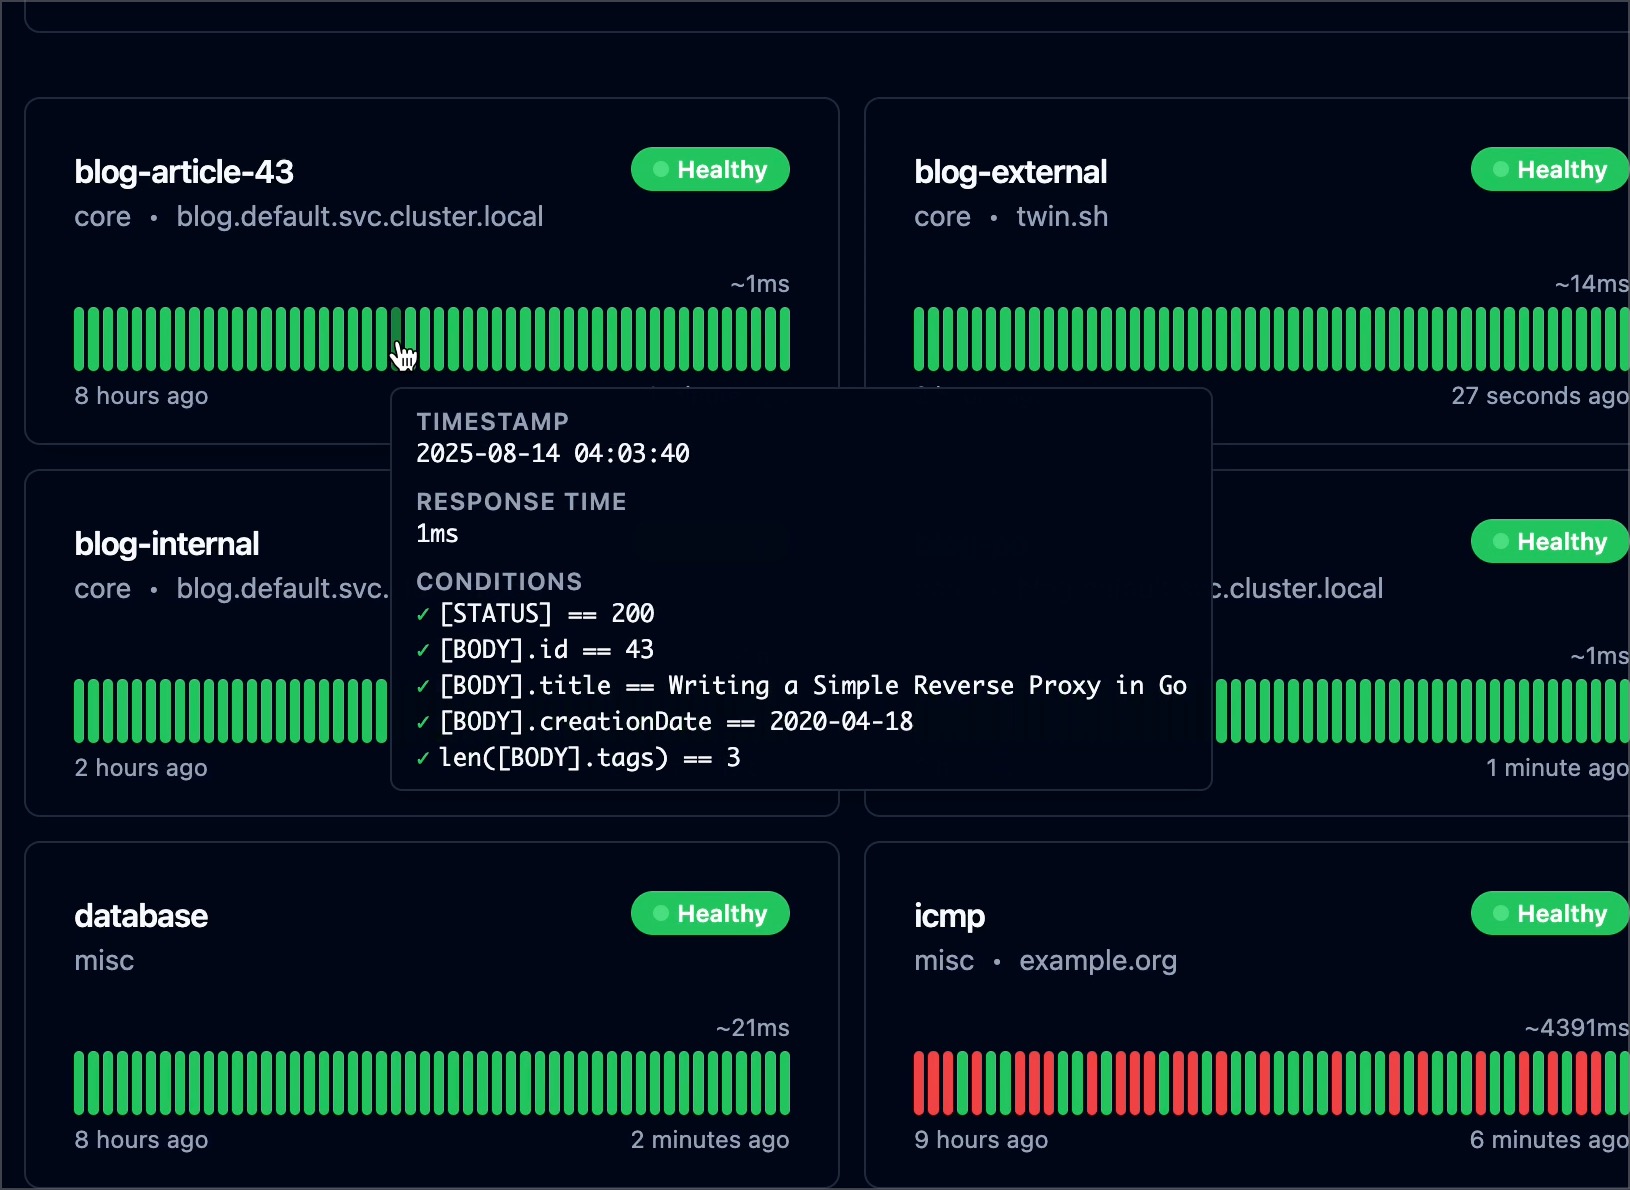
Gatus is a developer-oriented health dashboard that gives you the ability to monitor your services using HTTP, ICMP, TCP, and even DNS queries as well as evaluate the result of said queries by using a list of conditions on values like the status code, the response time, the certificate expiration, the body and many others. The icing on top is that each of these health checks can be paired with alerting via Slack, Teams, PagerDuty, Discord, Twilio and many more.
I personally deploy it in my Kubernetes cluster and let it monitor the status of my core applications: https://status.twin.sh/
Looking for a managed solution? Check out Gatus.io.
docker run -p 8080:8080 --name gatus ghcr.io/twin/gatus:stable
You can also use Docker Hub if you prefer:
docker run -p 8080:8080 --name gatus twinproduction/gatus:stable
For more details, see Usage
❤ Like this project? Please consider sponsoring me.
Have any feedback or questions? Create a discussion.
Before getting into the specifics, I want to address the most common question:
Why would I use Gatus when I can just use Prometheus’ Alertmanager, Cloudwatch or even Splunk?
Neither of these can tell you that there’s a problem if there are no clients actively calling the endpoint. In other words, it's because monitoring metrics mostly rely on existing traffic, which effectively means that unless your clients are already experiencing a problem, you won't be notified.
Gatus, on the other hand, allows you to configure health checks for each of your features, which in turn allows it to monitor these features and potentially alert you before any clients are impacted.
A sign you may want to look into Gatus is by simply asking yourself whether you'd receive an alert if your load balancer was to go down right now. Will any of your existing alerts be triggered? Your metrics won’t report an increase in errors if no traffic makes it to your applications. This puts you in a situation where your clients are the ones that will notify you about the degradation of your services rather than you reassuring them that you're working on fixing the issue before they even know about it.
The main features of Gatus are:
docker run -p 8080:8080 --name gatus ghcr.io/twin/gatus:stable
You can also use Docker Hub if you prefer:
docker run -p 8080:8080 --name gatus twinproduction/gatus:stable
If you want to create your own configuration, see Docker for information on how to mount a configuration file.
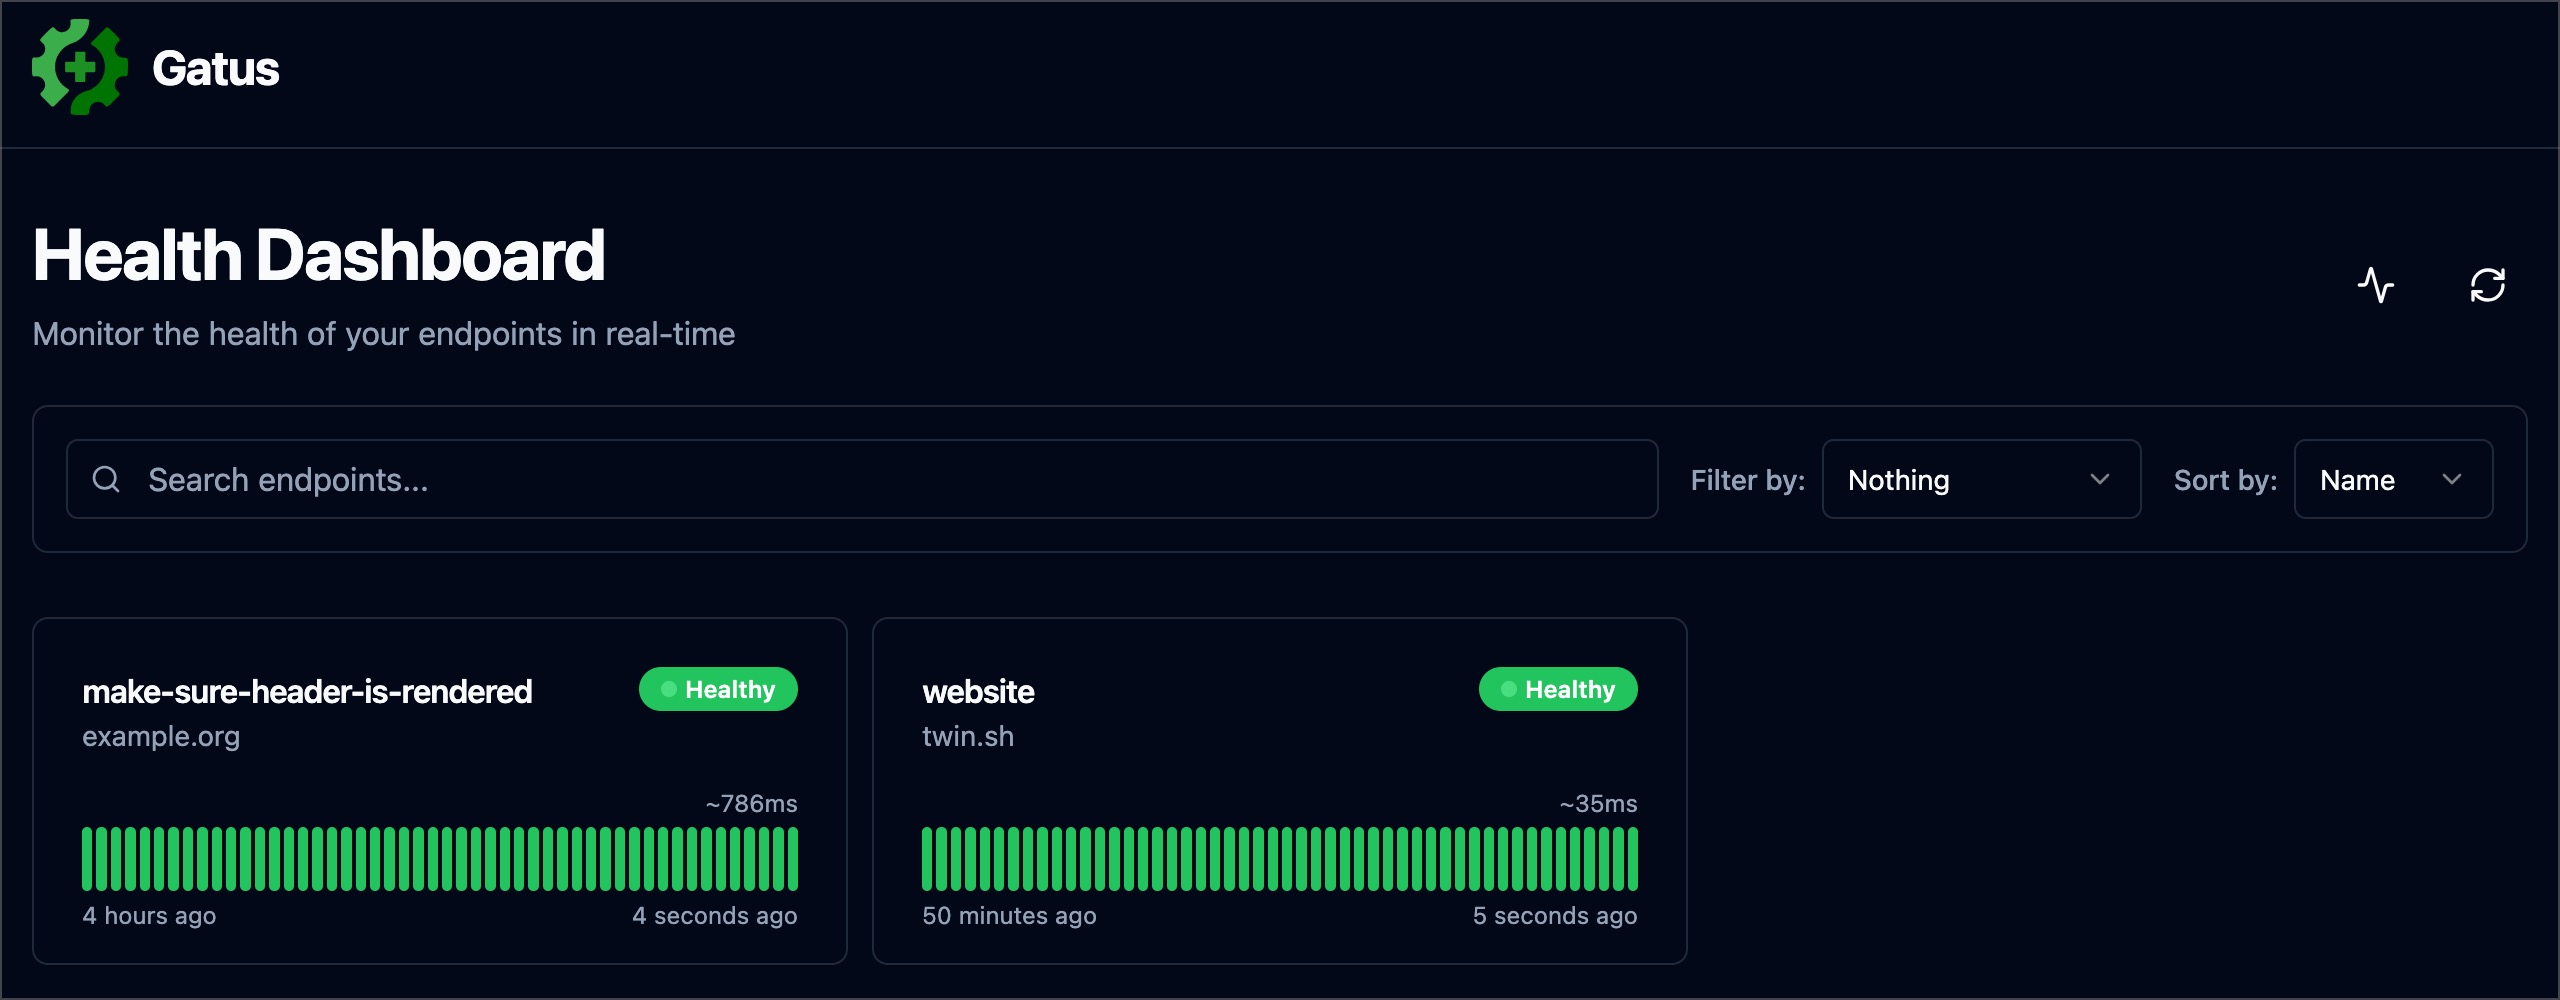
Here's a simple example:
endpoints:
  - name: website                 # Name of your endpoint, can be anything
    url: "https://twin.sh/health"
    interval: 5m                  # Duration to wait between every status check (default: 60s)
    conditions:
      - "[STATUS] == 200"         # Status must be 200
      - "[BODY].status == UP"     # The json path "$.status" must be equal to UP
      - "[RESPONSE_TIME] < 300"   # Response time must be under 300ms

  - name: make-sure-header-is-rendered
    url: "https://example.org/"
    interval: 60s
    conditions:
      - "[STATUS] == 200"                          # Status must be 200
      - "[BODY] == pat(*<h1>Example Domain</h1>*)" # Body must contain the specified header
This example would look similar to this:
If you want to test it locally, see Docker.
By default, the configuration file is expected to be at config/config.yaml.
You can specify a custom path by setting the GATUS_CONFIG_PATH environment variable.
If GATUS_CONFIG_PATH points to a directory, all *.yaml and *.yml files inside said directory and its
subdirectories are merged like so:
alerting.slack in one file and alerting.pagerduty in another file)endpoints in multiple files and each endpoint will be added to the final list of endpoints)metrics, alerting.slack.webhook-url, etc.) may only be defined once to forcefully avoid any ambiguity
alerting.slack.webhook-url in two files with different values. All files are merged into one before they are processed. This is by design.💡 You can also use environment variables in the configuration file (e.g.
$DOMAIN,${DOMAIN})⚠️ When your configuration parameter contains a
$symbol, you have to escape$with$$.See Use environment variables in config files or examples/docker-compose-postgres-storage/config/config.yaml for examples.
If you want to test it locally, see Docker.
| Parameter | Description | Default |
|---|---|---|
metrics |
Whether to expose metrics at /metrics. |
false |
storage |
Storage configuration. | {} |
alerting |
Alerting configuration. | {} |
announcements |
Announcements configuration. | [] |
endpoints |
Endpoints configuration. | Required [] |
external-endpoints |
External Endpoints configuration. | [] |
security |
Security configuration. | {} |
concurrency |
Maximum number of endpoints/suites to monitor concurrently. Set to 0 for unlimited. See Concurrency. |
3 |
disable-monitoring-lock |
Whether to disable the monitoring lock. Deprecated: Use concurrency: 0 instead. |
false |
skip-invalid-config-update |
Whether to ignore invalid configuration update. See Reloading configuration on the fly. |
false |
web |
Web configuration. | {} |
ui |
UI configuration. | {} |
maintenance |
Maintenance configuration. | {} |
If you want more verbose logging, you may set the GATUS_LOG_LEVEL environment variable to DEBUG.
Conversely, if you want less verbose logging, you can set the aforementioned environment variable to WARN, ERROR or FATAL.
The default value for GATUS_LOG_LEVEL is INFO.
Endpoints are URLs, applications, or services that you want to monitor. Each endpoint has a list of conditions that are evaluated on an interval that you define. If any condition fails, the endpoint is considered as unhealthy. You can then configure alerts to be triggered when an endpoint is unhealthy once a certain threshold is reached.
| Parameter | Description | Default |
|---|---|---|
endpoints |
List of endpoints to monitor. | Required [] |
endpoints[].enabled |
Whether to monitor the endpoint. | true |
endpoints[].name |
Name of the endpoint. Can be anything. | Required "" |
endpoints[].group |
Group name. Used to group multiple endpoints together on the dashboard. See Endpoint groups. |
"" |
endpoints[].url |
URL to send the request to. | Required "" |
endpoints[].method |
Request method. | GET |
endpoints[].conditions |
Conditions used to determine the health of the endpoint. See Conditions. |
[] |
endpoints[].interval |
Duration to wait between every status check. | 60s |
endpoints[].graphql |
Whether to wrap the body in a query param ({"query":"$body"}). |
false |
endpoints[].body |
Request body. | "" |
endpoints[].headers |
Request headers. | {} |
endpoints[].dns |
Configuration for an endpoint of type DNS. See Monitoring an endpoint using DNS queries. |
"" |
endpoints[].dns.query-type |
Query type (e.g. MX). | "" |
endpoints[].dns.query-name |
Query name (e.g. example.com). | "" |
endpoints[].ssh |
Configuration for an endpoint of type SSH. See Monitoring an endpoint using SSH. |
"" |
endpoints[].ssh.username |
SSH username (e.g. example). | Required "" |
endpoints[].ssh.password |
SSH password (e.g. password). | Required "" |
endpoints[].alerts |
List of all alerts for a given endpoint. See Alerting. |
[] |
endpoints[].maintenance-windows |
List of all maintenance windows for a given endpoint. See Maintenance. |
[] |
endpoints[].client |
Client configuration. | {} |
endpoints[].ui |
UI configuration at the endpoint level. | {} |
endpoints[].ui.hide-conditions |
Whether to hide conditions from the results. Note that this only hides conditions from results evaluated from the moment this was enabled. | false |
endpoints[].ui.hide-hostname |
Whether to hide the hostname from the results. | false |
endpoints[].ui.hide-port |
Whether to hide the port from the results. | false |
endpoints[].ui.hide-url |
Whether to hide the URL from the results. Useful if the URL contains a token. | false |
endpoints[].ui.hide-errors |
Whether to hide errors from the results. | false |
endpoints[].ui.dont-resolve-failed-conditions |
Whether to resolve failed conditions for the UI. | false |
endpoints[].ui.resolve-successful-conditions |
Whether to resolve successful conditions for the UI (helpful to expose body assertions even when checks pass). | false |
endpoints[].ui.badge.response-time |
List of response time thresholds. Each time a threshold is reached, the badge has a different color. | [50, 200, 300, 500, 750] |
endpoints[].extra-labels |
Extra labels to add to the metrics. Useful for grouping endpoints together. | {} |
endpoints[].always-run |
(SUITES ONLY) Whether to execute this endpoint even if previous endpoints in the suite failed. | false |
endpoints[].store |
(SUITES ONLY) Map of values to extract from the response and store in the suite context (stored even on failure). | {} |
You may use the following placeholders in the body (endpoints[].body):
[ENDPOINT_NAME] (resolved from endpoints[].name)[ENDPOINT_GROUP] (resolved from endpoints[].group)[ENDPOINT_URL] (resolved from endpoints[].url)[LOCAL_ADDRESS] (resolves to the local IP and port like 192.0.2.1:25 or [2001:db8::1]:80)[RANDOM_STRING_N] (resolves to a random string of numbers and letters of length N (max: 8192))Unlike regular endpoints, external endpoints are not monitored by Gatus, but they are instead pushed programmatically. This allows you to monitor anything you want, even when what you want to check lives in an environment that would not normally be accessible by Gatus.
For instance:
| Parameter | Description | Default |
|---|---|---|
external-endpoints |
List of endpoints to monitor. | [] |
external-endpoints[].enabled |
Whether to monitor the endpoint. | true |
external-endpoints[].name |
Name of the endpoint. Can be anything. | Required "" |
external-endpoints[].group |
Group name. Used to group multiple endpoints together on the dashboard. See Endpoint groups. |
"" |
external-endpoints[].token |
Bearer token required to push status to. | Required "" |
external-endpoints[].alerts |
List of all alerts for a given endpoint. See Alerting. |
[] |
external-endpoints[].heartbeat |
Heartbeat configuration for monitoring when the external endpoint stops sending updates. | {} |
external-endpoints[].heartbeat.interval |
Expected interval between updates. If no update is received within this interval, alerts will be triggered. Must be at least 10s. | 0 (disabled) |
Example:
external-endpoints:
  - name: ext-ep-test
    group: core
    token: "potato"
    heartbeat:
      interval: 30m  # Automatically create a failure if no update is received within 30 minutes
    alerts:
      - type: discord
        description: "healthcheck failed"
        send-on-resolved: true
To push the status of an external endpoint, you can use gatus-cli:
gatus-cli external-endpoint push --url https://status.example.org --key "core_ext-ep-test" --token "potato" --success
or send an HTTP request:
POST /api/v1/endpoints/{key}/external?success={success}&error={error}&duration={duration}
Where:
{key} has the pattern <GROUP_NAME>_<ENDPOINT_NAME> in which both variables have , /, _, ,, ., #, + and & replaced by -.
core_ext-ep-test.{success} is a boolean (true or false) value indicating whether the health check was successful or not.{error} (optional): a string describing the reason for a failed health check. If {success} is false, this should contain the error message; if the check is successful, this will be ignored.{duration} (optional): the time that the request took as a duration string (e.g. 10s).You must also pass the token as a Bearer token in the Authorization header.
Suites are collections of endpoints that are executed sequentially with a shared context. This allows you to create complex monitoring scenarios where the result from one endpoint can be used in subsequent endpoints, enabling workflow-style monitoring.
Here are a few cases in which suites could be useful:
| Parameter | Description | Default |
|---|---|---|
suites |
List of suites to monitor. | [] |
suites[].enabled |
Whether to monitor the suite. | true |
suites[].name |
Name of the suite. Must be unique. | Required "" |
suites[].group |
Group name. Used to group multiple suites together on the dashboard. | "" |
suites[].interval |
Duration to wait between suite executions. | 10m |
suites[].timeout |
Maximum duration for the entire suite execution. | 5m |
suites[].context |
Initial context values that can be referenced by endpoints. | {} |
suites[].endpoints |
List of endpoints to execute sequentially. | Required [] |
suites[].endpoints[].store |
Map of values to extract from the response and store in the suite context (stored even on failure). | {} |
suites[].endpoints[].always-run |
Whether to execute this endpoint even if previous endpoints in the suite failed. | false |
Note: Suite-level alerts are not supported yet. Configure alerts on individual endpoints within the suite instead.
Once values are stored in the context, they can be referenced in subsequent endpoints:
https://api.example.com/users/[CONTEXT].user_idAuthorization: Bearer [CONTEXT].auth_token{"user_id": "[CONTEXT].user_id"}[BODY].server_ip == [CONTEXT].server_ipNote that context/store keys are limited to A-Z, a-z, 0-9, underscores (_), and hyphens (-).
suites:
  - name: item-crud-workflow
    group: api-tests
    interval: 5m
    context:
      price: "19.99"  # Initial static value in context
    endpoints:
      # Step 1: Create an item and store the item ID
      - name: create-item
        url: https://api.example.com/items
        method: POST
        body: '{"name": "Test Item", "price": "[CONTEXT].price"}'
        conditions:
          - "[STATUS] == 201"
          - "len([BODY].id) > 0"
          - "[BODY].price == [CONTEXT].price"
        store:
          itemId: "[BODY].id"
        alerts:
          - type: slack
            description: "Failed to create item"

      # Step 2: Update the item using the stored item ID
      - name: update-item
        url: https://api.example.com/items/[CONTEXT].itemId
        method: PUT
        body: '{"price": "24.99"}'
        conditions:
          - "[STATUS] == 200"
        alerts:
          - type: slack
            description: "Failed to update item"

      # Step 3: Fetch the item and validate the price
      - name: get-item
        url: https://api.example.com/items/[CONTEXT].itemId
        method: GET
        conditions:
          - "[STATUS] == 200"
          - "[BODY].price == 24.99"
        alerts:
          - type: slack
            description: "Item price did not update correctly"

      # Step 4: Delete the item (always-run: true to ensure cleanup even if step 2 or 3 fails)
      - name: delete-item
        url: https://api.example.com/items/[CONTEXT].itemId
        method: DELETE
        always-run: true
        conditions:
          - "[STATUS] == 204"
        alerts:
          - type: slack
            description: "Failed to delete item"
The suite will be considered successful only if all required endpoints pass their conditions.
Here are some examples of conditions you can use:
| Condition | Description | Passing values | Failing values |
|---|---|---|---|
[STATUS] == 200 |
Status must be equal to 200 | 200 | 201, 404, ... |
[STATUS] < 300 |
Status must lower than 300 | 200, 201, 299 | 301, 302, ... |
[STATUS] <= 299 |
Status must be less than or equal to 299 | 200, 201, 299 | 301, 302, ... |
[STATUS] > 400 |
Status must be greater than 400 | 401, 402, 403, 404 | 400, 200, ... |
[STATUS] == any(200, 429) |
Status must be either 200 or 429 | 200, 429 | 201, 400, ... |
[CONNECTED] == true |
Connection to host must've been successful | true | false |
[RESPONSE_TIME] < 500 |
Response time must be below 500ms | 100ms, 200ms, 300ms | 500ms, 501ms |
[IP] == 127.0.0.1 |
Target IP must be 127.0.0.1 | 127.0.0.1 | 0.0.0.0 |
[BODY] == 1 |
The body must be equal to 1 | 1 | {}, 2, ... |
[BODY].user.name == john |
JSONPath value of $.user.name is equal to john |
{"user":{"name":"john"}} |
|
[BODY].data[0].id == 1 |
JSONPath value of $.data[0].id is equal to 1 |
{"data":[{"id":1}]} |
|
[BODY].age == [BODY].id |
JSONPath value of $.age is equal JSONPath $.id |
{"age":1,"id":1} |
|
len([BODY].data) < 5 |
Array at JSONPath $.data has less than 5 elements |
{"data":[{"id":1}]} |
|
len([BODY].name) == 8 |
String at JSONPath $.name has a length of 8 |
{"name":"john.doe"} |
{"name":"bob"} |
has([BODY].errors) == false |
JSONPath $.errors does not exist |
{"name":"john.doe"} |
{"errors":[]} |
has([BODY].users) == true |
JSONPath $.users exists |
{"users":[]} |
{} |
[BODY].name == pat(john*) |
String at JSONPath $.name matches pattern john* |
{"name":"john.doe"} |
{"name":"bob"} |
[BODY].id == any(1, 2) |
Value at JSONPath $.id is equal to 1 or 2 |
1, 2 | 3, 4, 5 |
[CERTIFICATE_EXPIRATION] > 48h |
Certificate expiration is more than 48h away | 49h, 50h, 123h | 1h, 24h, ... |
[DOMAIN_EXPIRATION] > 720h |
The domain must expire in more than 720h | 4000h | 1h, 24h, ... |
| Placeholder | Description | Example of resolved value |
|---|---|---|
[STATUS] |
Resolves into the HTTP status of the request | 404 |
[RESPONSE_TIME] |
Resolves into the response time the request took, in ms | 10 |
[IP] |
Resolves into the IP of the target host | 192.168.0.232 |
[BODY] |
Resolves into the response body. Supports JSONPath. | {"name":"john.doe"} |
[CONNECTED] |
Resolves into whether a connection could be established | true |
[CERTIFICATE_EXPIRATION] |
Resolves into the duration before certificate expiration (valid units are "s", "m", "h".) | 24h, 48h, 0 (if not protocol with certs) |
[DOMAIN_EXPIRATION] |
Resolves into the duration before the domain expires (valid units are "s", "m", "h".) | 24h, 48h, 1234h56m78s |
[DNS_RCODE] |
Resolves into the DNS status of the response | NOERROR |
| Function | Description | Example |
|---|---|---|
len |
If the given path leads to an array, returns its length. Otherwise, the JSON at the given path is minified and converted to a string, and the resulting number of characters is returned. Works only with the [BODY] placeholder. |
len([BODY].username) > 8 |
has |
Returns true or false based on whether a given path is valid. Works only with the [BODY] placeholder. |
has([BODY].errors) == false |
pat |
Specifies that the string passed as parameter should be evaluated as a pattern. Works only with == and !=. |
[IP] == pat(192.168.*) |
any |
Specifies that any one of the values passed as parameters is a valid value. Works only with == and !=. |
[BODY].ip == any(127.0.0.1, ::1) |
💡 Use
patonly when you need to.[STATUS] == pat(2*)is a lot more expensive than[STATUS] < 300.
Allows you to configure how and where the dashboard is being served.
| Parameter | Description | Default |
|---|---|---|
web |
Web configuration | {} |
web.address |
Address to listen on. | 0.0.0.0 |
web.port |
Port to listen on. | 8080 |
web.read-buffer-size |
Buffer size for reading requests from a connection. Also limit for the maximum header size. | 8192 |
web.tls.certificate-file |
Optional public certificate file for TLS in PEM format. | "" |
web.tls.private-key-file |
Optional private key file for TLS in PEM format. | "" |
Allows you to configure the application wide defaults for the dashboard's UI. Some of these parameters can be overridden locally by users using the local storage of their browser.
| Parameter | Description | Default |
|---|---|---|
ui |
UI configuration | {} |
ui.title |
Title of the document. | Health Dashboard ǀ Gatus |
ui.description |
Meta description for the page. | Gatus is an advanced.... |
ui.dashboard-heading |
Dashboard title between header and endpoints | Health Dashboard |
ui.dashboard-subheading |
Dashboard description between header and endpoints | Monitor the health of your endpoints in real-time |
ui.header |
Header at the top of the dashboard. Also used as the title on the OIDC login page. | Gatus |
ui.logo |
URL to the logo to display. When set, shown alongside the Gatus logo on the OIDC login page. | "" |
ui.link |
Link to open when the logo is clicked. | "" |
ui.favicon.default |
Favourite default icon to display in web browser tab or address bar. | /favicon.ico |
ui.favicon.size16x16 |
Favourite icon to display in web browser for 16x16 size. | /favicon-16x16.png |
ui.favicon.size32x32 |
Favourite icon to display in web browser for 32x32 size. | /favicon-32x32.png |
ui.buttons |
List of buttons to display below the header. | [] |
ui.buttons[].name |
Text to display on the button. | Required "" |
ui.buttons[].link |
Link to open when the button is clicked. | Required "" |
ui.custom-css |
Custom CSS | "" |
ui.dark-mode |
Whether to enable dark mode by default. Note that this is superseded by the user's operating system theme preferences. | true |
ui.default-sort-by |
Default sorting option for endpoints in the dashboard. Can be name, group, or health. Note that user preferences override this. |
name |
ui.default-filter-by |
Default filter option for endpoints in the dashboard. Can be none, failing, or unstable. Note that user preferences override this. |
none |
ui.login-subtitle |
Subtitle displayed on the OIDC login page. | System Monitoring Dashboard |
System-wide announcements allow you to display important messages at the top of the status page. These can be used to inform users about planned maintenance, ongoing issues, or general information. You can use markdown to format your announcements.
This is essentially what some status page calls "incident communications".
| Parameter | Description | Default |
|---|---|---|
announcements |
List of announcements to display | [] |
announcements[].timestamp |
UTC timestamp when the announcement was made (RFC3339 format) | Required |
announcements[].type |
Type of announcement. Valid values: outage, warning, information, operational, none |
"none" |
announcements[].message |
The message to display to users | Required |
announcements[].archived |
Whether to archive the announcement. Archived announcements show at the bottom of the status page instead of at the top. | false |
Types:
Example Configuration:
announcements:
  - timestamp: 2025-11-07T14:00:00Z
    type: outage
    message: "Scheduled maintenance on database servers from 14:00 to 16:00 UTC"
  - timestamp: 2025-11-07T16:15:00Z
    type: operational
    message: "Database maintenance completed successfully. All systems operational."
  - timestamp: 2025-11-07T12:00:00Z
    type: information
    message: "New monitoring dashboard features will be deployed next week"
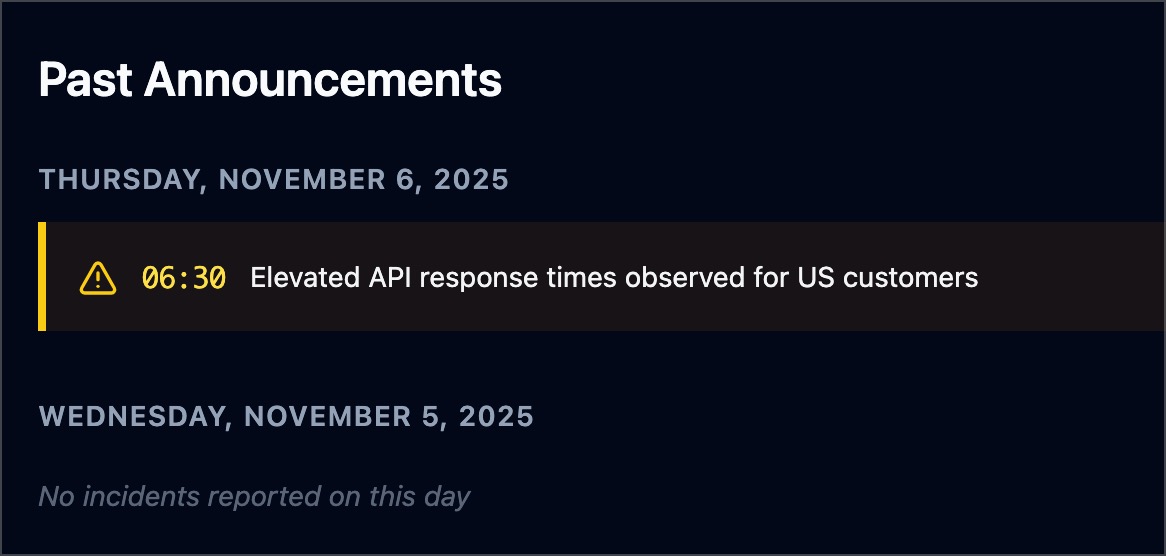
  - timestamp: 2025-11-06T09:00:00Z
    type: warning
    message: "Elevated API response times observed for US customers"
    archived: true
If at least one announcement is archived, a Past Announcements section will be rendered at the bottom of the status page:
| Parameter | Description | Default |
|---|---|---|
storage |
Storage configuration | {} |
storage.path |
Path to persist the data in. Only supported for types sqlite and postgres. |
"" |
storage.type |
Type of storage. Valid types: memory, sqlite, postgres. |
"memory" |
storage.caching |
Whether to use write-through caching. Improves loading time for large dashboards. Only supported if storage.type is sqlite or postgres |
false |
storage.maximum-number-of-results |
The maximum number of results that an endpoint can have | 100 |
storage.maximum-number-of-events |
The maximum number of events that an endpoint can have | 50 |
The results for each endpoint health check as well as the data for uptime and the past events must be persisted so that they can be displayed on the dashboard. These parameters allow you to configure the storage in question.
storage.type is memory (default):# Note that this is the default value, and you can omit the storage configuration altogether to achieve the same result. # Because the data is stored in memory, the data will not survive a restart. storage: type: memory maximum-number-of-results: 200 maximum-number-of-events: 5
storage.type is sqlite, storage.path must not be blank:storage: type: sqlite path: data.db
See examples/docker-compose-sqlite-storage for an example.
storage.type is postgres, storage.path must be the connection URL:storage: type: postgres path: "postgres://user:password@127.0.0.1:5432/gatus?sslmode=disable"
See examples/docker-compose-postgres-storage for an example.
In order to support a wide range of environments, each monitored endpoint has a unique configuration for the client used to send the request.
| Parameter | Description | Default |
|---|---|---|
client.insecure |
Whether to skip verifying the server's certificate chain and host name. | false |
client.ignore-redirect |
Whether to ignore redirects (true) or follow them (false, default). | false |
client.timeout |
Duration before timing out. | 10s |
client.dns-resolver |
Override the DNS resolver using the format {proto}://{host}:{port}. |
"" |
client.oauth2 |
OAuth2 client configuration. | {} |
client.oauth2.token-url |
The token endpoint URL | required "" |
client.oauth2.client-id |
The client id which should be used for the Client credentials flow |
required "" |
client.oauth2.client-secret |
The client secret which should be used for the Client credentials flow |
required "" |
client.oauth2.scopes[] |
A list of scopes which should be used for the Client credentials flow. |
required [""] |
client.proxy-url |
The URL of the proxy to use for the client | "" |
client.identity-aware-proxy |
Google Identity-Aware-Proxy client configuration. | {} |
client.identity-aware-proxy.audience |
The Identity-Aware-Proxy audience. (client-id of the IAP oauth2 credential) | required "" |
client.tls.certificate-file |
Path to a client certificate (in PEM format) for mTLS configurations. | "" |
client.tls.private-key-file |
Path to a client private key (in PEM format) for mTLS configurations. | "" |
client.tls.renegotiation |
Type of renegotiation support to provide. (never, freely, once). |
"never" |
client.network |
The network to use for ICMP endpoint client (ip, ip4 or ip6). |
"ip" |
client.tunnel |
Name of the SSH tunnel to use for this endpoint. See Tunneling. | "" |
client.store-cookies |
Whether to store cookies between requests. | false |
📝 Some of these parameters are ignored based on the type of endpoint. For instance, there's no certificate involved in ICMP requests (ping), therefore, setting
client.insecuretotruefor an endpoint of that type will not do anything.
This default configuration is as follows:
client:
  insecure: false
  ignore-redirect: false
  timeout: 10s
  store-cookies: false
Note that this configuration is only available under endpoints[], alerting.mattermost and alerting.custom.
Here's an example with the client configuration under endpoints[]:
endpoints:
  - name: website
    url: "https://twin.sh/health"
    client:
      insecure: false
      ignore-redirect: false
      timeout: 10s
    conditions:
      - "[STATUS] == 200"
This example shows how you can specify a custom DNS resolver:
endpoints:
  - name: with-custom-dns-resolver
    url: "https://your.health.api/health"
    client:
      dns-resolver: "tcp://8.8.8.8:53"
    conditions:
      - "[STATUS] == 200"
This example shows how you can use the client.oauth2 configuration to query a backend API with Bearer token:
endpoints:
  - name: with-custom-oauth2
    url: "https://your.health.api/health"
    client:
      oauth2:
        token-url: https://your-token-server/token
        client-id: 00000000-0000-0000-0000-000000000000
        client-secret: your-client-secret
        scopes: ['https://your.health.api/.default']
    conditions:
      - "[STATUS] == 200"
This example shows how you can use the client.identity-aware-proxy configuration to query a backend API with Bearer token using Google Identity-Aware-Proxy:
endpoints:
  - name: with-custom-iap
    url: "https://my.iap.protected.app/health"
    client:
      identity-aware-proxy:
        audience: "XXXXXXXX-XXXXXXXXXXXX.apps.googleusercontent.com"
    conditions:
      - "[STATUS] == 200"
📝 Note that Gatus will use the gcloud default credentials within its environment to generate the token.
This example shows you how you can use the client.tls configuration to perform an mTLS query to a backend API:
endpoints:
  - name: website
    url: "https://your.mtls.protected.app/health"
    client:
      tls:
        certificate-file: /path/to/user_cert.pem
        private-key-file: /path/to/user_key.pem
        renegotiation: once
    conditions:
      - "[STATUS] == 200"
📝 Note that if running in a container, you must volume mount the certificate and key into the container.
Gatus supports SSH tunneling to monitor internal services through jump hosts or bastion servers. This is particularly useful for monitoring services that are not directly accessible from where Gatus is deployed.
SSH tunnels are defined globally in the tunneling section and then referenced by name in endpoint client configurations.
| Parameter | Description | Default |
|---|---|---|
tunneling |
SSH tunnel configurations | {} |
tunneling.<tunnel-name> |
Configuration for a named SSH tunnel | {} |
tunneling.<tunnel-name>.type |
Type of tunnel (currently only SSH is supported) |
Required "" |
tunneling.<tunnel-name>.host |
SSH server hostname or IP address | Required "" |
tunneling.<tunnel-name>.port |
SSH server port | 22 |
tunneling.<tunnel-name>.username |
SSH username | Required "" |
tunneling.<tunnel-name>.password |
SSH password (use either this or private-key) | "" |
tunneling.<tunnel-name>.private-key |
SSH private key in PEM format (use either this or password) | "" |
client.tunnel |
Name of the tunnel to use for this endpoint | "" |
tunneling:
  production:
    type: SSH
    host: "jumphost.example.com"
    username: "monitoring"
    private-key: |
      -----BEGIN RSA PRIVATE KEY-----
      MIIEpAIBAAKCAQEA...
      -----END RSA PRIVATE KEY-----

endpoints:
  - name: "internal-api"
    url: "http://internal-api.example.com:8080/health"
    client:
      tunnel: "production"
    conditions:
      - "[STATUS] == 200"
⚠️ WARNING:: Tunneling may introduce additional latency, especially if the connection to the tunnel is retried frequently. This may lead to inaccurate response time measurements.
Gatus supports multiple alerting providers, such as Slack and PagerDuty, and supports different alerts for each individual endpoints with configurable descriptions and thresholds.
Alerts are configured at the endpoint level like so:
| Parameter | Description | Default |
|---|---|---|
alerts |
List of all alerts for a given endpoint. | [] |
alerts[].type |
Type of alert. See table below for all valid types. |
Required "" |
alerts[].enabled |
Whether to enable the alert. | true |
alerts[].failure-threshold |
Number of failures in a row needed before triggering the alert. | 3 |
alerts[].success-threshold |
Number of successes in a row before an ongoing incident is marked as resolved. | 2 |
alerts[].minimum-reminder-interval |
Minimum time interval between alert reminders. E.g. "30m", "1h45m30s" or "24h". If empty or 0, reminders are disabled. Cannot be lower than 5m. |
0 |
alerts[].send-on-resolved |
Whether to send a notification once a triggered alert is marked as resolved. | false |
alerts[].description |
Description of the alert. Will be included in the alert sent. | "" |
alerts[].provider-override |
Alerting provider configuration override for the given alert type | {} |
Here's an example of what an alert configuration might look like at the endpoint level:
endpoints:
  - name: example
    url: "https://example.org"
    conditions:
      - "[STATUS] == 200"
    alerts:
      - type: slack
        description: "healthcheck failed"
        send-on-resolved: true
You can also override global provider configuration by using alerts[].provider-override, like so:
endpoints:
  - name: example
    url: "https://example.org"
    conditions:
      - "[STATUS] == 200"
    alerts:
      - type: slack
        provider-override:
          webhook-url: "https://hooks.slack.com/services/**********/**********/**********"
📝 If an alerting provider is not properly configured, all alerts configured with the provider's type will be ignored.
| Parameter | Description | Default |
|---|---|---|
alerting.awsses |
Configuration for alerts of type awsses. See Configuring AWS SES alerts. |
{} |
alerting.clickup |
Configuration for alerts of type clickup. See Configuring ClickUp alerts. |
{} |
alerting.custom |
Configuration for custom actions on failure or alerts. See Configuring Custom alerts. |
{} |
alerting.datadog |
Configuration for alerts of type datadog. See Configuring Datadog alerts. |
{} |
alerting.discord |
Configuration for alerts of type discord. See Configuring Discord alerts. |
{} |
alerting.email |
Configuration for alerts of type email. See Configuring Email alerts. |
{} |
alerting.gitea |
Configuration for alerts of type gitea. See Configuring Gitea alerts. |
{} |
alerting.github |
Configuration for alerts of type github. See Configuring GitHub alerts. |
{} |
alerting.gitlab |
Configuration for alerts of type gitlab. See Configuring GitLab alerts. |
{} |
alerting.googlechat |
Configuration for alerts of type googlechat. See Configuring Google Chat alerts. |
{} |
alerting.gotify |
Configuration for alerts of type gotify. See Configuring Gotify alerts. |
{} |
alerting.homeassistant |
Configuration for alerts of type homeassistant. See Configuring HomeAssistant alerts. |
{} |
alerting.ifttt |
Configuration for alerts of type ifttt. See Configuring IFTTT alerts. |
{} |
alerting.ilert |
Configuration for alerts of type ilert. See Configuring ilert alerts. |
{} |
alerting.incident-io |
Configuration for alerts of type incident-io. See Configuring Incident.io alerts. |
{} |
alerting.line |
Configuration for alerts of type line. See Configuring Line alerts. |
{} |
alerting.matrix |
Configuration for alerts of type matrix. See Configuring Matrix alerts. |
{} |
alerting.mattermost |
Configuration for alerts of type mattermost. See Configuring Mattermost alerts. |
{} |
alerting.messagebird |
Configuration for alerts of type messagebird. See Configuring Messagebird alerts. |
{} |
alerting.n8n |
Configuration for alerts of type n8n. See Configuring n8n alerts. |
{} |
alerting.newrelic |
Configuration for alerts of type newrelic. See Configuring New Relic alerts. |
{} |
alerting.ntfy |
Configuration for alerts of type ntfy. See Configuring Ntfy alerts. |
{} |
alerting.opsgenie |
Configuration for alerts of type opsgenie. See Configuring Opsgenie alerts. |
{} |
alerting.pagerduty |
Configuration for alerts of type pagerduty. See Configuring PagerDuty alerts. |
{} |
alerting.plivo |
Configuration for alerts of type plivo. See Configuring Plivo alerts. |
{} |
alerting.pushover |
Configuration for alerts of type pushover. See Configuring Pushover alerts. |
{} |
alerting.rocketchat |
Configuration for alerts of type rocketchat. See Configuring Rocket.Chat alerts. |
{} |
alerting.sendgrid |
Configuration for alerts of type sendgrid. See Configuring SendGrid alerts. |
{} |
alerting.signal |
Configuration for alerts of type signal. See Configuring Signal alerts. |
{} |
alerting.signl4 |
Configuration for alerts of type signl4. See Configuring SIGNL4 alerts. |
{} |
alerting.slack |
Configuration for alerts of type slack. See Configuring Slack alerts. |
{} |
alerting.splunk |
Configuration for alerts of type splunk. See Configuring Splunk alerts. |
{} |
alerting.squadcast |
Configuration for alerts of type squadcast. See Configuring Squadcast alerts. |
{} |
alerting.teams |
Configuration for alerts of type teams. (Deprecated) See Configuring Teams alerts. |
{} |
alerting.teams-workflows |
Configuration for alerts of type teams-workflows. See Configuring Teams Workflow alerts. |
{} |
alerting.telegram |
Configuration for alerts of type telegram. See Configuring Telegram alerts. |
{} |
alerting.twilio |
Settings for alerts of type twilio. See Configuring Twilio alerts. |
{} |
alerting.vonage |
Configuration for alerts of type vonage. See Configuring Vonage alerts. |
{} |
alerting.webex |
Configuration for alerts of type webex. See Configuring Webex alerts. |
{} |
alerting.zapier |
Configuration for alerts of type zapier. See Configuring Zapier alerts. |
{} |
alerting.zulip |
Configuration for alerts of type zulip. See Configuring Zulip alerts. |
{} |
| Parameter | Description | Default |
|---|---|---|
alerting.aws-ses |
Settings for alerts of type aws-ses |
{} |
alerting.aws-ses.access-key-id |
AWS Access Key ID | Optional "" |
alerting.aws-ses.secret-access-key |
AWS Secret Access Key | Optional "" |
alerting.aws-ses.region |
AWS Region | Required "" |
alerting.aws-ses.from |
The Email address to send the emails from (should be registered in SES) | Required "" |
alerting.aws-ses.to |
Comma separated list of email address to notify | Required "" |
alerting.aws-ses.default-alert |
Default alert configuration. See Setting a default alert |
N/A |
alerting.aws-ses.overrides |
List of overrides that may be prioritized over the default configuration | [] |
alerting.aws-ses.overrides[].group |
Endpoint group for which the configuration will be overridden by this configuration | "" |
alerting.aws-ses.overrides[].* |
See alerting.aws-ses.* parameters |
{} |
alerting:
  aws-ses:
    access-key-id: "..."
    secret-access-key: "..."
    region: "us-east-1"
    from: "status@example.com"
    to: "user@example.com"

endpoints:
  - name: website
    interval: 30s
    url: "https://twin.sh/health"
    conditions:
      - "[STATUS] == 200"
      - "[BODY].status == UP"
      - "[RESPONSE_TIME] < 300"
    alerts:
      - type: aws-ses
        failure-threshold: 5
        send-on-resolved: true
        description: "healthcheck failed"
If the access-key-id and secret-access-key are not defined Gatus will fall back to IAM authentication.
Make sure you have the ability to use ses:SendEmail.
| Parameter | Description | Default |
|---|---|---|
alerting.clickup |
Configuration for alerts of type clickup |
{} |
alerting.clickup.list-id |
ClickUp List ID where tasks will be created | Required "" |
alerting.clickup.token |
ClickUp API token | Required "" |
alerting.clickup.api-url |
Custom API URL | https://api.clickup.com/api/v2 |
alerting.clickup.assignees |
List of user IDs to assign tasks to | [] |
alerting.clickup.status |
Initial status for created tasks | "" |
alerting.clickup.priority |
Priority level: urgent, high, normal, low, or none |
normal |
alerting.clickup.notify-all |
Whether to notify all assignees when task is created | true |
alerting.clickup.name |
Custom task name template (supports placeholders) | Health Check: [ENDPOINT_GROUP]:[ENDPOINT_NAME] |
alerting.clickup.content |
Custom task content template (supports placeholders) | Triggered: [ENDPOINT_GROUP] - [ENDPOINT_NAME] - [ALERT_DESCRIPTION] - [RESULT_ERRORS] |
alerting.clickup.default-alert |
Default alert configuration. See Setting a default alert |
N/A |
alerting.clickup.overrides |
List of overrides that may be prioritized over the default configuration | [] |
alerting.clickup.overrides[].group |
Endpoint group for which the configuration will be overridden by this configuration | "" |
alerting.clickup.overrides[].* |
See alerting.clickup.* parameters |
{} |
The ClickUp alerting provider creates tasks in a ClickUp list when alerts are triggered. If send-on-resolved is set to true on the endpoint alert, the task will be automatically closed when the alert is resolved.
The following placeholders are supported in name and content:
[ENDPOINT_GROUP] - Resolved from endpoints[].group[ENDPOINT_NAME] - Resolved from endpoints[].name[ALERT_DESCRIPTION] - Resolved from endpoints[].alerts[].description[RESULT_ERRORS] - Resolved from the health evaluation errorsalerting:
clickup:
list-id: "123456789"
token: "pk_xxxxxxxxxxxxxxxxxxxxxxxxxxxxxxxx"
assignees:
- "12345"
- "67890"
status: "in progress"
priority: high
name: "Health Check Alert: [ENDPOINT_GROUP] - [ENDPOINT_NAME]"
content: "Alert triggered for [ENDPOINT_GROUP] - [ENDPOINT_NAME] - [ALERT_DESCRIPTION] - [RESULT_ERRORS]"
endpoints:
- name: website
url: "https://twin.sh/health"
interval: 5m
conditions:
- "[STATUS] == 200"
alerts:
- type: clickup
send-on-resolved: true
To get your ClickUp API token follow: Generate or regenerate a Personal API Token
To find your List ID:
https://app.clickup.com/{workspace_id}/v/l/li/{list_id}To find Assignee IDs:
https://app.clickup.com/{workspace_id}/teams-pulse/teams/peopleCopy member ID⚠️ WARNING: This alerting provider has not been tested yet. If you've tested it and confirmed that it works, please remove this warning and create a pull request, or comment on #1223 with whether the provider works as intended. Thank you for your cooperation.
| Parameter | Description | Default |
|---|---|---|
alerting.datadog |
Configuration for alerts of type datadog |
{} |
alerting.datadog.api-key |
Datadog API key | Required "" |
alerting.datadog.site |
Datadog site (e.g., datadoghq.com, datadoghq.eu) | "datadoghq.com" |
alerting.datadog.tags |
Additional tags to include | [] |
alerting.datadog.default-alert |
Default alert configuration. See Setting a default alert |
N/A |
alerting.datadog.overrides |
List of overrides that may be prioritized over the default configuration | [] |
alerting.datadog.overrides[].group |
Endpoint group for which the configuration will be overridden by this configuration | "" |
alerting.datadog.overrides[].* |
See alerting.datadog.* parameters |
{} |
alerting:
  datadog:
    api-key: "YOUR_API_KEY"
    site: "datadoghq.com"  # or datadoghq.eu for EU region
    tags:
      - "environment:production"
      - "team:platform"

endpoints:
  - name: website
    url: "https://twin.sh/health"
    interval: 5m
    conditions:
      - "[STATUS] == 200"
    alerts:
      - type: datadog
        send-on-resolved: true
| Parameter | Description | Default |
|---|---|---|
alerting.discord |
Configuration for alerts of type discord |
{} |
alerting.discord.webhook-url |
Discord Webhook URL | Required "" |
alerting.discord.title |
Title of the notification | ":helmet_with_white_cross: Gatus" |
alerting.discord.message-content |
Message content to send before the embed (useful for pinging users/roles, e.g. <@123>) |
"" |
alerting.discord.default-alert |
Default alert configuration. See Setting a default alert |
N/A |
alerting.discord.overrides |
List of overrides that may be prioritized over the default configuration | [] |
alerting.discord.overrides[].group |
Endpoint group for which the configuration will be overridden by this configuration | "" |
alerting.discord.overrides[].* |
See alerting.discord.* parameters |
{} |
alerting:
  discord:
    webhook-url: "https://discord.com/api/webhooks/**********/**********"

endpoints:
  - name: website
    url: "https://twin.sh/health"
    interval: 5m
    conditions:
      - "[STATUS] == 200"
      - "[BODY].status == UP"
      - "[RESPONSE_TIME] < 300"
    alerts:
      - type: discord
        description: "healthcheck failed"
        send-on-resolved: true
| Parameter | Description | Default |
|---|---|---|
alerting.email |
Configuration for alerts of type email |
{} |
alerting.email.from |
Email used to send the alert | Required "" |
alerting.email.username |
Username of the SMTP server used to send the alert. If empty, uses alerting.email.from. |
"" |
alerting.email.password |
Password of the SMTP server used to send the alert. If empty, no authentication is performed. | "" |
alerting.email.host |
Host of the mail server (e.g. smtp.gmail.com) |
Required "" |
alerting.email.port |
Port the mail server is listening to (e.g. 587) |
Required 0 |
alerting.email.to |
Email(s) to send the alerts to | Required "" |
alerting.email.default-alert |
Default alert configuration. See Setting a default alert |
N/A |
alerting.email.client.insecure |
Whether to skip TLS verification | false |
alerting.email.overrides |
List of overrides that may be prioritized over the default configuration | [] |
alerting.email.overrides[].group |
Endpoint group for which the configuration will be overridden by this configuration | "" |
alerting.email.overrides[].* |
See alerting.email.* parameters |
{} |
alerting:
  email:
    from: "from@example.com"
    username: "from@example.com"
    password: "hunter2"
    host: "mail.example.com"
    port: 587
    to: "recipient1@example.com,recipient2@example.com"
    client:
      insecure: false
    # You can also add group-specific to keys, which will
    # override the to key above for the specified groups
    overrides:
      - group: "core"
        to: "recipient3@example.com,recipient4@example.com"

endpoints:
  - name: website
    url: "https://twin.sh/health"
    interval: 5m
    conditions:
      - "[STATUS] == 200"
      - "[BODY].status == UP"
      - "[RESPONSE_TIME] < 300"
    alerts:
      - type: email
        description: "healthcheck failed"
        send-on-resolved: true

  - name: back-end
    group: core
    url: "https://example.org/"
    interval: 5m
    conditions:
      - "[STATUS] == 200"
      - "[CERTIFICATE_EXPIRATION] > 48h"
    alerts:
      - type: email
        description: "healthcheck failed"
        send-on-resolved: true
⚠ Some mail servers are painfully slow.
| Parameter | Description | Default |
|---|---|---|
alerting.gitea |
Configuration for alerts of type gitea |
{} |
alerting.gitea.repository-url |
Gitea repository URL (e.g. https://gitea.com/TwiN/example) |
Required "" |
alerting.gitea.token |
Personal access token to use for authentication. Must have at least RW on issues and RO on metadata. |
Required "" |
alerting.gitea.default-alert |
Default alert configuration. See Setting a default alert. |
N/A |
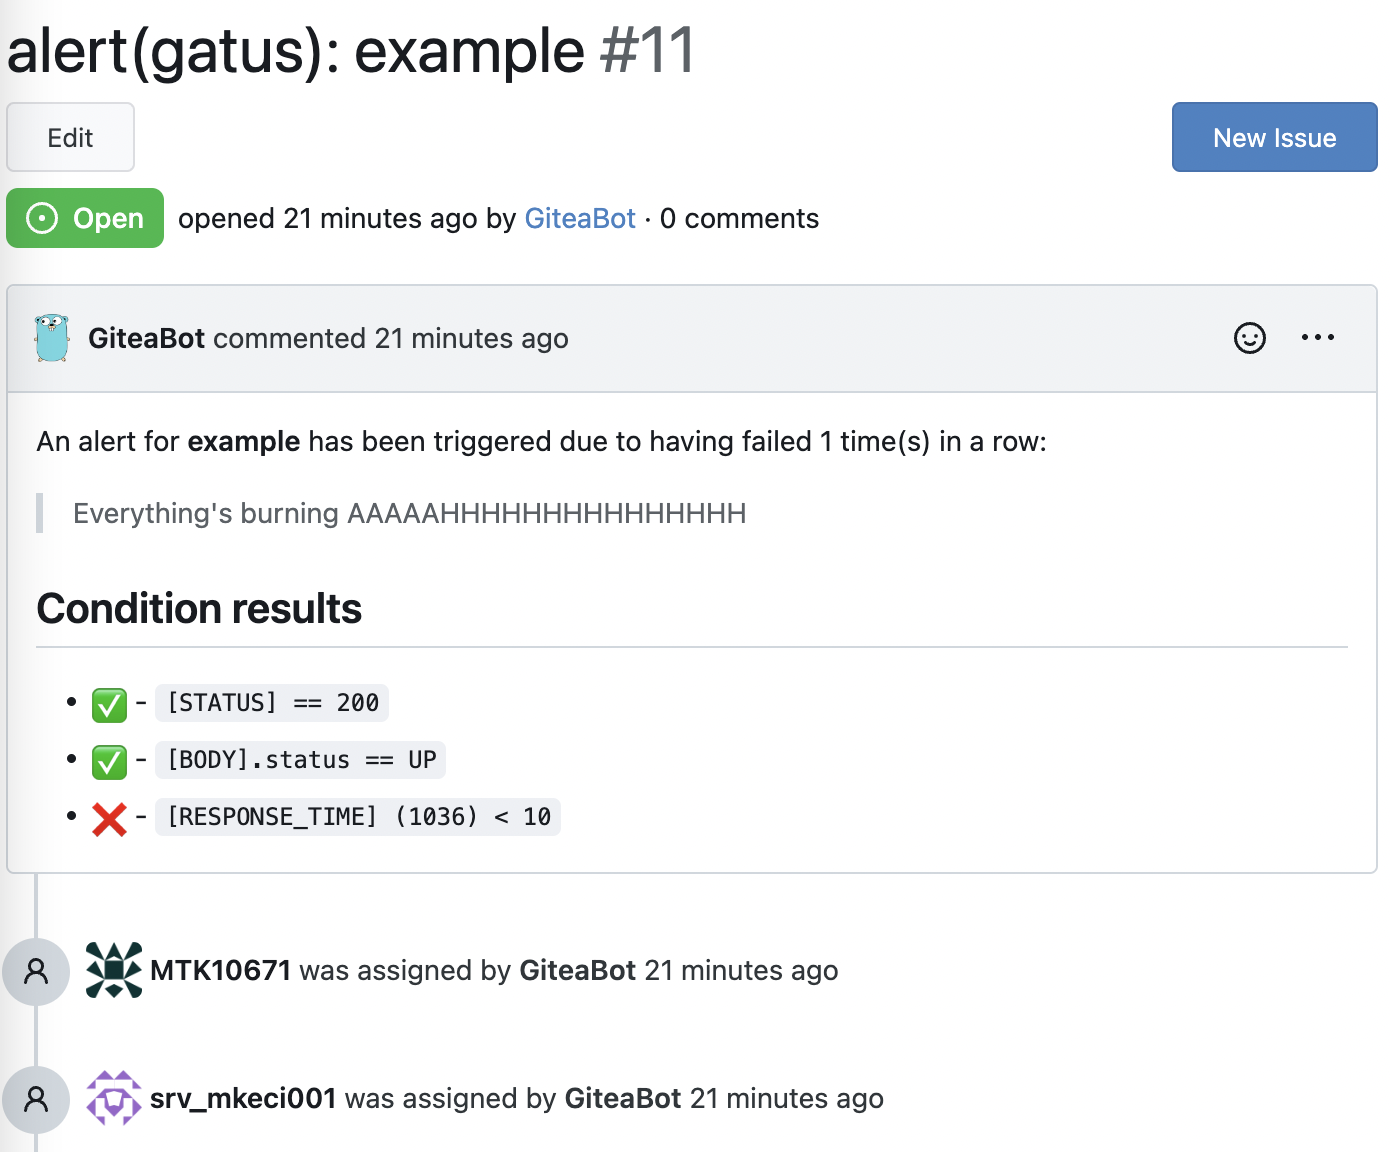
The Gitea alerting provider creates an issue prefixed with alert(gatus): and suffixed with the endpoint's display
name for each alert. If send-on-resolved is set to true on the endpoint alert, the issue will be automatically
closed when the alert is resolved.
alerting:
  gitea:
    repository-url: "https://gitea.com/TwiN/test"
    token: "349d63f16......"

endpoints:
  - name: example
    url: "https://twin.sh/health"
    interval: 5m
    conditions:
      - "[STATUS] == 200"
      - "[BODY].status == UP"
      - "[RESPONSE_TIME] < 75"
    alerts:
      - type: gitea
        failure-threshold: 2
        success-threshold: 3
        send-on-resolved: true
        description: "Everything's burning AAAAAHHHHHHHHHHHHHHH"
| Parameter | Description | Default |
|---|---|---|
alerting.github |
Configuration for alerts of type github |
{} |
alerting.github.repository-url |
GitHub repository URL (e.g. https://github.com/TwiN/example) |
Required "" |
alerting.github.token |
Personal access token to use for authentication. Must have at least RW on issues and RO on metadata. |
Required "" |
alerting.github.default-alert |
Default alert configuration. See Setting a default alert. |
N/A |
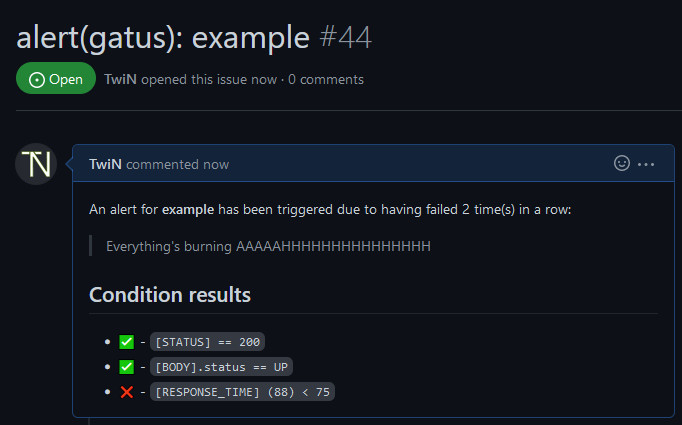
The GitHub alerting provider creates an issue prefixed with alert(gatus): and suffixed with the endpoint's display
name for each alert. If send-on-resolved is set to true on the endpoint alert, the issue will be automatically
closed when the alert is resolved.
alerting:
  github:
    repository-url: "https://github.com/TwiN/test"
    token: "github_pat_12345..."

endpoints:
  - name: example
    url: "https://twin.sh/health"
    interval: 5m
    conditions:
      - "[STATUS] == 200"
      - "[BODY].status == UP"
      - "[RESPONSE_TIME] < 75"
    alerts:
      - type: github
        failure-threshold: 2
        success-threshold: 3
        send-on-resolved: true
        description: "Everything's burning AAAAAHHHHHHHHHHHHHHH"
| Parameter | Description | Default |
|---|---|---|
alerting.gitlab |
Configuration for alerts of type gitlab |
{} |
alerting.gitlab.webhook-url |
GitLab alert webhook URL (e.g. https://gitlab.com/yourusername/example/alerts/notify/gatus/xxxxxxxxxxxxxxxx.json) |
Required "" |
alerting.gitlab.authorization-key |
GitLab alert authorization key. | Required "" |
alerting.gitlab.severity |
Override default severity (critical), can be one of critical, high, medium, low, info, unknown |
"" |
alerting.gitlab.monitoring-tool |
Override the monitoring tool name (gatus) | "gatus" |
alerting.gitlab.environment-name |
Set gitlab environment's name. Required to display alerts on a dashboard. | "" |
alerting.gitlab.service |
Override endpoint display name | "" |
alerting.gitlab.default-alert |
Default alert configuration. See Setting a default alert. |
N/A |
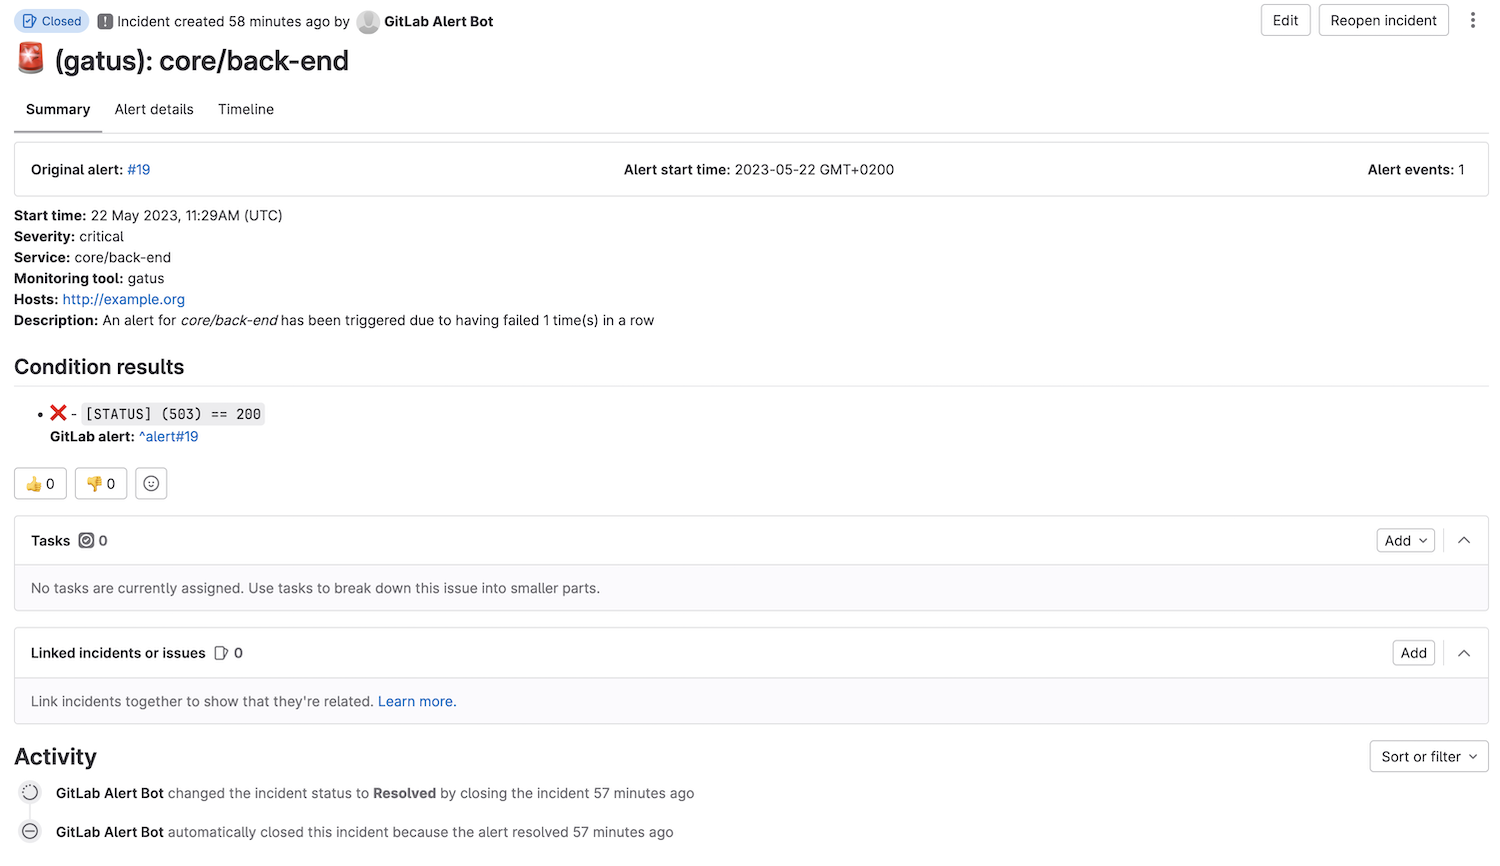
The GitLab alerting provider creates an alert prefixed with alert(gatus): and suffixed with the endpoint's display
name for each alert. If send-on-resolved is set to true on the endpoint alert, the alert will be automatically
closed when the alert is resolved. See
https://docs.gitlab.com/ee/operations/incident_management/integrations.html#configuration to configure the endpoint.
alerting:
  gitlab:
    webhook-url: "https://gitlab.com/hlidotbe/example/alerts/notify/gatus/xxxxxxxxxxxxxxxx.json"
    authorization-key: "12345"

endpoints:
  - name: example
    url: "https://twin.sh/health"
    interval: 5m
    conditions:
      - "[STATUS] == 200"
      - "[BODY].status == UP"
      - "[RESPONSE_TIME] < 75"
    alerts:
      - type: gitlab
        failure-threshold: 2
        success-threshold: 3
        send-on-resolved: true
        description: "Everything's burning AAAAAHHHHHHHHHHHHHHH"
| Parameter | Description | Default |
|---|---|---|
alerting.googlechat |
Configuration for alerts of type googlechat |
{} |
alerting.googlechat.webhook-url |
Google Chat Webhook URL | Required "" |
alerting.googlechat.client |
Client configuration. See Client configuration. |
{} |
alerting.googlechat.default-alert |
Default alert configuration. See Setting a default alert. |
N/A |
alerting.googlechat.overrides |
List of overrides that may be prioritized over the default configuration | [] |
alerting.googlechat.overrides[].group |
Endpoint group for which the configuration will be overridden by this configuration | "" |
alerting.googlechat.overrides[].* |
See alerting.googlechat.* parameters |
{} |
alerting:
  googlechat:
    webhook-url: "https://chat.googleapis.com/v1/spaces/*******/messages?key=**********&token=********"

endpoints:
  - name: website
    url: "https://twin.sh/health"
    interval: 5m
    conditions:
      - "[STATUS] == 200"
      - "[BODY].status == UP"
      - "[RESPONSE_TIME] < 300"
    alerts:
      - type: googlechat
        description: "healthcheck failed"
        send-on-resolved: true
| Parameter | Description | Default |
|---|---|---|
alerting.gotify |
Configuration for alerts of type gotify |
{} |
alerting.gotify.server-url |
Gotify server URL | Required "" |
alerting.gotify.token |
Token that is used for authentication. | Required "" |
alerting.gotify.priority |
Priority of the alert according to Gotify standards. | 5 |
alerting.gotify.title |
Title of the notification | "Gatus: <endpoint>" |
alerting.gotify.default-alert |
Default alert configuration. See Setting a default alert. |
N/A |
alerting:
  gotify:
    server-url: "https://gotify.example"
    token: "**************"

endpoints:
  - name: website
    url: "https://twin.sh/health"
    interval: 5m
    conditions:
      - "[STATUS] == 200"
      - "[BODY].status == UP"
      - "[RESPONSE_TIME] < 300"
    alerts:
      - type: gotify
        description: "healthcheck failed"
        send-on-resolved: true
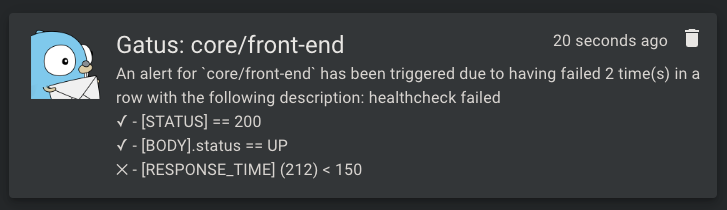
Here's an example of what the notifications look like:
| Parameter | Description | Default Value |
|---|---|---|
alerting.homeassistant.url |
HomeAssistant instance URL | Required "" |
alerting.homeassistant.token |
Long-lived access token from HomeAssistant | Required "" |
alerting.homeassistant.default-alert |
Default alert configuration to use for endpoints with an alert of the appropriate type | {} |
alerting.homeassistant.overrides |
List of overrides that may be prioritized over the default configuration | [] |
alerting.homeassistant.overrides[].group |
Endpoint group for which the configuration will be overridden by this configuration | "" |
alerting.homeassistant.overrides[].* |
See alerting.homeassistant.* parameters |
{} |
alerting:
  homeassistant:
    url: "http://homeassistant:8123"  # URL of your HomeAssistant instance
    token: "YOUR_LONG_LIVED_ACCESS_TOKEN"  # Long-lived access token from HomeAssistant

endpoints:
  - name: my-service
    url: "https://my-service.com"
    interval: 5m
    conditions:
      - "[STATUS] == 200"
    alerts:
      - type: homeassistant
        enabled: true
        send-on-resolved: true
        description: "My service health check"
        failure-threshold: 3
        success-threshold: 2
The alerts will be sent as events to HomeAssistant with the event type gatus_alert. The event data includes:
status: "triggered" or "resolved"endpoint: The name of the monitored endpointdescription: The alert description if providedconditions: List of conditions and their resultsfailure_count: Number of consecutive failures (when triggered)success_count: Number of consecutive successes (when resolved)You can use these events in HomeAssistant automations to:
Example HomeAssistant automation:
automation:
  - alias: "Gatus Alert Handler"
    trigger:
      platform: event
      event_type: gatus_alert
    action:
      - service: notify.notify
        data_template:
          title: "Gatus Alert: {{ trigger.event.data.event_data.endpoint }}"
          message: >
            Status: {{ trigger.event.data.event_data.status }}
            {% if trigger.event.data.event_data.description %}
            Description: {{ trigger.event.data.event_data.description }}
            {% endif %}
            {% for condition in trigger.event.data.event_data.conditions %}
            {{ '✅' if condition.success else '❌' }} {{ condition.condition }}
            {% endfor %}
To get your HomeAssistant long-lived access token:
⚠️ WARNING: This alerting provider has not been tested yet. If you've tested it and confirmed that it works, please remove this warning and create a pull request, or comment on #1223 with whether the provider works as intended. Thank you for your cooperation.
| Parameter | Description | Default |
|---|---|---|
alerting.ifttt |
Configuration for alerts of type ifttt |
{} |
alerting.ifttt.webhook-key |
IFTTT Webhook key | Required "" |
alerting.ifttt.event-name |
IFTTT event name | Required "" |
alerting.ifttt.default-alert |
Default alert configuration. See Setting a default alert |
N/A |
alerting.ifttt.overrides |
List of overrides that may be prioritized over the default configuration | [] |
alerting.ifttt.overrides[].group |
Endpoint group for which the configuration will be overridden by this configuration | "" |
alerting.ifttt.overrides[].* |
See alerting.ifttt.* parameters |
{} |
alerting:
  ifttt:
    webhook-key: "YOUR_WEBHOOK_KEY"
    event-name: "gatus_alert"

endpoints:
  - name: website
    url: "https://twin.sh/health"
    interval: 5m
    conditions:
      - "[STATUS] == 200"
    alerts:
      - type: ifttt
        send-on-resolved: true
| Parameter | Description | Default |
|---|---|---|
alerting.ilert |
Configuration for alerts of type ilert |
{} |
alerting.ilert.integration-key |
ilert Alert Source integration key | "" |
alerting.ilert.default-alert |
Default alert configuration. See Setting a default alert |
N/A |
alerting.ilert.overrides |
List of overrides that may be prioritized over the default configuration | [] |
alerting.ilert.overrides[].group |
Endpoint group for which the configuration will be overridden by this configuration | "" |
alerting.ilert.overrides[].* |
See alerting.ilert.* parameters |
{} |
It is highly recommended to set endpoints[].alerts[].send-on-resolved to true for alerts
of type ilert, because unlike other alerts, the operation resulting from setting said
parameter to true will not create another alert but mark the alert as resolved on
ilert instead.
Behavior:
alerting.ilert.integration-key is used as the integration keyendpoints[].group) matching the value of alerting.ilert.overrides[].group, the provider will use that override's integration key instead of alerting.ilert.integration-key'salerting:
ilert:
integration-key: "********************************"
# You can also add group-specific integration keys, which will
# override the integration key above for the specified groups
overrides:
- group: "core"
integration-key: "********************************"
endpoints:
- name: website
url: "https://twin.sh/health"
interval: 30s
conditions:
- "[STATUS] == 200"
- "[BODY].status == UP"
- "[RESPONSE_TIME] < 300"
alerts:
- type: ilert
failure-threshold: 3
success-threshold: 5
send-on-resolved: true
description: "healthcheck failed"<more like this
Comprehensive analytics dashboard for AI coding agents — Cursor, Windsurf, Claude Code, VS Code Copilot, Zed, Antigravi…
search projects, people, and tags