dont-track-me-google
Firefox and Chrome extensions to prevent Google from making links ugly.
JavaScript★ 587
Ripl provides a unified, cross-platform API for 2D and 3D graphics rendering with a focus on high performance and inter…
 andrewcourtice
Ripl (pronounced "ripple") is a library that provides a unified API for 2D graphics rendering (Canvas & SVG) in the browser, with a focus on high performance and interactive data visualization. It also includes a 3D rendering package.
Working with the canvas API can be notoriously difficult as it is designed to be very low-level. Alternatively, working with SVG is rather straightforward but not without its flaws. Because these paradigms differ widely in their implementations developers often have to choose one or the other at the outset of a project. Ripl alleviates the issue by exposing a unified API and mimicking the DOM/CSSOM in as many ways as possible to make it simple for developers to interact with. Switching between Canvas and SVG is as simple as changing one line of code.
Spline Polyline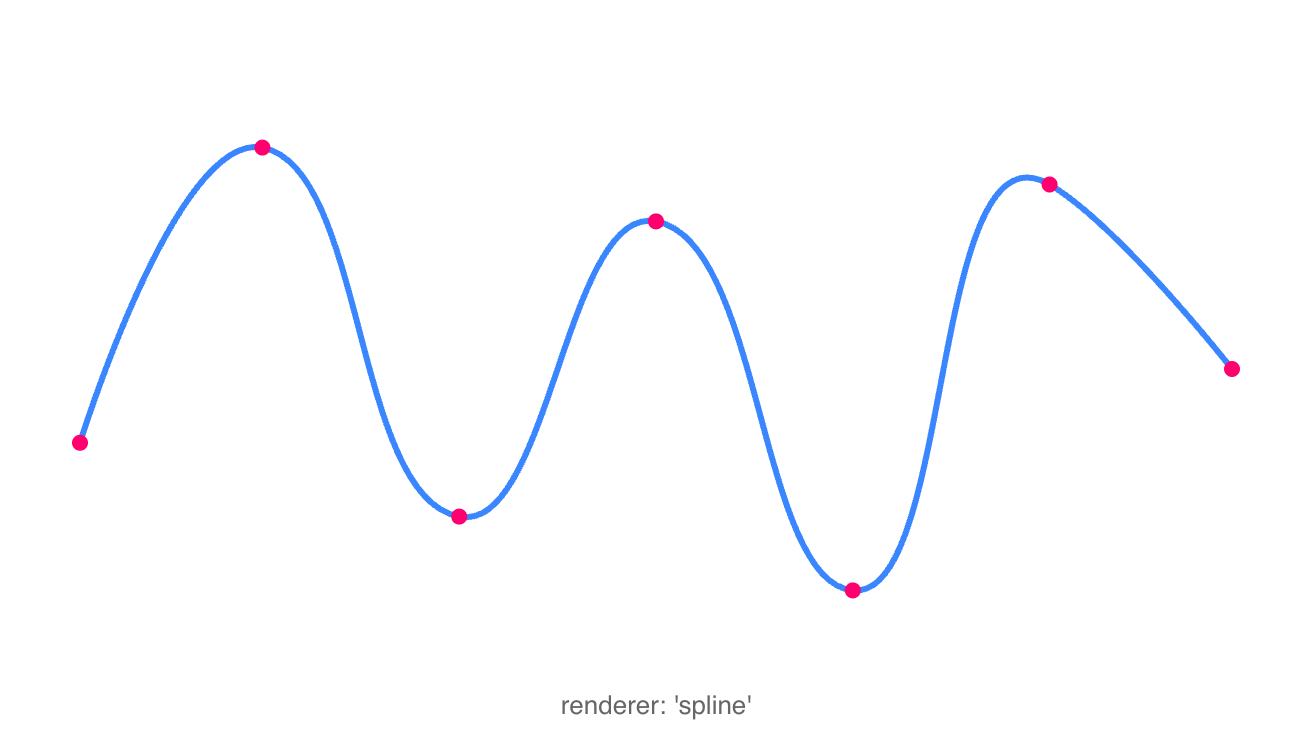 |
3D Sphere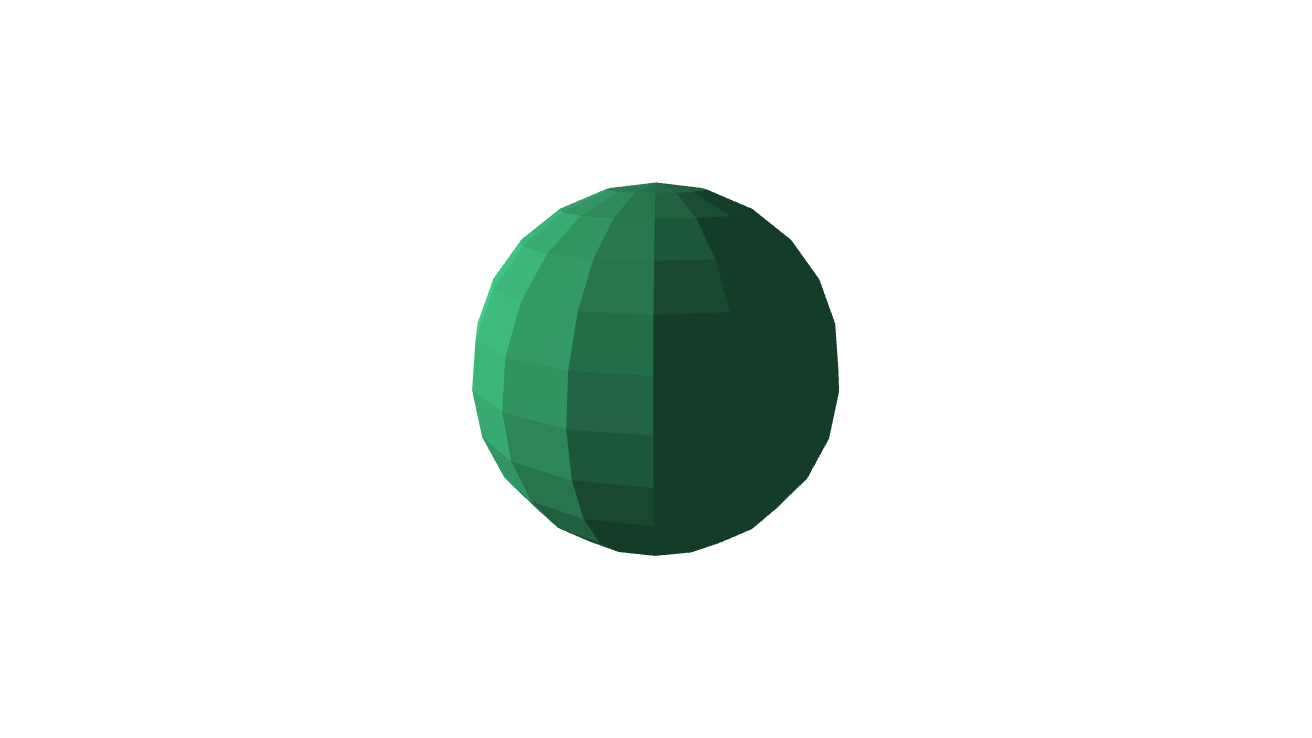 |
Multi-Line Graph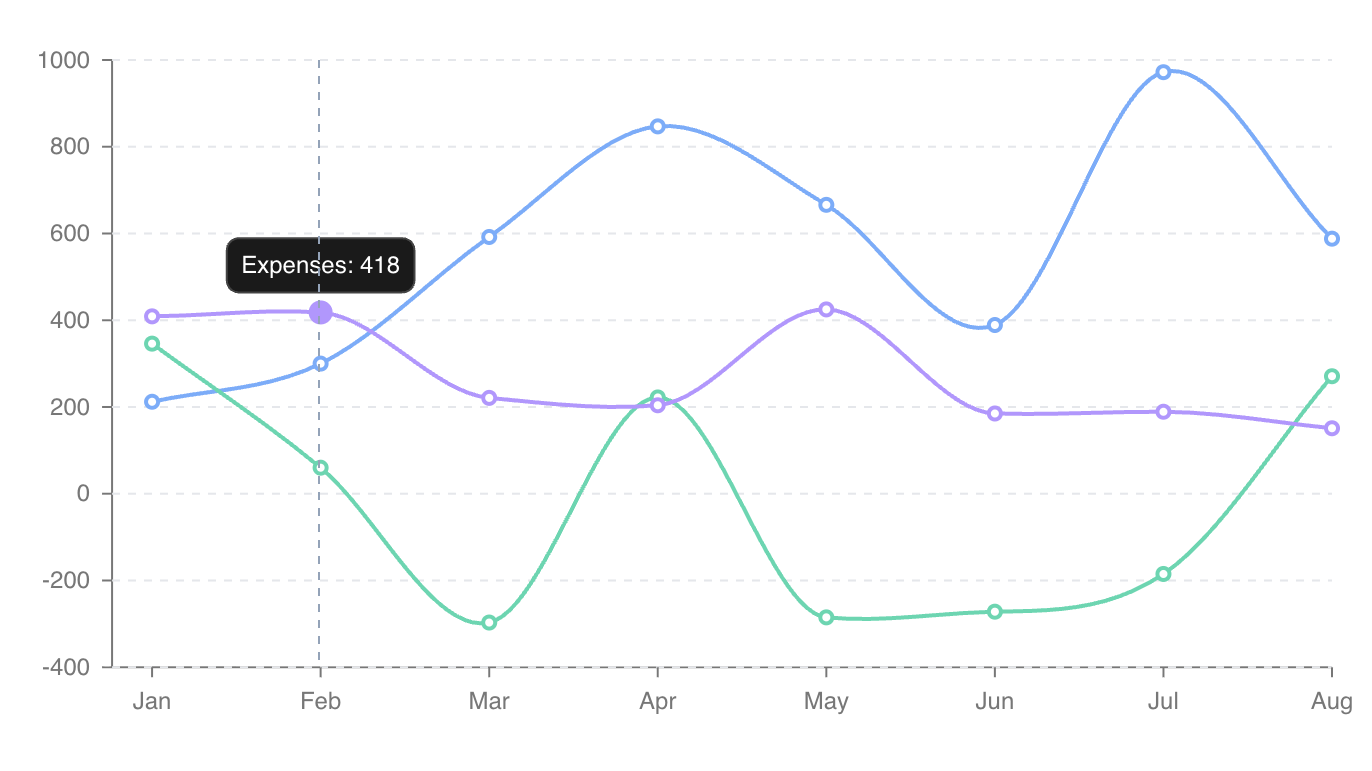 |
Bubble Scatter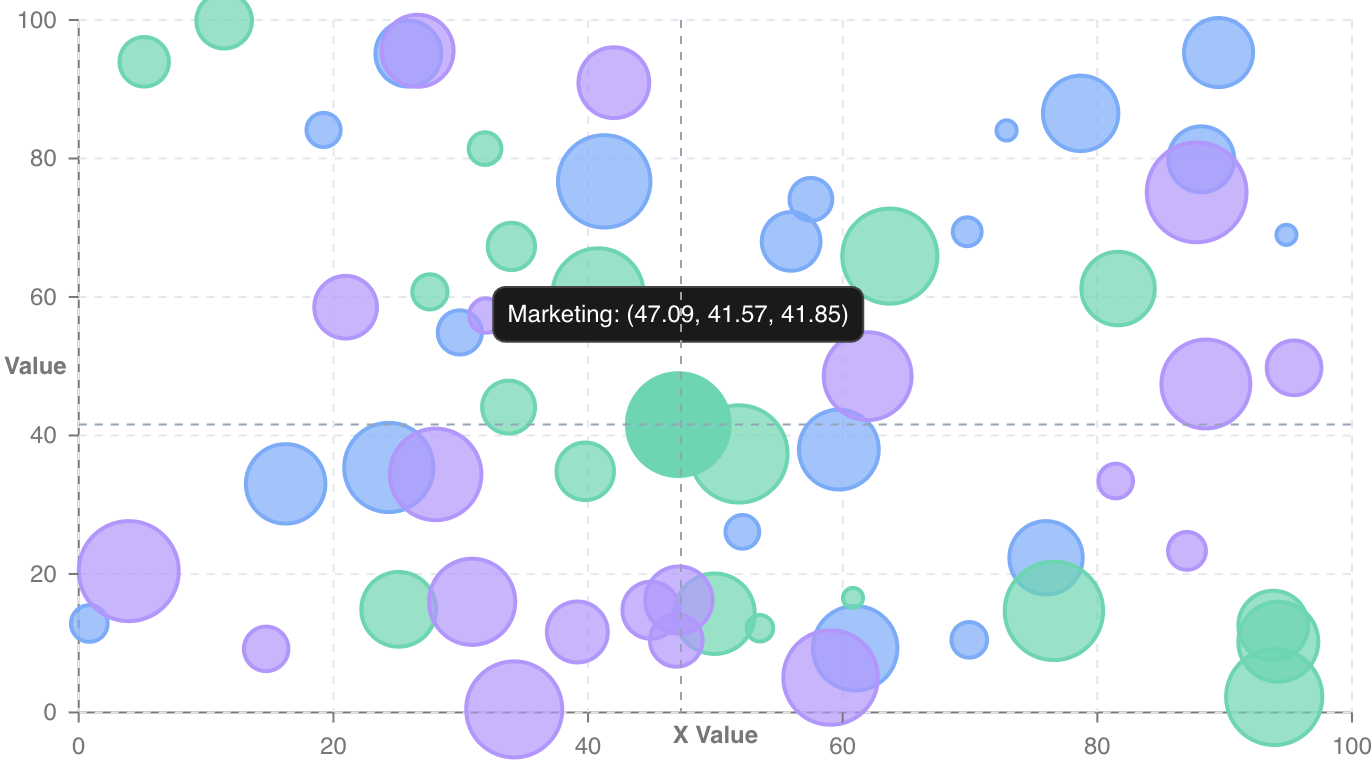 |
Candlestick Chart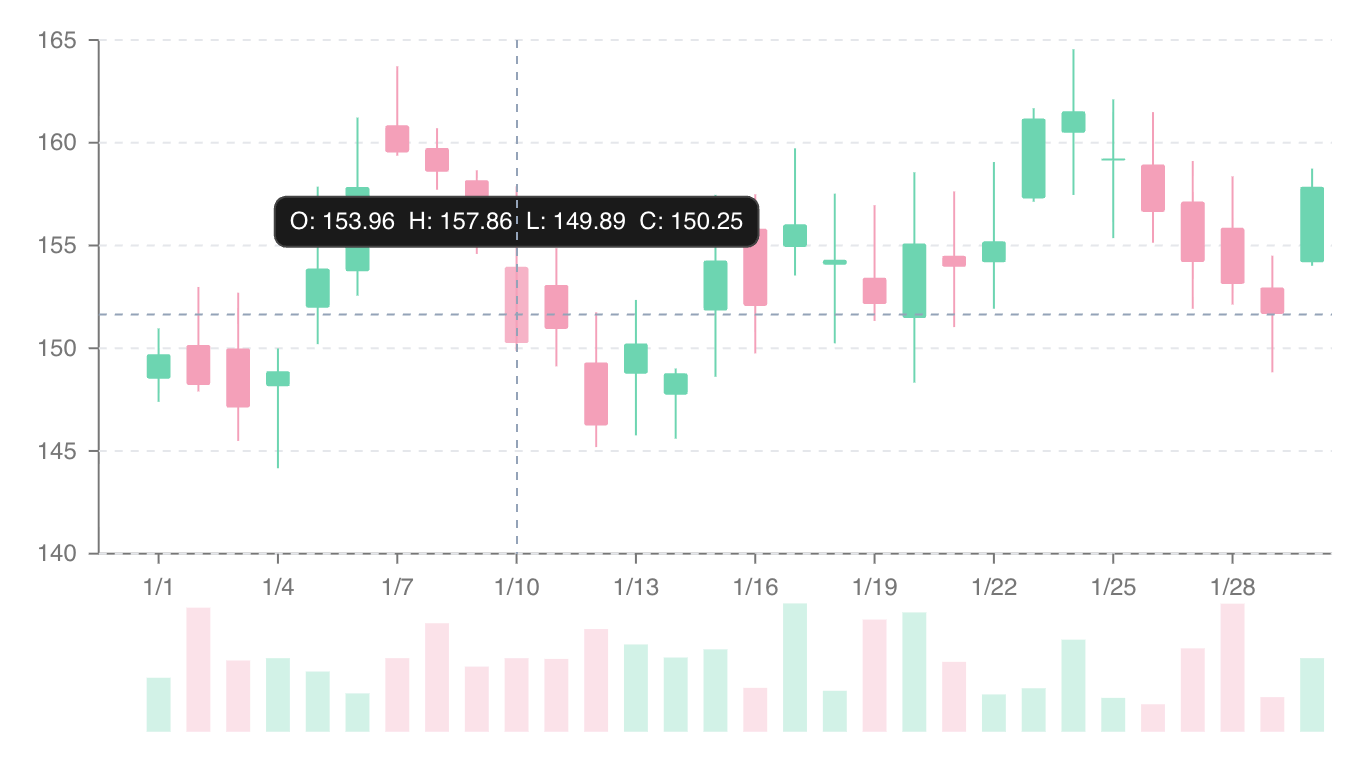 |
Jet Engine Model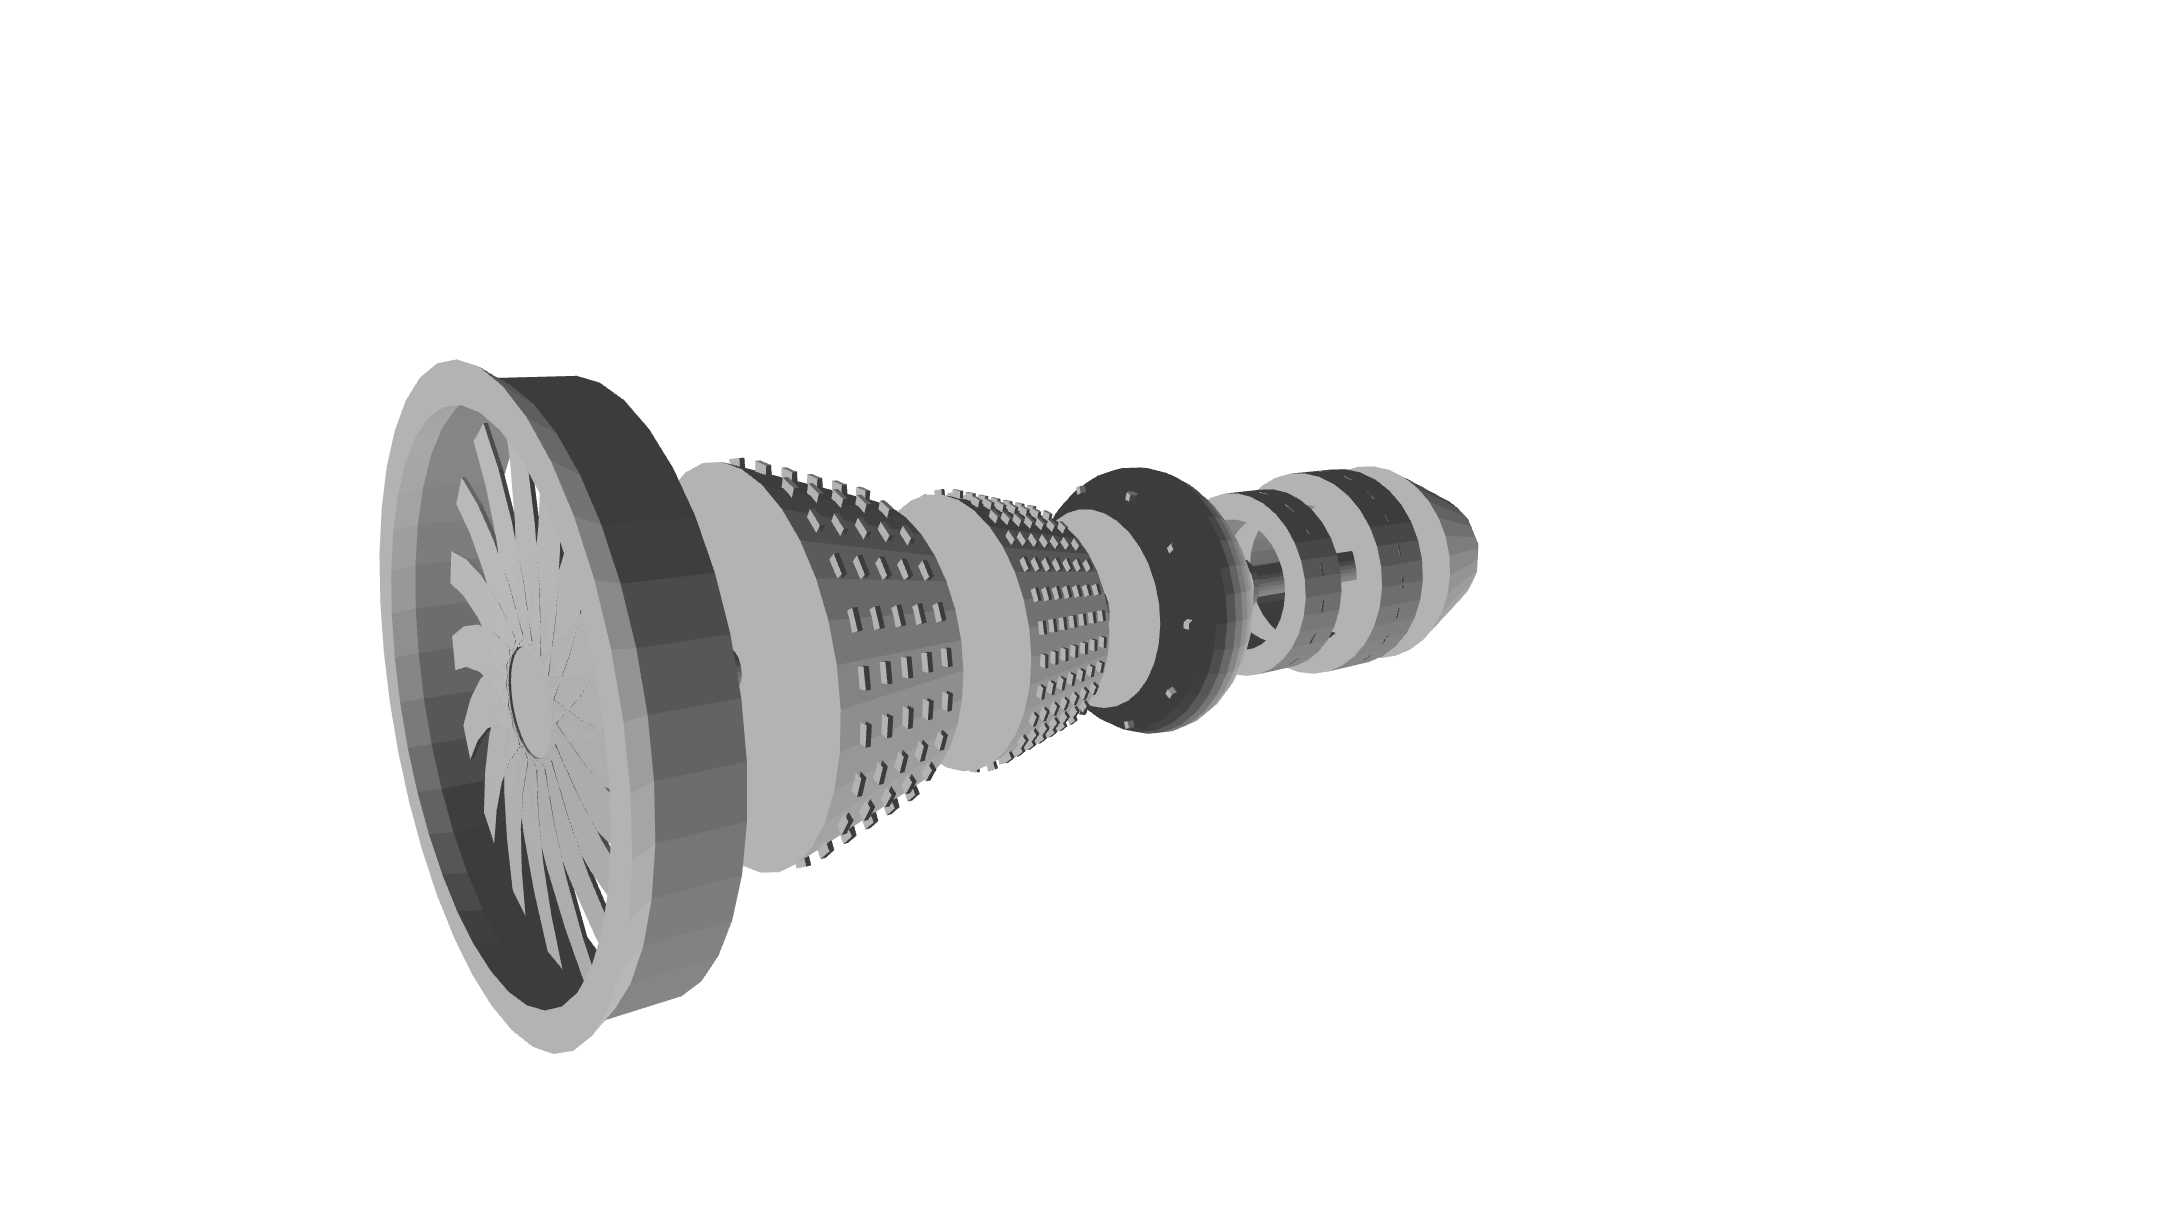 |
requestAnimationFrame loopgetElementById, getElementsByType, getElementsByClass, plus query/queryAll with selector syntaxgetBoundingBox on all shape elementsImageData), an object URL, or a string (PNG data URL / SVG markup / terminal text)Shape2Dpattern(...) paint strings (diagonal, cross-hatch, dots, horizontal, vertical) in fills and strokesTask-based transitions with CSS-like keyframe support and custom interpolatorsscaleLog/scaleSqrt shortcuts@ripl/charts@ripl/devtools) with a companion browser extension for live scene-graph inspection and editing| Package | Description |
|---|---|
@ripl/web |
Main entry point for browser usage. Re-exports core + canvas context with browser platform bindings |
@ripl/core |
Core rendering: elements, scene, renderer, animation, scales, math, color, interpolation, gradients, tasks |
@ripl/canvas |
Canvas 2D rendering context |
@ripl/svg |
SVG rendering context |
@ripl/charts |
Pre-built chart components with axes, legends, tooltips, crosshairs, and grids |
@ripl/3d |
3D rendering context with camera, shading, and primitive shapes |
@ripl/webgpu |
WebGPU-accelerated 3D rendering context with hardware depth testing and WGSL shaders |
@ripl/terminal |
Terminal rendering context with braille-character output and ANSI truecolor |
@ripl/node |
Node.js runtime bindings that configure the platform factory for headless environments |
@ripl/devtools |
Page-side devtools bridge that streams the scene graph to the browser extension for live inspection |
@ripl/dom |
DOM utilities used internally by browser contexts |
@ripl/utilities |
Shared typed utility functions: type guards, collection helpers, DOM helpers |
The project is structured as a Yarn 4 monorepo:
packages/
├── core/         # Core rendering library
├── canvas/       # Canvas 2D rendering context
├── svg/          # SVG context implementation
├── charts/       # Pre-built chart components
├── 3d/           # 3D rendering
├── webgpu/       # WebGPU 3D rendering context
├── terminal/     # Terminal rendering context
├── node/         # Node.js runtime bindings
├── web/          # Main browser entry point
├── devtools/     # Page-side devtools bridge
├── dom/          # DOM utilities
├── utilities/    # Shared typed utility functions
└── test-utils/   # Test utilities
apps/website/     # Documentation site (VitePress) with live demos
The following is a tour of Ripl's features starting from the most basic and progressively building towards more advanced concepts.
import {
    createCircle,
    createContext,
} from '@ripl/web';

// Create a canvas context bound to a DOM element
const context = createContext('.mount-element');

// Create an element
const circle = createCircle({
    fill: 'rgb(30, 105, 120)',
    lineWidth: 4,
    cx: context.width / 2,
    cy: context.height / 2,
    radius: context.width / 3,
});

// Render the element to the context
circle.render(context);
Built-in 2D shape primitives: arc, circle, rect, line, polyline, polygon, ellipse, text, path, image.
To modify an element simply change any of its properties and re-render it.
circle.fill = '#FF0000';
circle.cx = context.width / 3;
circle.cy = context.height / 3;
circle.render(context);
To render the same element to SVG, replace the createContext import from @ripl/web with @ripl/svg:
import {
    createContext,
} from '@ripl/svg';

import {
    createCircle,
} from '@ripl/web';

const context = createContext('.mount-element');
const circle = createCircle({ /* same options */ });
circle.render(context);
Render multiple elements in groups with inherited properties (like CSS) and event bubbling (like the DOM):
import {
    createCircle,
    createContext,
    createGroup,
    createRect,
} from '@ripl/web';

const context = createContext('.mount-element');

const circle = createCircle({
    cx: context.width / 2,
    cy: context.height / 2,
    radius: context.width / 3,
});

const rect = createRect({
    x: context.width / 2,
    y: context.height / 2,
    width: context.width / 5,
    height: context.height / 5,
});

// Both children inherit fill and lineWidth from the group
const group = createGroup({
    fill: 'rgb(30, 105, 120)',
    lineWidth: 4,
    children: [circle, rect],
});

group.render(context);
Elements can be queried using common DOM methods or CSS-like selectors:
const circles = parentGroup.getElementsByType('circle');
const shapes = parentGroup.queryAll('.shape');
const first = parentGroup.query('#child-group > .shape');
Supported selector features:
circle                                   /* type */
#element-id                              /* id */
.element-class                           /* class */
circle[radius="5"]                       /* attribute */
.group-class circle                      /* descendant */
.group-class > circle                    /* direct child */
.group-class rect + circle.circle-class  /* adjacent sibling */
A Scene is the top-level group bound to a rendering context. A Renderer drives the animation loop via requestAnimationFrame.
import {
    createCircle,
    createGroup,
    createRect,
    createRenderer,
    createScene,
} from '@ripl/web';

const circle = createCircle({
    fill: 'rgb(30, 105, 120)',
    cx: 100,
    cy: 100,
    radius: 40,
});

const rect = createRect({
    fill: 'rgb(30, 105, 120)',
    x: 200,
    y: 80,
    width: 60,
    height: 60,
});

// Scene takes a target (selector, element, or context) and options
const scene = createScene('.mount-element', {
    children: [circle, rect],
});

const renderer = createRenderer(scene, {
    autoStart: true,
    autoStop: true,
});

// Listen for events
circle.on('click', event => console.log(event));
The renderer provides transition-based animation. Transitions are cancelable Task instances (extending Promise with AbortController integration).
import {
    easeOutCubic,
} from '@ripl/web';

// Animate a single element
await renderer.transition(circle, {
    duration: 1000,
    ease: easeOutCubic,
    state: {
        fill: '#FF0000',
        cx: 200,
        cy: 200,
        radius: 60,
    },
});

// Animate multiple elements (or a whole group/scene)
await renderer.transition([circle, rect], {
    duration: 1000,
    ease: easeOutCubic,
    state: {
        fill: '#FF0000',
    },
});
// Implicit keyframe offsets
await renderer.transition(circle, {
    duration: 1000,
    ease: easeOutCubic,
    state: {
        fill: [
            '#FF0000', // offset ~0.33
            '#00FF00', // offset ~0.66
            '#0000FF', // offset 1
        ],
    },
});

// Explicit keyframe offsets
await renderer.transition(circle, {
    duration: 1000,
    ease: easeOutCubic,
    state: {
        fill: [
            {
                value: '#FF0000',
                offset: 0.25,
            },
            {
                value: '#0000FF',
                offset: 0.8,
            },
        ],
    },
});

// Custom interpolator function
await renderer.transition(circle, {
    duration: 1000,
    ease: easeOutCubic,
    state: {
        radius: t => t * 100, // 0 <= t <= 1
    },
});
Every element supports CSS-like transforms:
const rect = createRect({
    x: 100,
    y: 100,
    width: 80,
    height: 80,
    rotation: '45deg', // or radians as a number
    transformOriginX: '50%', // or pixels as a number
    transformOriginY: '50%',
    translateX: 20,
    translateY: 10,
    transformScaleX: 1.5,
    transformScaleY: 1.5,
});
Transforms can also be animated via renderer.transition.
Every context can capture a snapshot of what it has rendered and export it to an image, URL, or string via export():
const snapshot = context.export();

const str = snapshot.toString(); // PNG data URL (SVG → markup, Terminal → braille text)
const url = snapshot.toURL(); // openable Blob object URL
const image = await snapshot.toImage(); // low-level ImageData (environment-agnostic)
The exact outputs depend on the context: Canvas, 3D, and WebGPU export raster images; SVG exports vector markup (and can rasterize to an image); Terminal exports braille text (and a rasterized image). Charts forward export() to their underlying context:
const chart = createBarChart('.mount-element', options);

// e.g. open the rendered chart in a new tab
window.open(chart.export().toURL(), '_blank');
@ripl/charts provides 25 ready-to-use, animated chart types. Each chart supports tooltips, legends, crosshairs, grids, axes, and data update animations out of the box.
| Chart | Factory |
|---|---|
| Arc Diagram | createArcDiagramChart |
| Area | createAreaChart |
| Bar | createBarChart |
| Box Plot | createBoxPlotChart |
| Chord | createChordChart |
| Force-Directed | createForceDirectedChart |
| Funnel | createFunnelChart |
| Gantt | createGanttChart |
| Gauge | createGaugeChart |
| Heatmap | createHeatmapChart |
| Histogram | createHistogramChart |
| Line | createLineChart |
| Packed Circle | createPackedCircleChart |
| Pie / Donut | createPieChart |
| Polar Area | createPolarAreaChart |
| Polar Scatter | createPolarScatterChart |
| Radar | createRadarChart |
| Radial Bar | createRadialBarChart |
| Realtime | createRealtimeChart |
| Sankey | createSankeyChart |
| Scatter | createScatterChart |
| Stock (OHLC) | createStockChart |
| Sunburst | createSunburstChart |
| Treemap | createTreemapChart |
| Trend (Bar + Line) | createTrendChart |
Charts are constructed by passing a target element and an options object:
import {
    createBarChart,
} from '@ripl/charts';

const chart = createBarChart('.mount-element', {
    data: [
        {
            category: 'A',
            value: 30,
        },
        {
            category: 'B',
            value: 70,
        },
        {
            category: 'C',
            value: 45,
        },
    ],
    key: 'category',
    series: [
        {
            id: 'values',
            label: 'Values',
            value: 'value',
        },
    ],
});

// Update with new data
chart.update({
    data: [
        {
            category: 'A',
            value: 50,
        },
        {
            category: 'B',
            value: 20,
        },
        {
            category: 'C',
            value: 80,
        },
    ],
});
Reusable chart components: ChartXAxis, ChartYAxis, Grid, Legend, ColorLegend, Tooltip, Crosshair, and ChartAnnotations (reference lines, bands, and point markers).
Ripl provides 14 scale types for mapping data between domains and ranges, inspired by D3. Scales expose inverse, ticks, and includes methods (the categorical scaleOrdinal maps value → value and exposes just its domain and range).
import {
    scaleBand,
    scaleContinuous,
    scaleDiscrete,
    scaleDiverging,
    scaleLogarithmic,
    scaleOrdinal,
    scalePoint,
    scalePower,
    scaleQuantile,
    scaleQuantize,
    scaleRadial,
    scaleSymlog,
    scaleThreshold,
    scaleTime,
} from '@ripl/web';
scaleLog and scaleSqrt are also exported as shortcuts for a base-10 logarithmic scale and a power scale with exponent 0.5.
const scale = scaleContinuous([0, 25], [-100, 100]);
scale(10); // -20
scale.inverse(-20); // 10

// With clamping
const clamped = scaleContinuous([0, 25], [-100, 100], { clamp: true });
clamped(30); // 100
const scale = scaleDiscrete(['a', 'b', 'c'], [0, 50]);
scale('b'); // 25
const scale = scaleBand(['A', 'B', 'C'], [0, 300], {
    innerPadding: 0.1,
    outerPadding: 0.05,
});
scale('B'); // position of band B
scale.bandwidth; // width of each band
scaleDiverging maps values below and above a midpoint to separate sub-rangesscaleLogarithmic is a logarithmic mapping with configurable base (scaleLog is the base-10 shortcut)scaleOrdinal maps discrete domain values to discrete range values, cycling the rangescalePoint positions discrete values at evenly spaced points along a rangescalePower is a polynomial mapping with configurable exponent (scaleSqrt is the exponent-0.5 shortcut)scaleQuantile maps continuous data to discrete quantile binsscaleQuantize maps a continuous domain to discrete range valuesscaleRadial maps a numeric magnitude onto a ring radius (clamped by default), for radial/polar chartsscaleSymlog is a symmetric-log mapping that handles negatives and zero (linear near zero, log beyond a configurable constant)scaleThreshold maps values to discrete outputs based on threshold boundariesscaleTime maps Date domains to numeric ranges@ripl/3d extends the Canvas context with perspective/orthographic projection, camera controls, and flat shading.
import {
    Camera,
    Context3D,
    createCube,
    createSphere,
} from '@ripl/3d';
Available 3D primitives: cube, sphere, cylinder, cone, plane, torus.
Camera supports interactive zoom, pivot, and pan with configurable sensitivity. For hardware-accelerated rendering, @ripl/webgpu provides a drop-in WebGPU context with a real depth buffer, MSAA, and WGSL shaders; the same Shape3D elements work in both.
context.createPath(id) so SVG contexts can efficiently diff DOM elements between frames.destroy() on elements, scenes, and renderers when done to clean up subscriptions and DOM references.{ debug: true } on the renderer to visualize FPS, element count, and bounding boxes during development.# Install dependencies yarn install # Build all packages yarn build # Run tests yarn test # Lint yarn lint
more like this
Firefox and Chrome extensions to prevent Google from making links ugly.
search projects, people, and tags