moxon-frame-generator
simple generator for 3D-printed frames for a moxon rectangle antenna
OpenSCAD★ 50
Software for receiving the hydrogen line at 1420.4MHz with an RTL-SDR dongle
 byggemandboesen
git clone https://github.com/byggemandboesen/H-line-software.gitbyggemandboesen/H-line-softwareThis software is created with the main purpose of receiving the hydrogen line at a frequency of approximately 1420.4MHz.
The software uses the pyrtlsdr library to collect samples from the RTL-SDR V3.0 dongle and numpy to perform FFT and signal processing. Finally, the data is shown in a chart from the pyplot library in matplotlib.
This project started as a project of my own to make radio astronomy easy and affordable for everyone. There are great pieces of software out there, Virgo and Pictor are personal favourites and inspirations for my own software.
However, these require setting up a GNU radio environment, which can sometimes be difficult and too much to ask for it you're a beginner/newcomer to the hobby. It's this exact reason I wanted to create a piece of software that will run on many operating systems and only depend on a couple of python packages.
TL;DR, you should choose this software if you don't have much experience with the GNU radio environment and software defined radios in generel.
As usual, the code should be downloaded with git clone.
git clone https://github.com/byggemandboesen/H-line-software.git
Some packages are required which can be downloaded with pip:
pip install matplotlib numpy pyephem pyrtlsdr imageio
One can also install the required packages from the "requirements.txt":
pip install -r requirements.txt
When installing on Linux, one should install librtlsdr-dev, and make sure to use "pip3 install ...".
sudo apt install librtlsdr-dev
If you're using windows, you need to manually download the rtl-sdr drivers and add them to system PATH. Download the rtl-sdr drivers for windows and add the files from the rtl-sdr drivers into the X64 folder, overwriting any files that may already exist. The "X64" folder has to be added to PATH under system variables.
The software can be run headless on a remote Raspberry pi for example or with the help of the user interface. The following section will describe necessary information about both usage cases.
Included in the software directory is the config.json file which includes all the software parameters.
{
    "SDR": {
        "sample_rate": 2400000,
        "PPM_offset": 0,
        "TCP_host": false,
        "connect_to_host": false,
        "host_IP": "127.0.0.1"
    },
    "DSP": {
        "number_of_fft": 1000,
        "resolution": 11,
        "median": 5
    },
    "observer": {
        "latitude": 0.0,
        "longitude": 0.0,
        "azimuth": 0.0,
        "altitude": 0.0,
        "elevation": 0.0
    },
    "plotting": {
        "plot_map": true,
        "y_min": 0.0,
        "y_max": 0.0
    },
    "observation": {
        "24h": false,
        "degree_interval": 5.0,
        "datafile": false
    }
}
TCP_host to true.
If you wish connect to an existing server, set connect_to_host to true and add the remote host_IP of the host.number_of_fft will average more FFT's and will in many cases improve the shape of the hydrogen line. median parameter determines how many samples should be averaged together in a rolling median filter. This sometimes helps dealing with noise.plot_map of the sky observed at the Hydrogen line frequency. degree_interval for 24 hours. To edit any of these parameters, simply edit and save the debug file, and then run the software, py H-line.py or python3 H-line.py.
To make it easier to change these parameters one may want to use the optional UI.
This is available by running the ui.py file in terminal:
py ui.py
python3 ui.py
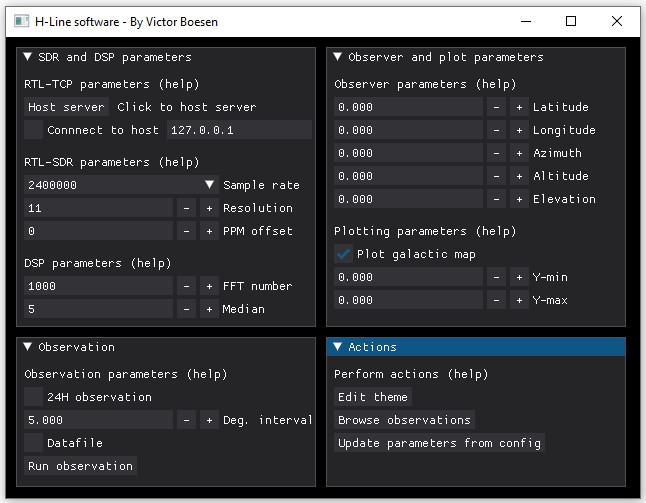
If you need help or forget how the parameters work simply hover above the (help) text for each section.
The UI is made with the dearpygui package for python.
The following GIF consists of 19 separate observations from across the galactic plane in 10 degree intervals.
The observations were done with an RTL-SDR V3.0 dongle, Nooelec SAWbird+ H1 and a wifi grid dish with a flipped reflector element for better frequency matching.
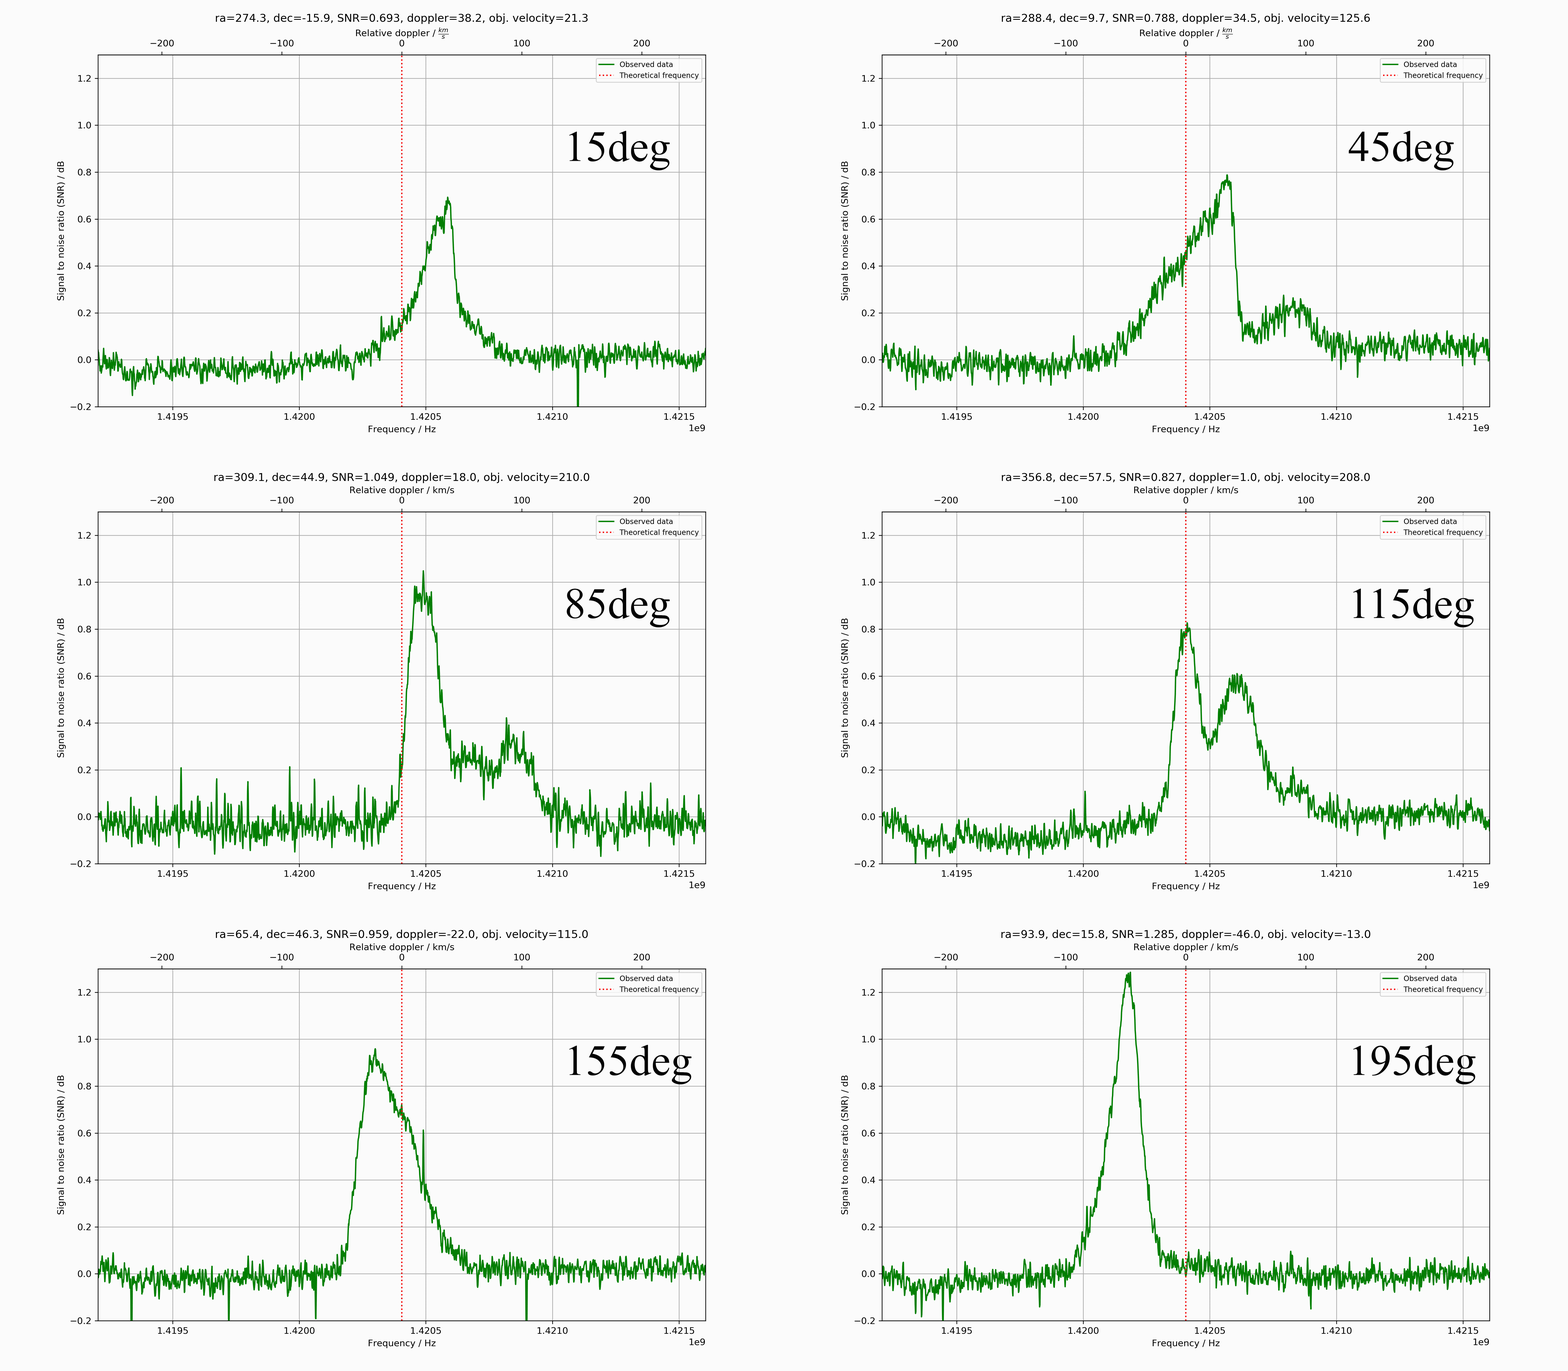 Besides the default parameters, the following parameters were used for the observations:
Numer of FFT = 50000
Median = 0
Y-axis interval = [-0.2,1.3]
When setting show_map: true, the software plots the observation together with a map of the Milky Way and the observed position.
This also calculates relative velocity and etc. from the direction of the observation and the observed doppler shift.
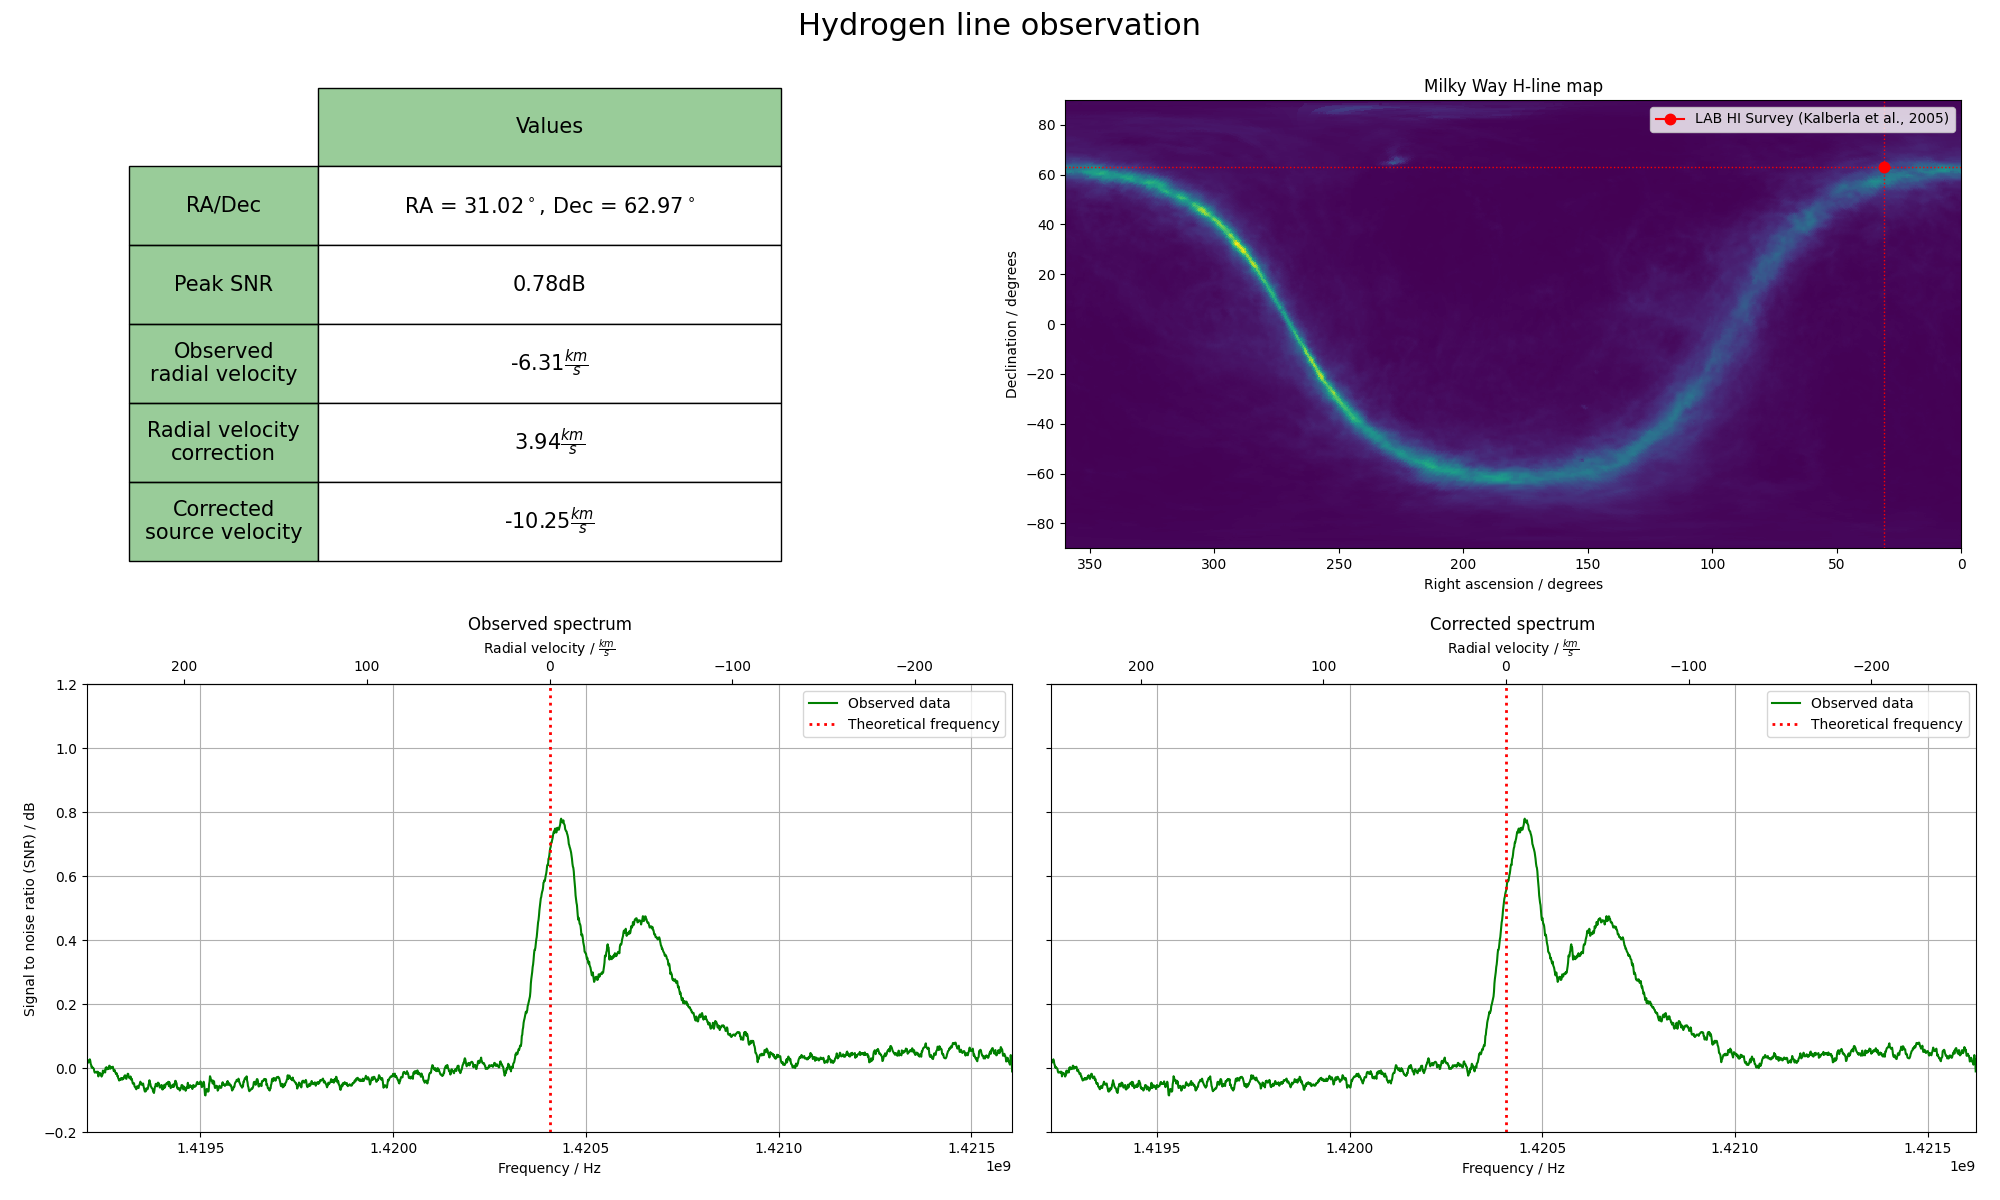 In this example, the following parameters were used besides the default parameters:
Number of FFT = 50000
Median = 10
Y-axis interval = [-0.2,1.2]
RTL-TCP is supported through the pyrtlsdr package. This allows a device, with an RTL unit connected, to act as a host/server using the TCP_host parameter.
This will create a server open to port 5050 and the device's local ip, for example 192.168.0.29. If you wish to change to local host, you will, at the current moment, have to edit the code itself.
In rtl.py modify the following line in the function tcpHost():
server = RtlSdrTcpServer(hostname = local_ip, port = 5050)
server = RtlSdrTcpServer(hostname = '127.0.0.1', port = 5050)
Note, using RTL-TCP may be significantly slower than running everything locally depending on wifi/internet speeds.
Setting the debug parameter to true will write a debug file from the corresponding observation. This includes the observation parameters, and all the received data before and after processing.
{
    "Observation parameters": {
        "SDR": {
            "sample_rate": 2400000,
            "PPM_offset": 0,
            "TCP_host": false,
            "connect_to_host": false,
            "host_IP": "127.0.0.1"
        },
        "DSP": {
            "number_of_fft": 1000,
            "resolution": 11,
            "median": 5
        },
        "Observer": {
            "latitude": 0.0,
            "longitude": 0.0,
            "azimuth": 0.0,
            "altitude": 0.0,
            "elevation": 0.0
        },
        "Observation": {
            "24h": false,
            "degree_interval": 5.0,
            "datafile": true
        }
    },
    "Observation results": {
        "Time": "yyyy-mm-dd hh:mm:ss",
        "RA": 0.0,
        "Dec": 0.0,
        "Galactic lon": 0.0,
        "Galactic lat": 0.0,
        "Observed radial velocity": -0.0,
        "Barycenter correction": 0.0,
        "LSR correction": 0.0,
        "Radial velocity": -0.0,
        "Max SNR": 0.0
    },
    "Data": {
        "Blank spectrum": "List with blank spectrum",
        "H-line spectrum": "List with H-line spectrum",
        "SNR Spectrum": "List with the processed data from the two above",
        "Frequency list": "List with frequencies"
    }
}
You run into errors when running the software, or have some questions about it. Check the list below to find help. If you didn't find the answer you were looking for, feel free to get in contact with me on Twitter.
If you run into problems with matplotlib and numpy running the software on a Raspberry Pi, more specifically this error - "Importing the numpy c-extensions failed".
Then run the following command as per this issue on GitHub.
sudo apt-get install libatlas-base-dev
However, it is adviced you run the following if other problems occur.:
sudo apt update
sudo apt upgrade
Since the intention of this software is to motivate amateurs to give radio astronomy a try the versatility of the software is limited to the packages available. The RTL2832U tuner is well supported by the pyrtlsdr package Although it does lack certain features like offset tuning, which results in degraded performance for E4000 tuner SDR's like the Nooelec Smart XTR for example.
If the pyrtlsdr package improves/introduces new features that allow for further improvements I will be implementing these in my software ASAP.
This is not a fault with the code or used packages. Instead, it's simply because the software doesn't use sidereal time.
The Earth drifts about 1 degree in its orbit around the sun, which is reflected on the data from this software.
Call it a bug or a feature, or just science:). I may consider switching to sidereal time at some point.
I would like to thank 0xCoto AKA "Apostolos" for letting me use the hydrogen map from the Pictor and Virgo projects.
I really appreciate his work for the amateur radio astronomy community!
If you reached this far and enjoy my software, it would mean a lot to me, if you showed your support on Ko-fi! If you don't want to tip me, please consider starring the software instead 😃
more like this
simple generator for 3D-printed frames for a moxon rectangle antenna
meine 🌒 - A CLI file manager and system utility built with Textual. It combines intuitive command parsing with rich t…
search projects, people, and tags