outfancy
Python library to print tables in Terminal.
 carlosplanchon
git clone https://github.com/carlosplanchon/outfancy.gitcarlosplanchon/outfancyoutfancy
Table printing and Line plotting in Terminal

What is it?
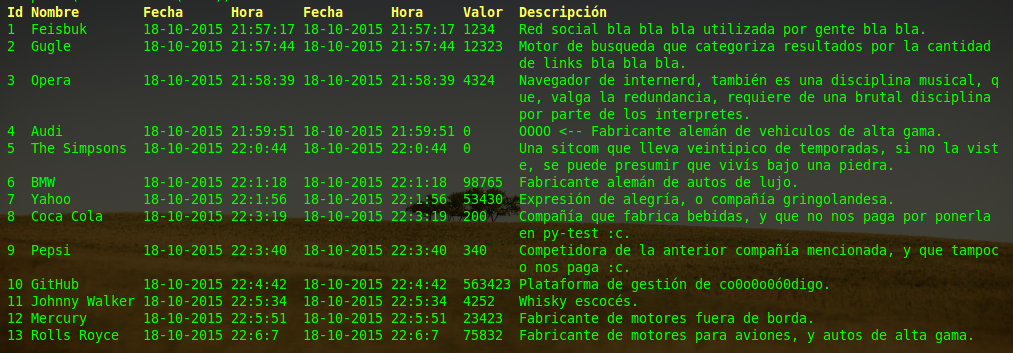
Outfancy is a Python library for printing tables and charts in the terminal. It's a quick way to visualize data when you don't have a GUI, and it integrates easily into your programs. You can install it with uv or pip and use it anywhere.
This was the first library I ever built when I was 16 :). It's been modernized to support Python 3.10+, fix bugs, add type hints, improve logging, and enhance performance, but the original style is still there: raw, exploratory teenage code.
Documentation
- DeepWiki Docs - Comprehensive documentation
- LOGGING.md - Logging system configuration and usage
- logging_example.py - Practical logging examples
Installation
Install as a library (uv)
uv add outfancy
Install as a CLI tool (uv)
uv tool install outfancy
Install with pip
pip install outfancy
Features
- Quick table printing - Print formatted tables in the terminal with automatic column width detection
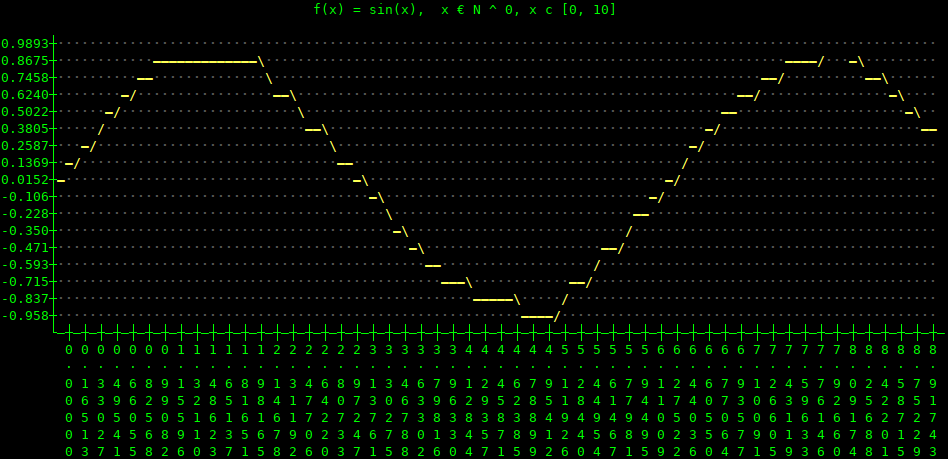
- LineChart plotting - Create line charts with linear interpolation
- Customizable formatting - Configure separators, widths, and column priorities
- Real-time column rearrangement - Dynamically reorder columns
- Auto-generated labels - Automatic label creation above tables
- Oneline printing - Single-line updates for real-time applications
- Color support - Add ANSI colors to table fields
- Type hints - Full type annotation support for better IDE integration
- Configurable logging - Flexible logging system with multiple severity levels
- Data type auto-detection - Automatic detection of ID, name, date, time, value, and description columns
Quick Start
Basic Table
import outfancy.table

table = outfancy.table.Table()
dataset = [(1, 'Marie'), (2, 'Joseph')]
print(table.render(dataset))
Line Chart
import outfancy.chart
from math import sin

line_chart = outfancy.chart.LineChart()
dataset = [(i, sin(i)) for i in range(10)]
line_chart.plot(dataset)
print(line_chart.render(color=True))
Large Table with Pagination
from outfancy.table import LargeTable

large_table = LargeTable()
large_dataset = [(i, f'User {i}', f'user{i}@example.com') for i in range(100)]
print(large_table.render(large_dataset))
Empty State Customization
from outfancy.table import Table, LargeTable

t = Table()
t.set_empty_string('No data available')

lt = LargeTable()
lt.set_empty_string('No data available')
This sets the string displayed when a table cell has no value.
CLI (Added in 2026)
After installing outfancy, the outfancy command is available in your terminal.
Table
Render tabular data from stdin or a file:
# CSV from stdin (first row used as headers)
printf "id,name,value\n1,foo,100\n2,bar,200" | outfancy table

# From a file
outfancy table data.csv

# TSV input
cat data.tsv | outfancy table --tsv

# JSON input (array of objects or array of arrays)
cat data.json | outfancy table --json

# Custom headers
printf "1,foo,100\n2,bar,200" | outfancy table --labels "ID,Name,Value"

# Hide headers
cat data.csv | outfancy table --no-labels

# Select and reorder columns
cat data.csv | outfancy table --order 0,2,1

# Custom column separator
cat data.csv | outfancy table --separator " | "

# Equal width for all columns
cat data.csv | outfancy table --width-equal

# Use first row as column headers (CSV/TSV)
cat data.csv | outfancy table --has-headers
Chart
Render x,y pairs as a line chart:
# From stdin (one x,y pair per line)
printf "1,10\n2,25\n3,15\n4,30\n5,20" | outfancy chart

# With title and colors
printf "1,10\n2,25\n3,15\n4,30\n5,20" | outfancy chart --name "Sales" --color

# From a file
outfancy chart data.csv
Demo
Run the interactive demo:
outfancy-demo
Version
Print the installed version:
outfancy --version
Development
Development installation (pip)
git clone https://github.com/carlosplanchon/outfancy.git
cd outfancy
pip install -e .
Development installation (uv)
git clone https://github.com/carlosplanchon/outfancy.git
cd outfancy
uv venv
uv pip install -e "."
Running tests
Install the development dependencies (adds pytest and pytest-cov):
uv pip install -e ".[dev]"
# or with pip:
pip install -e ".[dev]"
Run the test suite:
# Run all tests
pytest

# Run with verbose output
pytest -v

# Run tests with coverage
pytest --cov=outfancy --cov-report=term-missing
The tests live in tests/ and characterize the current behavior of the library
(the Table, Oneline, LargeTable and LineChart classes, the CLI, and the
pure helpers in widgets/window/colors), so any change that alters the
rendered output is caught early.
Logging Configuration
Outfancy uses a configurable logging system. By default, only WARNING and above messages are shown:
import logging
import outfancy.table

# Enable debug logging
logging.getLogger('outfancy').setLevel(logging.DEBUG)

# Create table with debug output
table = outfancy.table.Table()
See LOGGING.md for detailed logging configuration options.
Contributing
Contributions are welcome! Here's how you can help:
- Report bugs - Open an issue describing the problem
- Suggest features - Share your ideas for improvements
- Submit pull requests - Fix bugs or implement features
- Improve documentation - Help make the docs clearer
- Write tests - Add test coverage for edge cases
Code style
- Follow existing code patterns
- Add type hints to new functions
- Include tests for new features
- Update documentation as needed
Examples & Demos
- Funny demo with colors - Colorful table demonstration
Line Chart Example
License
MIT License - see LICENSE file for details
more like this