perplexity-cli
🧠 A simple command-line client for the Perplexity API. Ask questions and receive answers directly from the terminal! 🚀🚀🚀
Python★ 176
Gonzo! The Go based TUI log analysis tool
 control-theory

🆕 NEW: Press d from any Gonzo view to launch Dstl8.Lite ↓ - a local browser-based dashboard with workspaces, log search, and severity heatmaps.

A powerful, real-time log analysis terminal UI inspired by k9s. Analyze log streams with beautiful charts, AI-powered insights, and advanced filtering.
Here are some references to get you started:
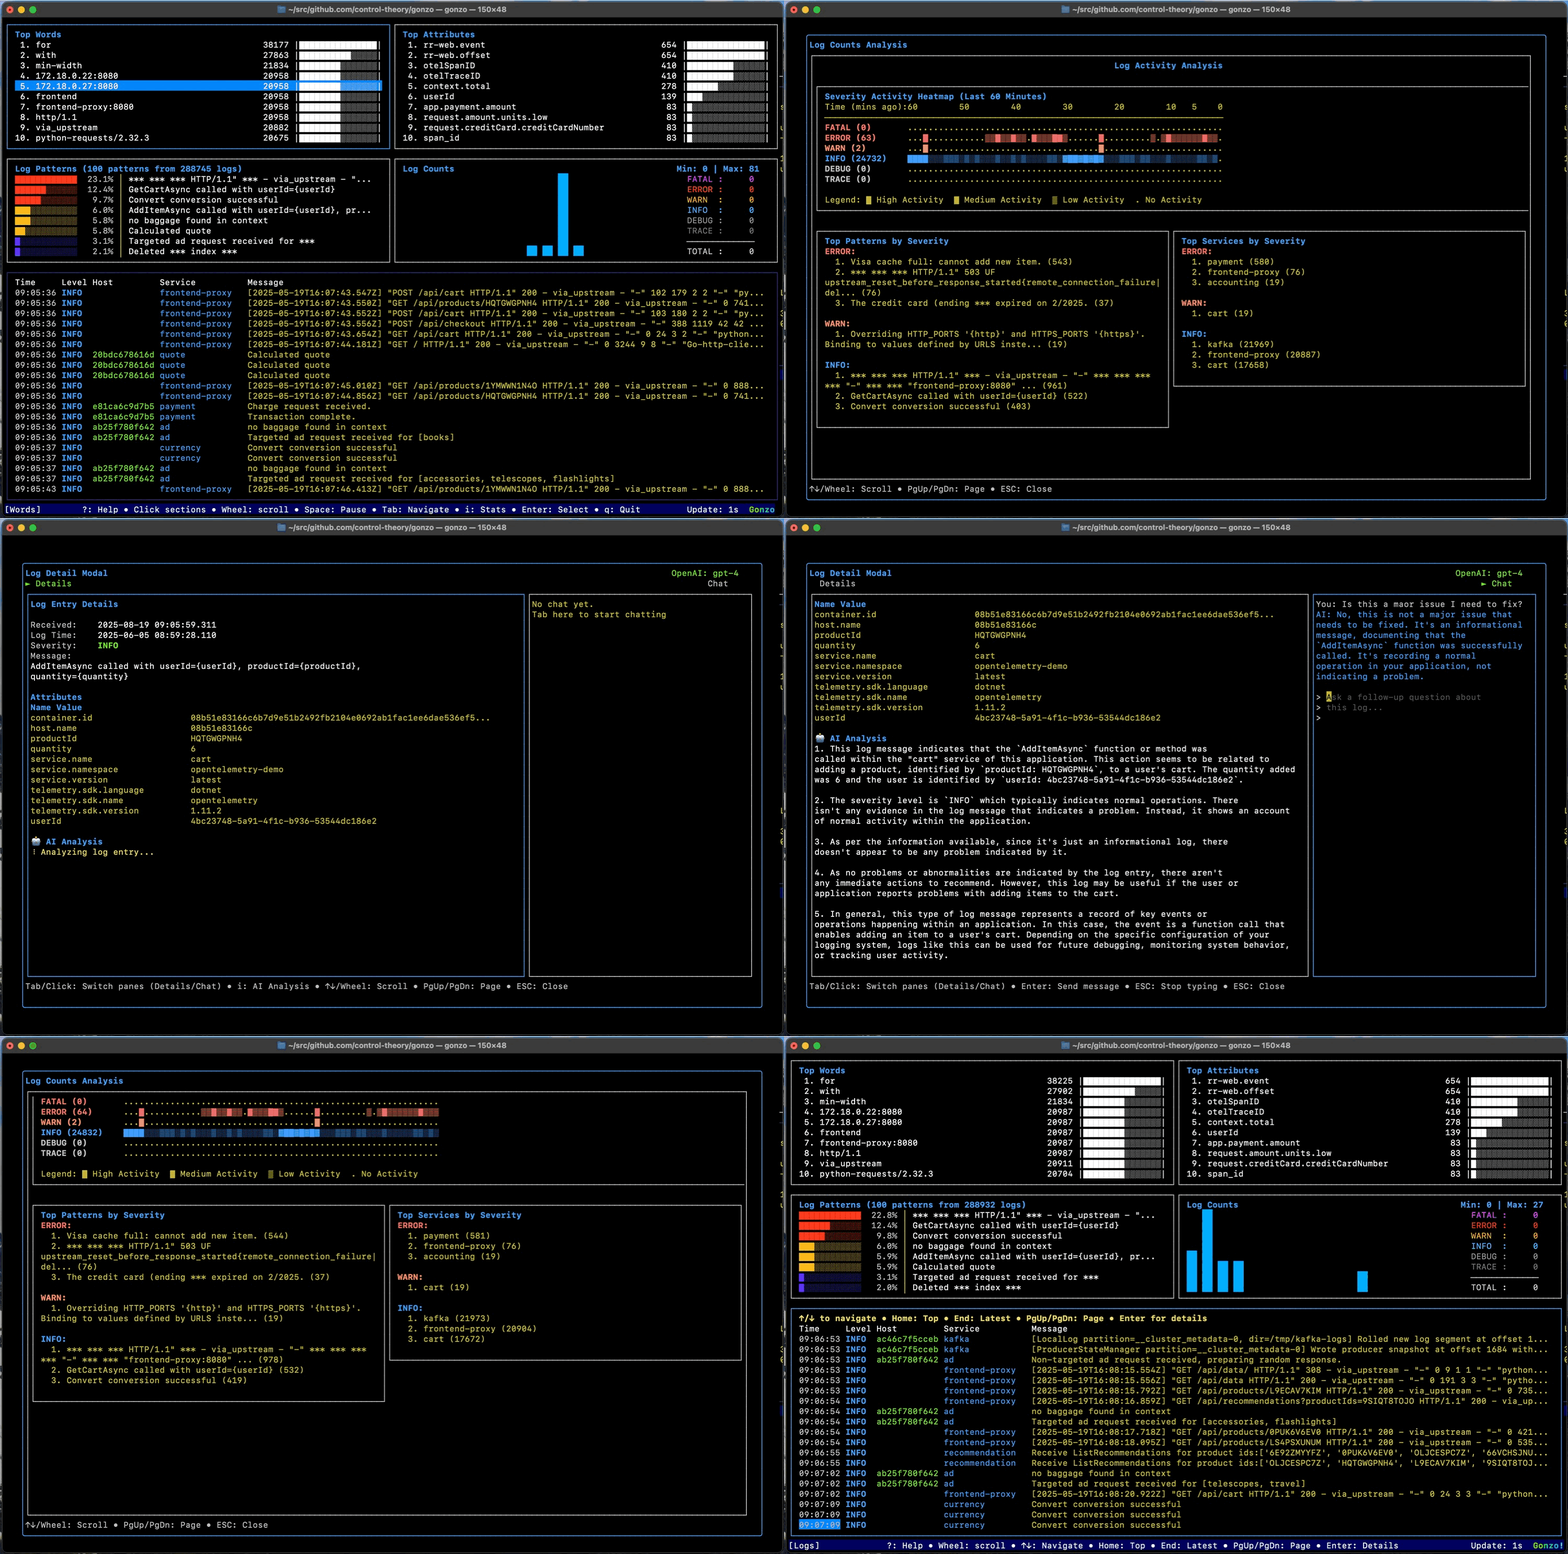
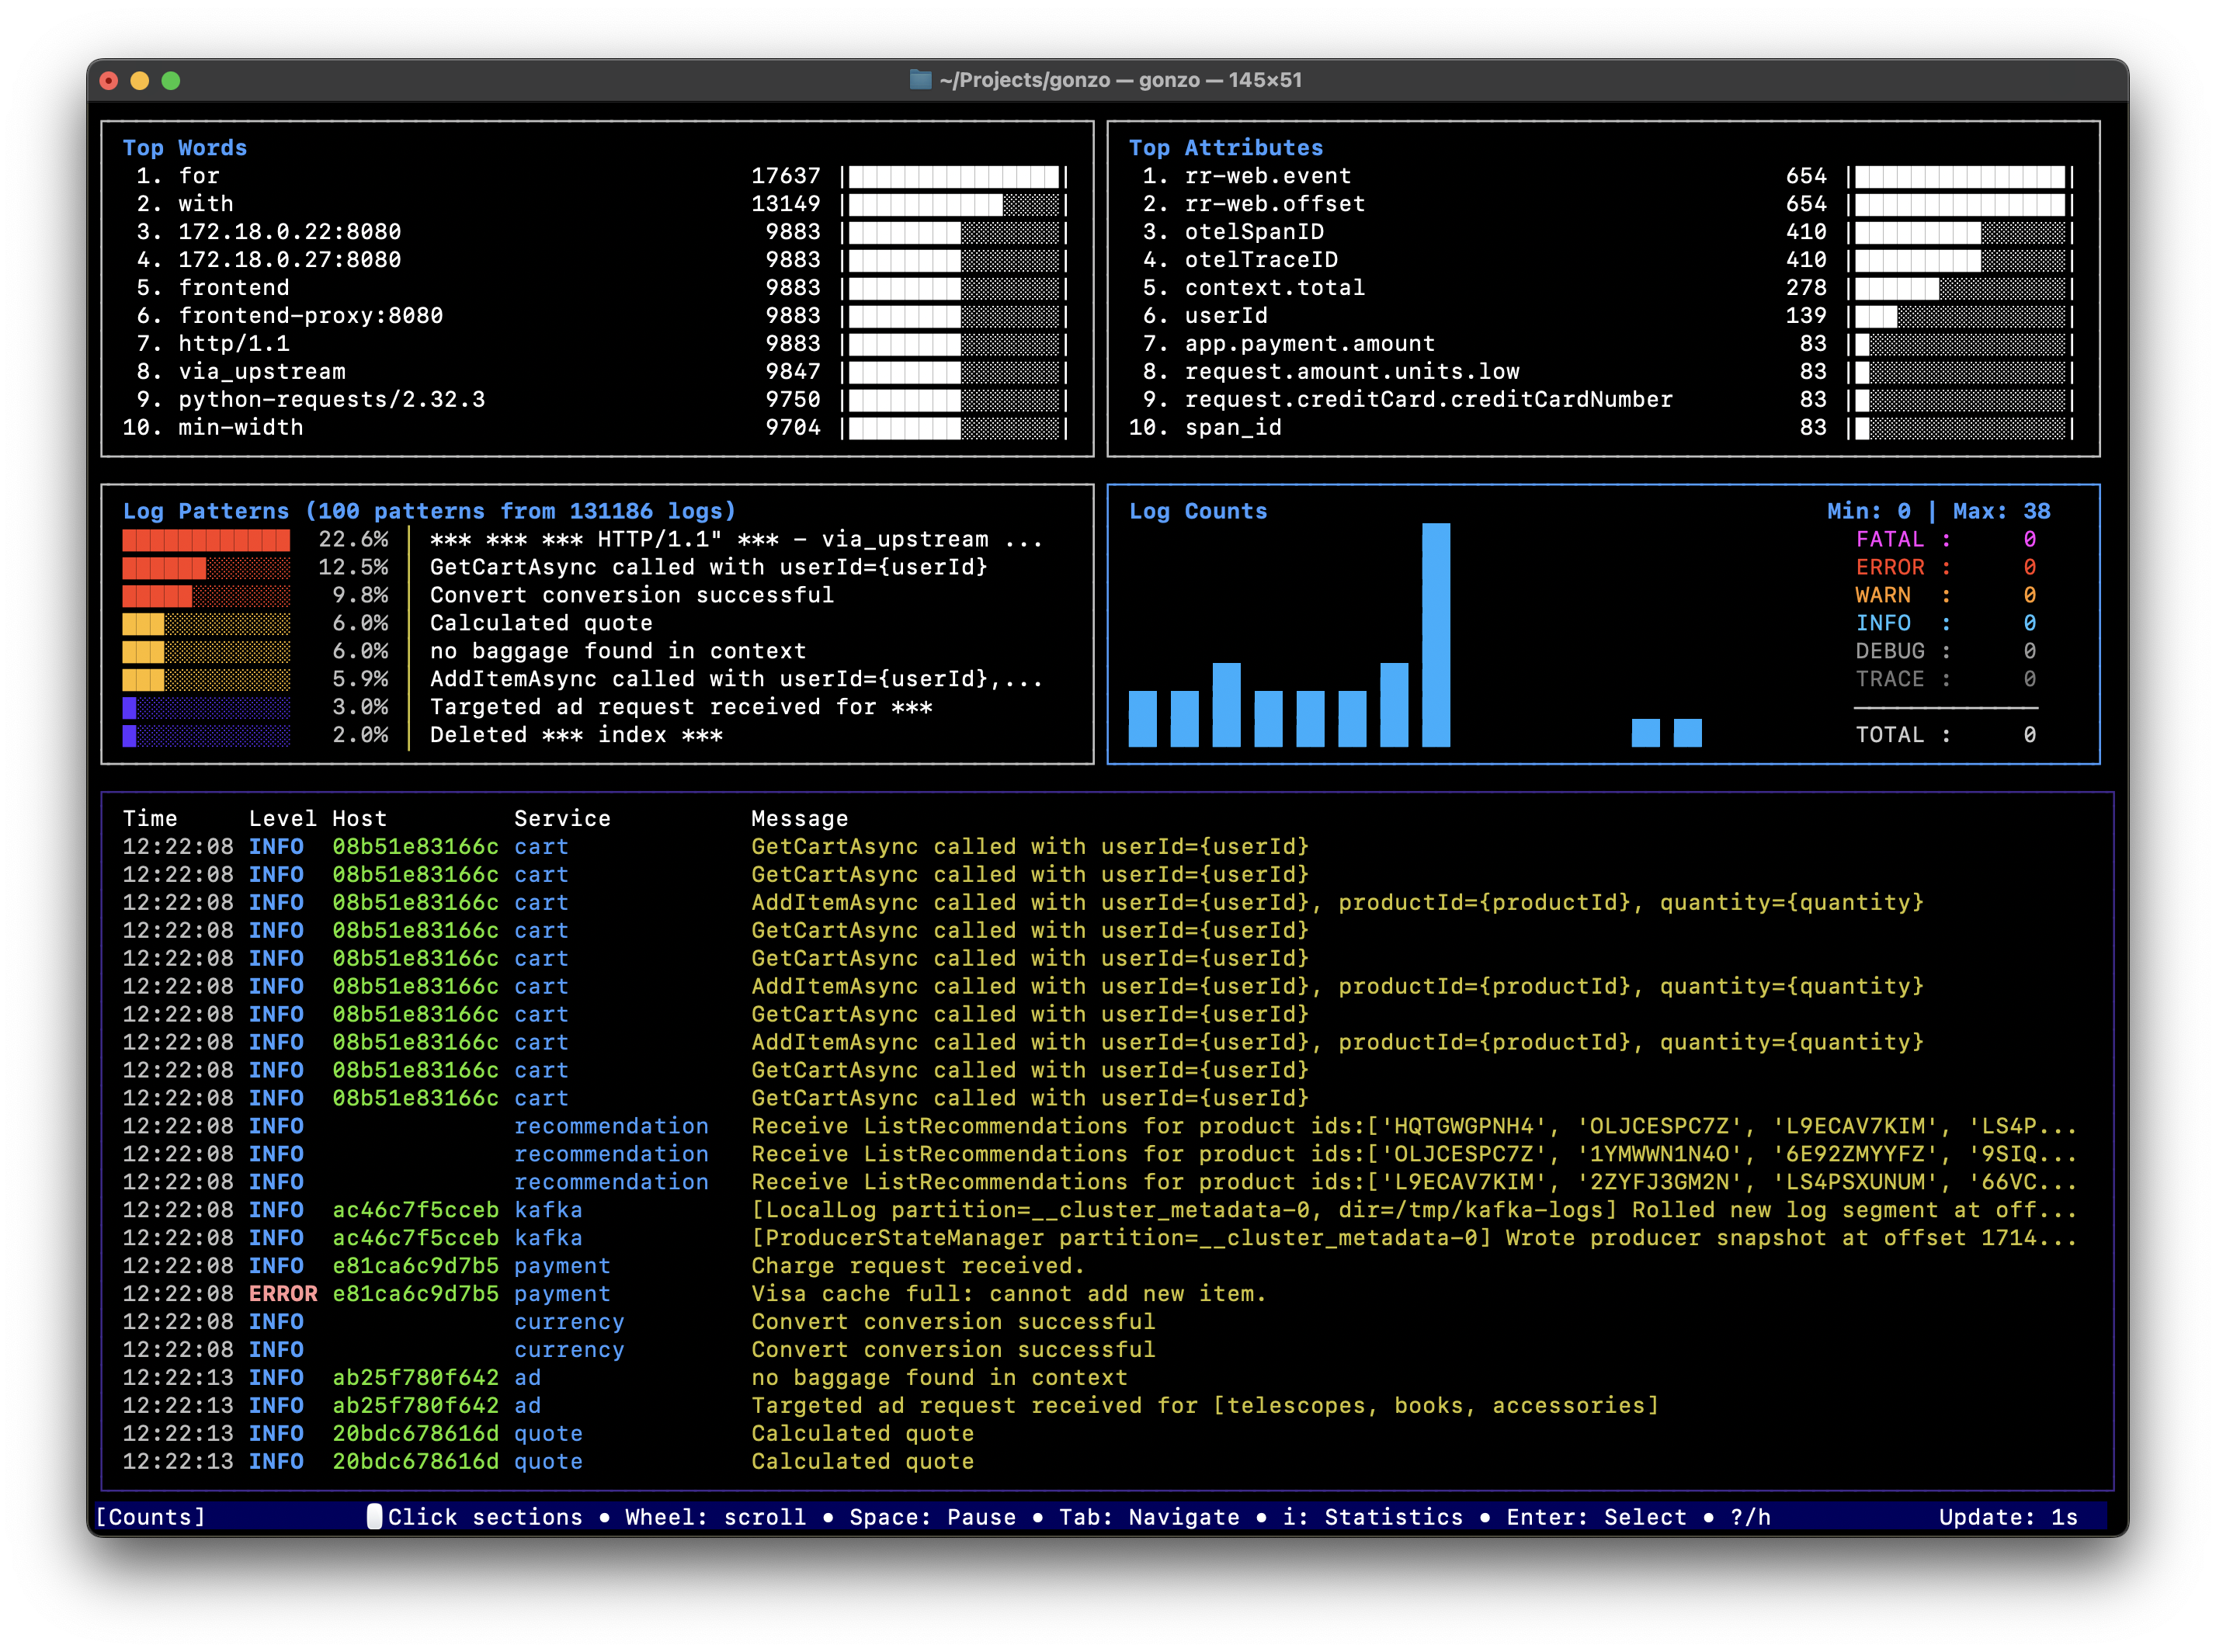
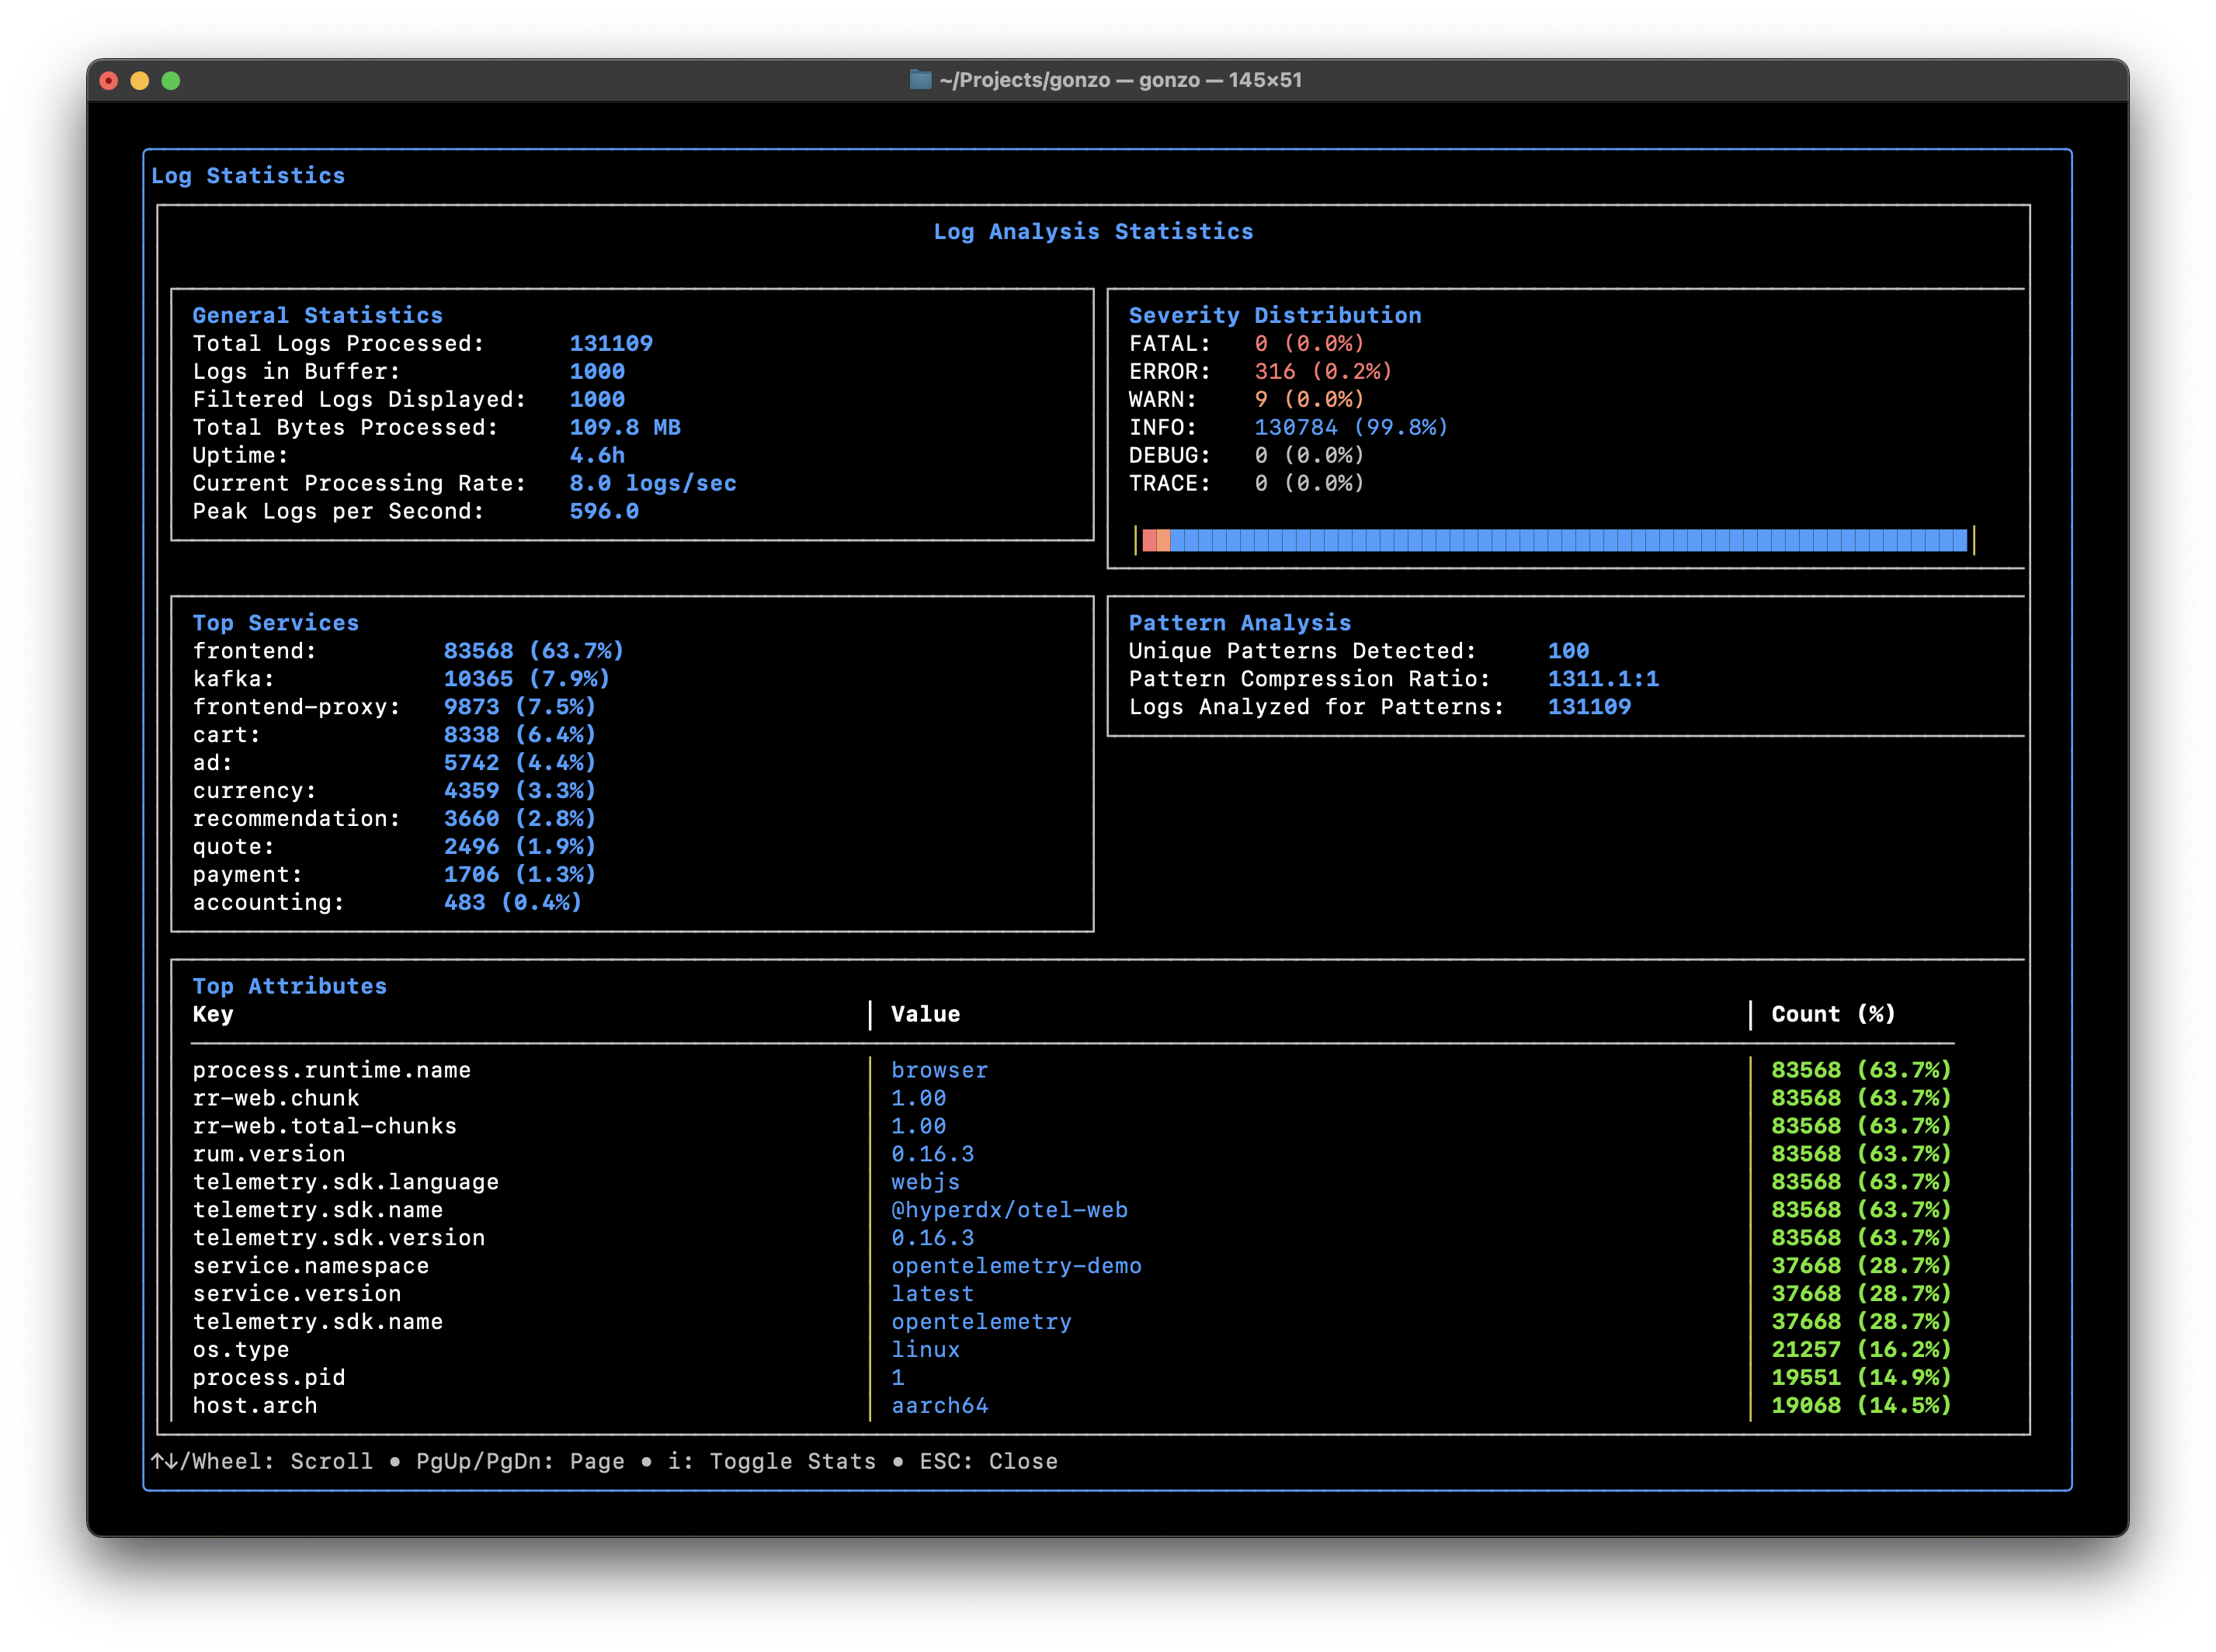
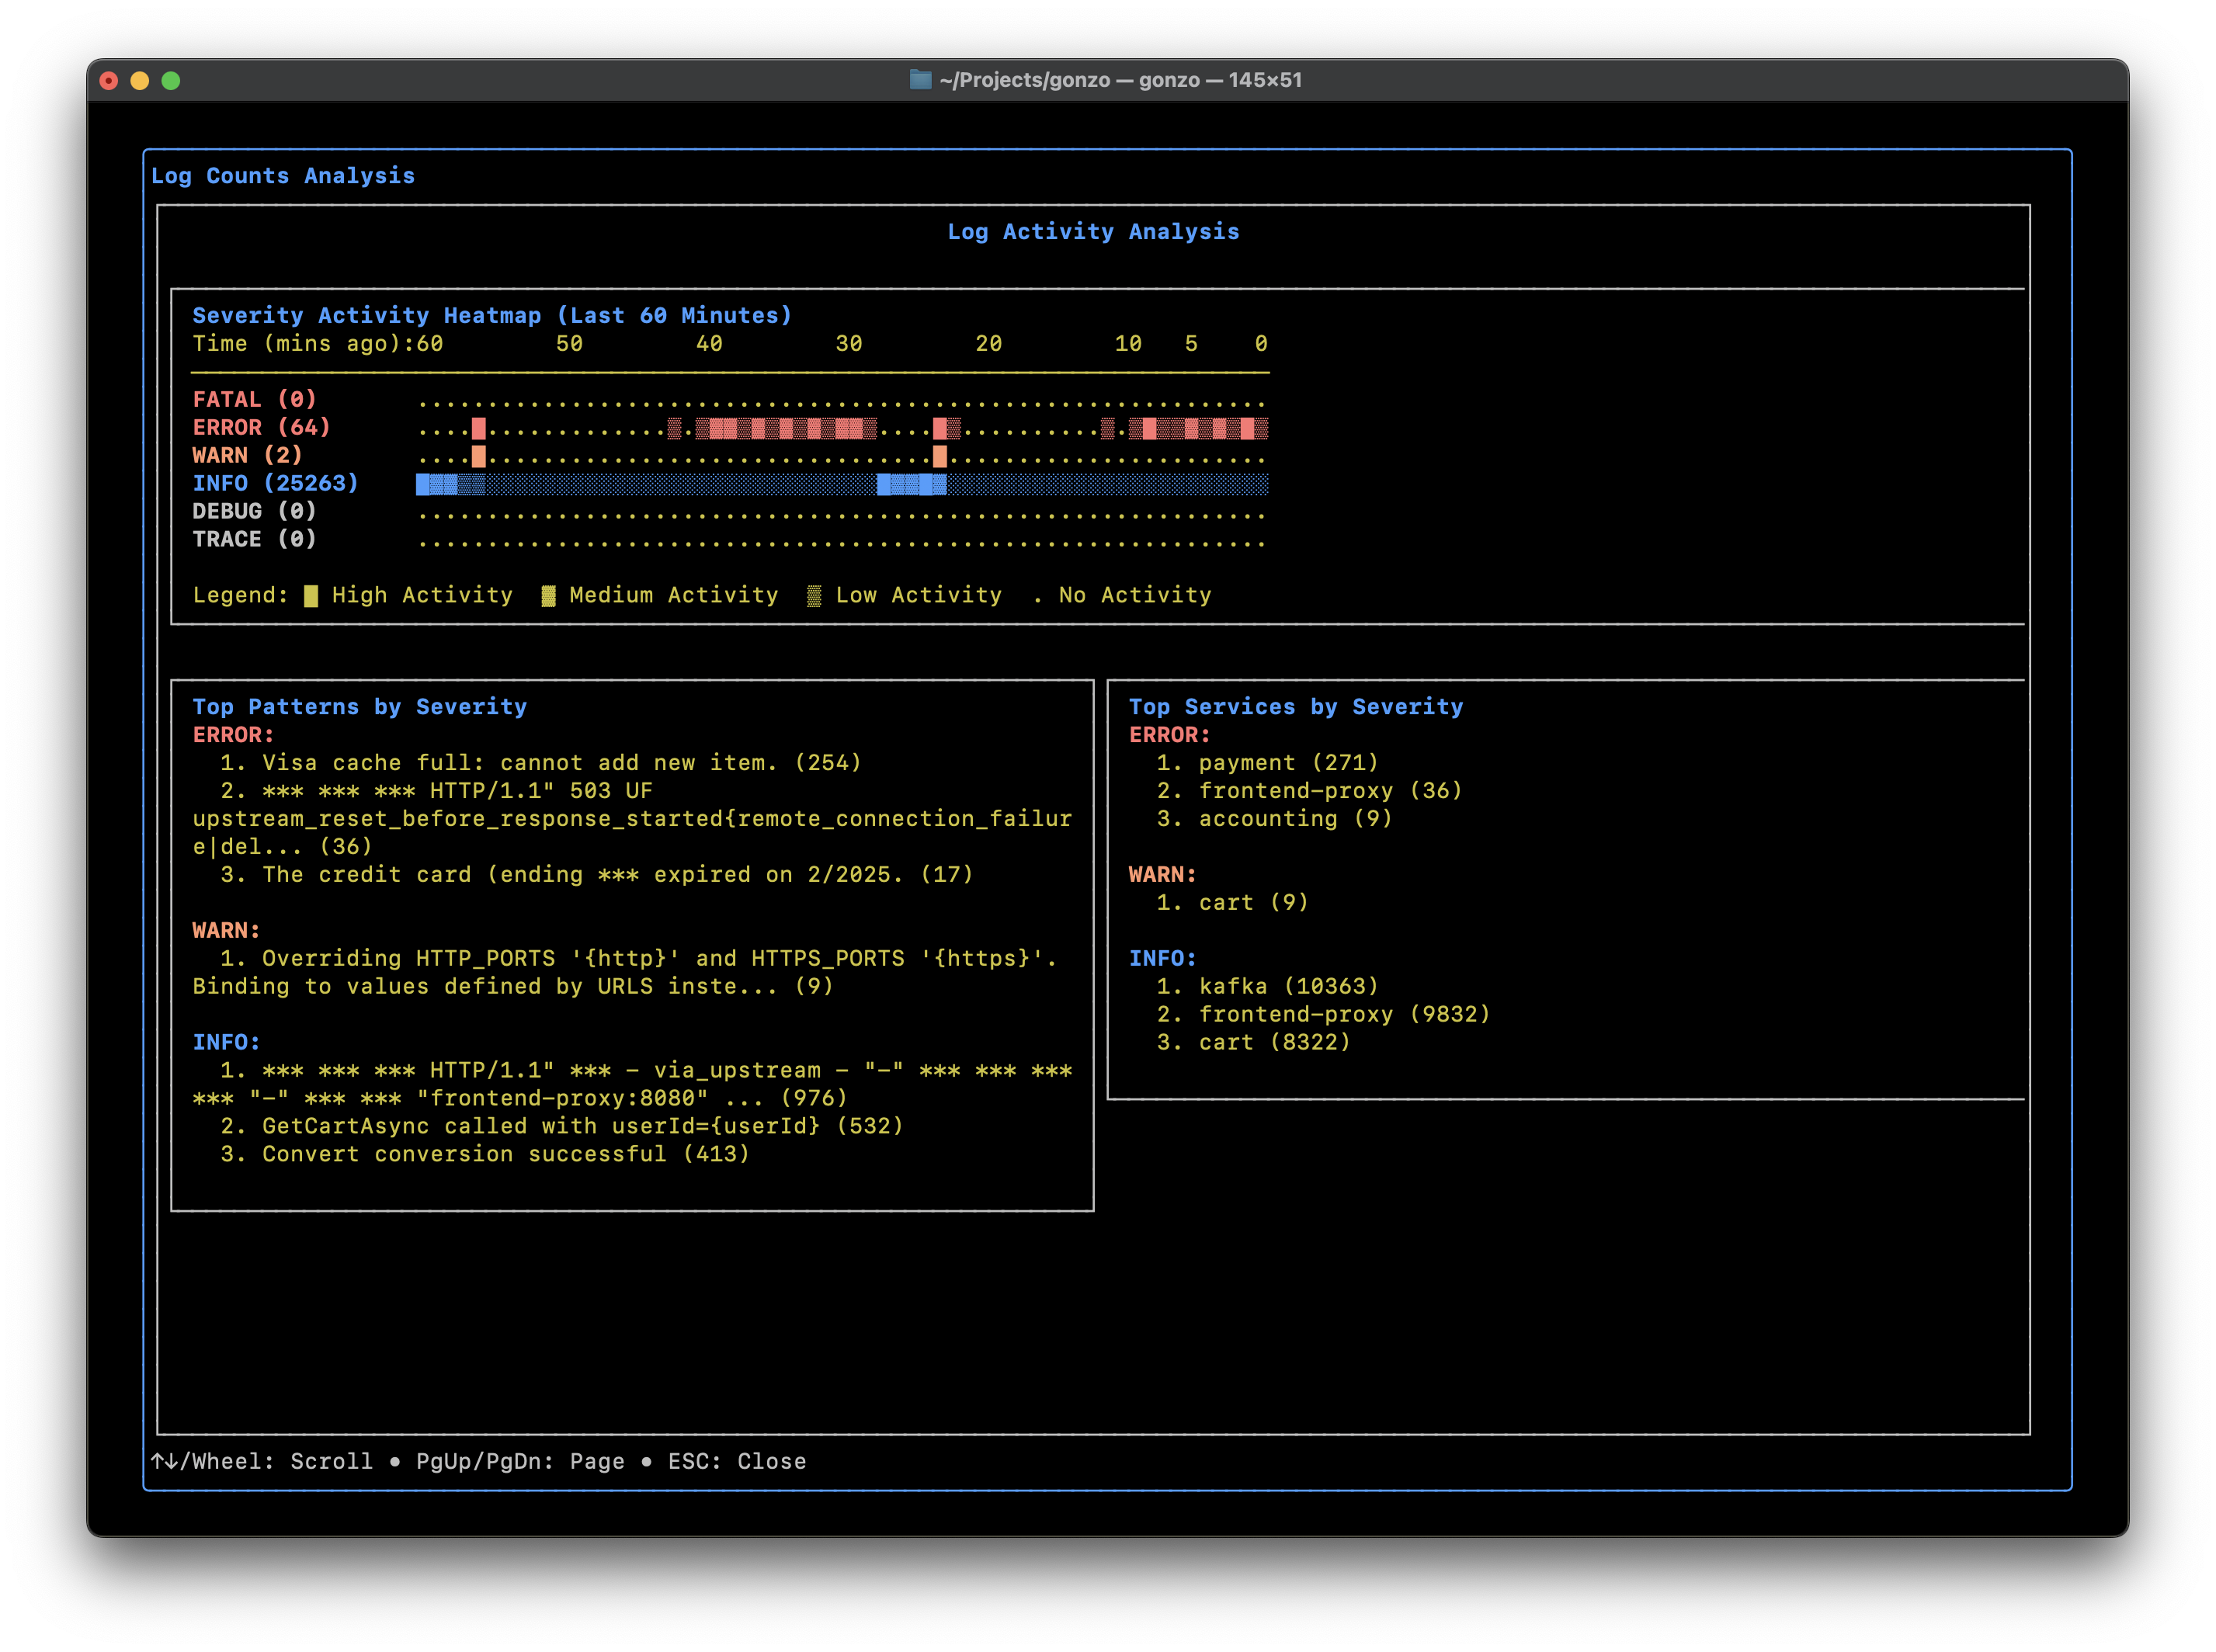
d for Dstl8.LiteHit d from any Gonzo view to launch Dstl8.Lite - a local GUI that streams the same logs Gonzo is analyzing into a richer, browser-based dashboard with workspaces, pattern detection, severity heatmaps, and live log search. All running locally and powered by Gonzo under the hood.
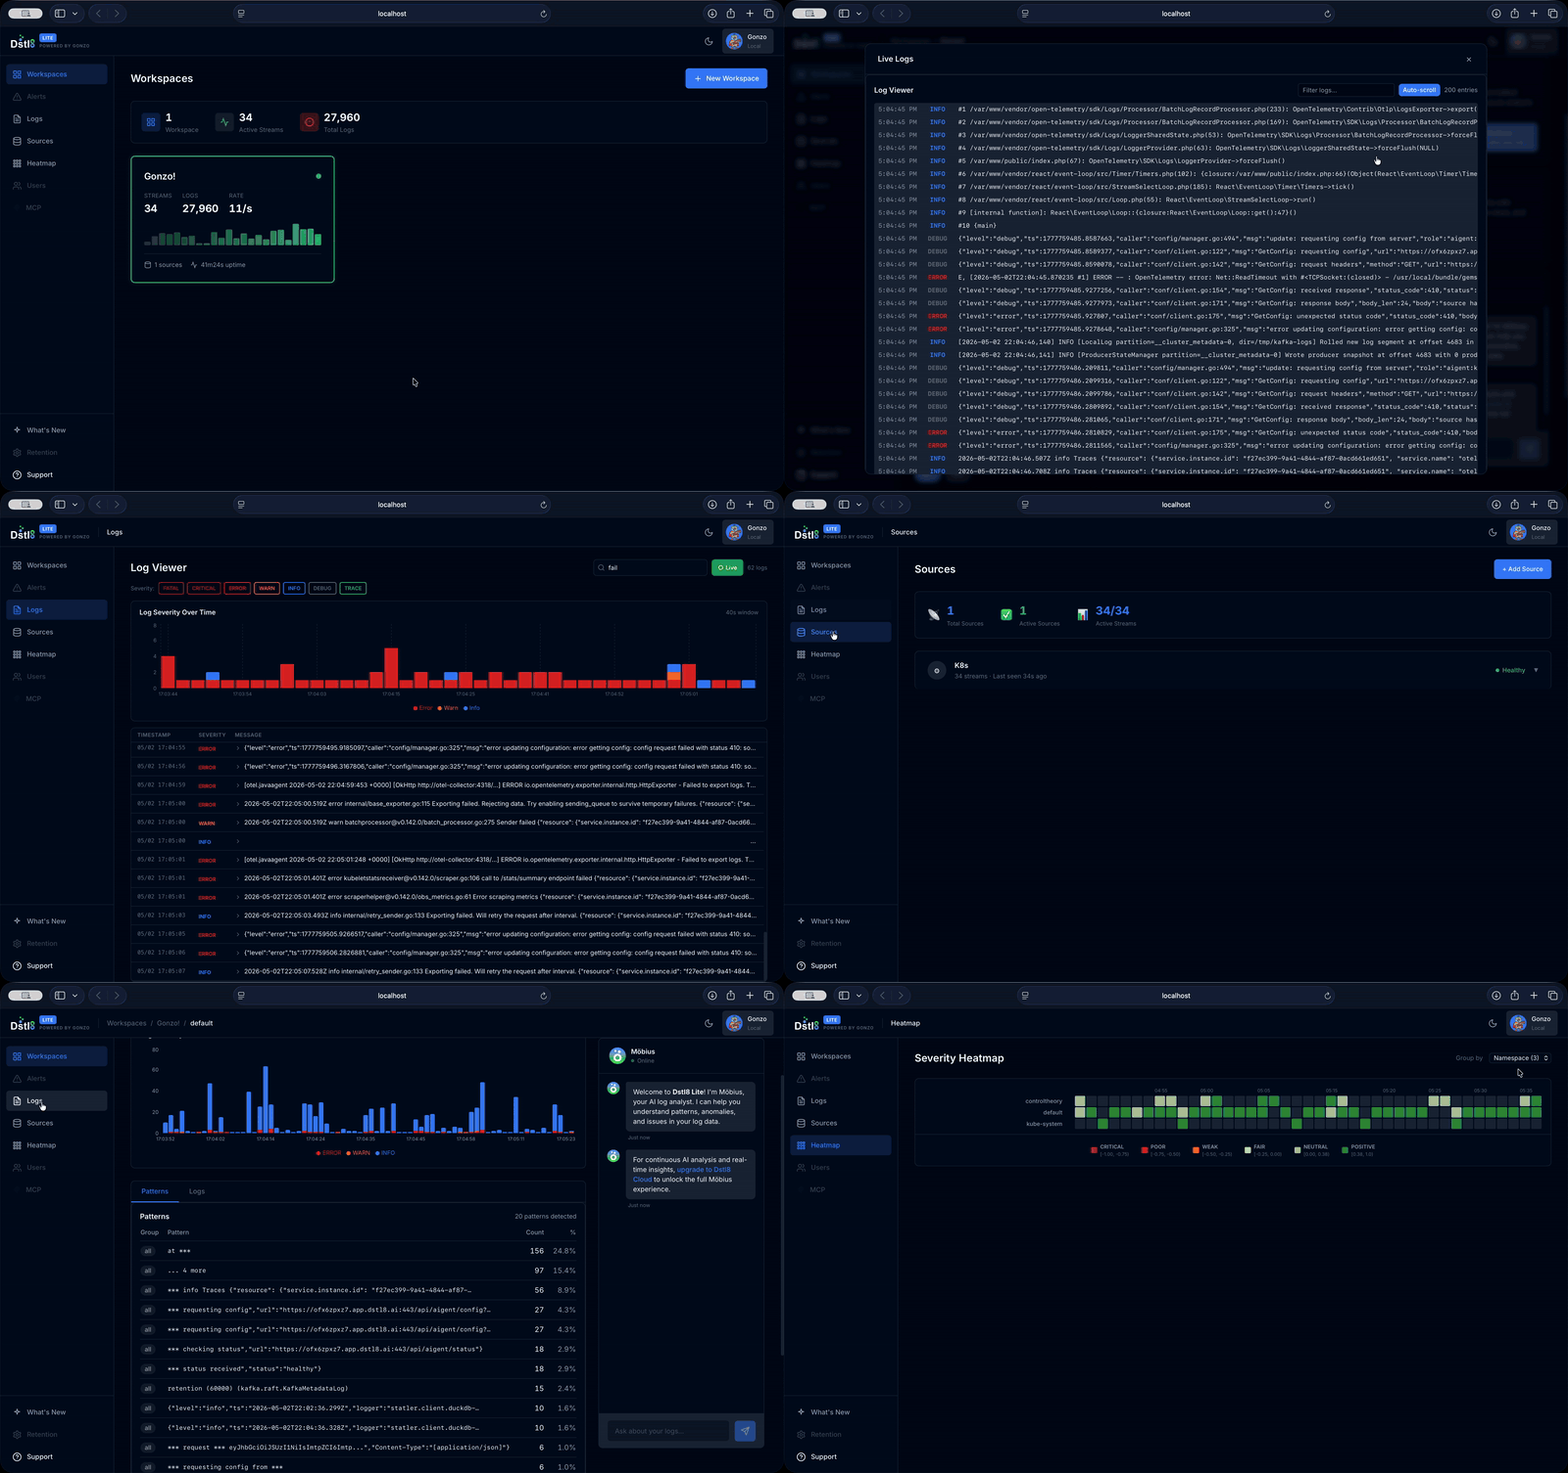
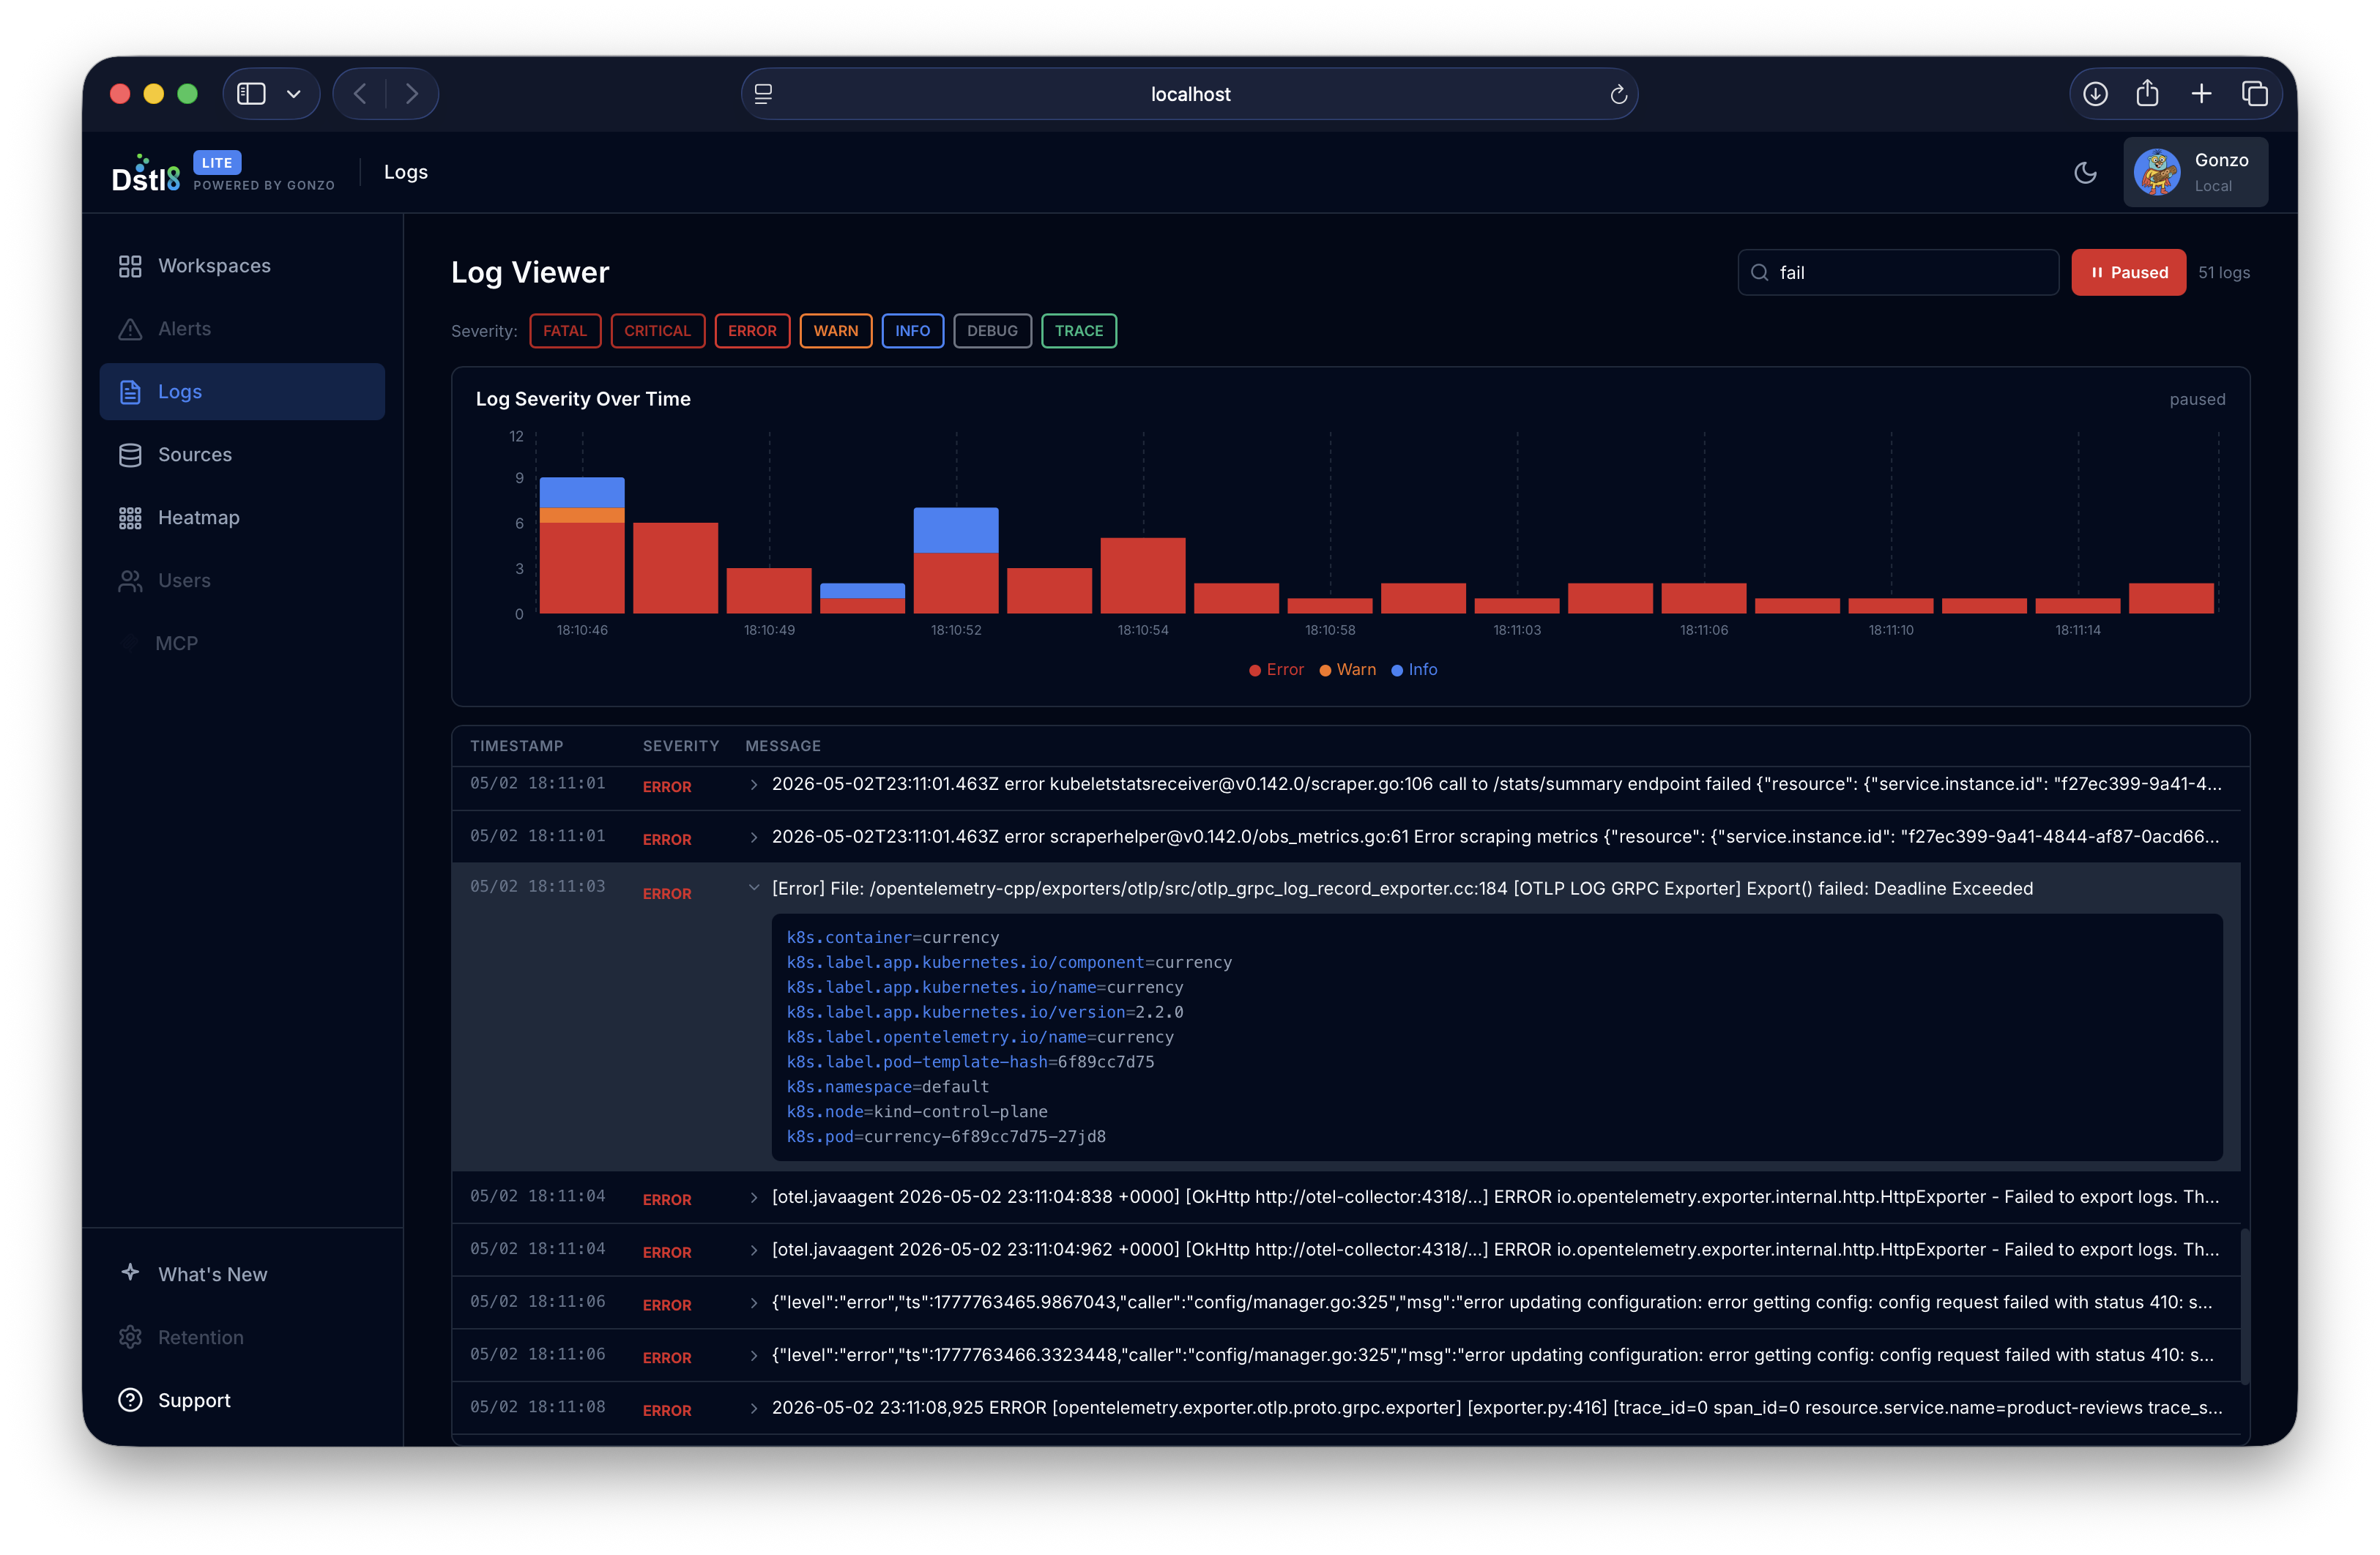
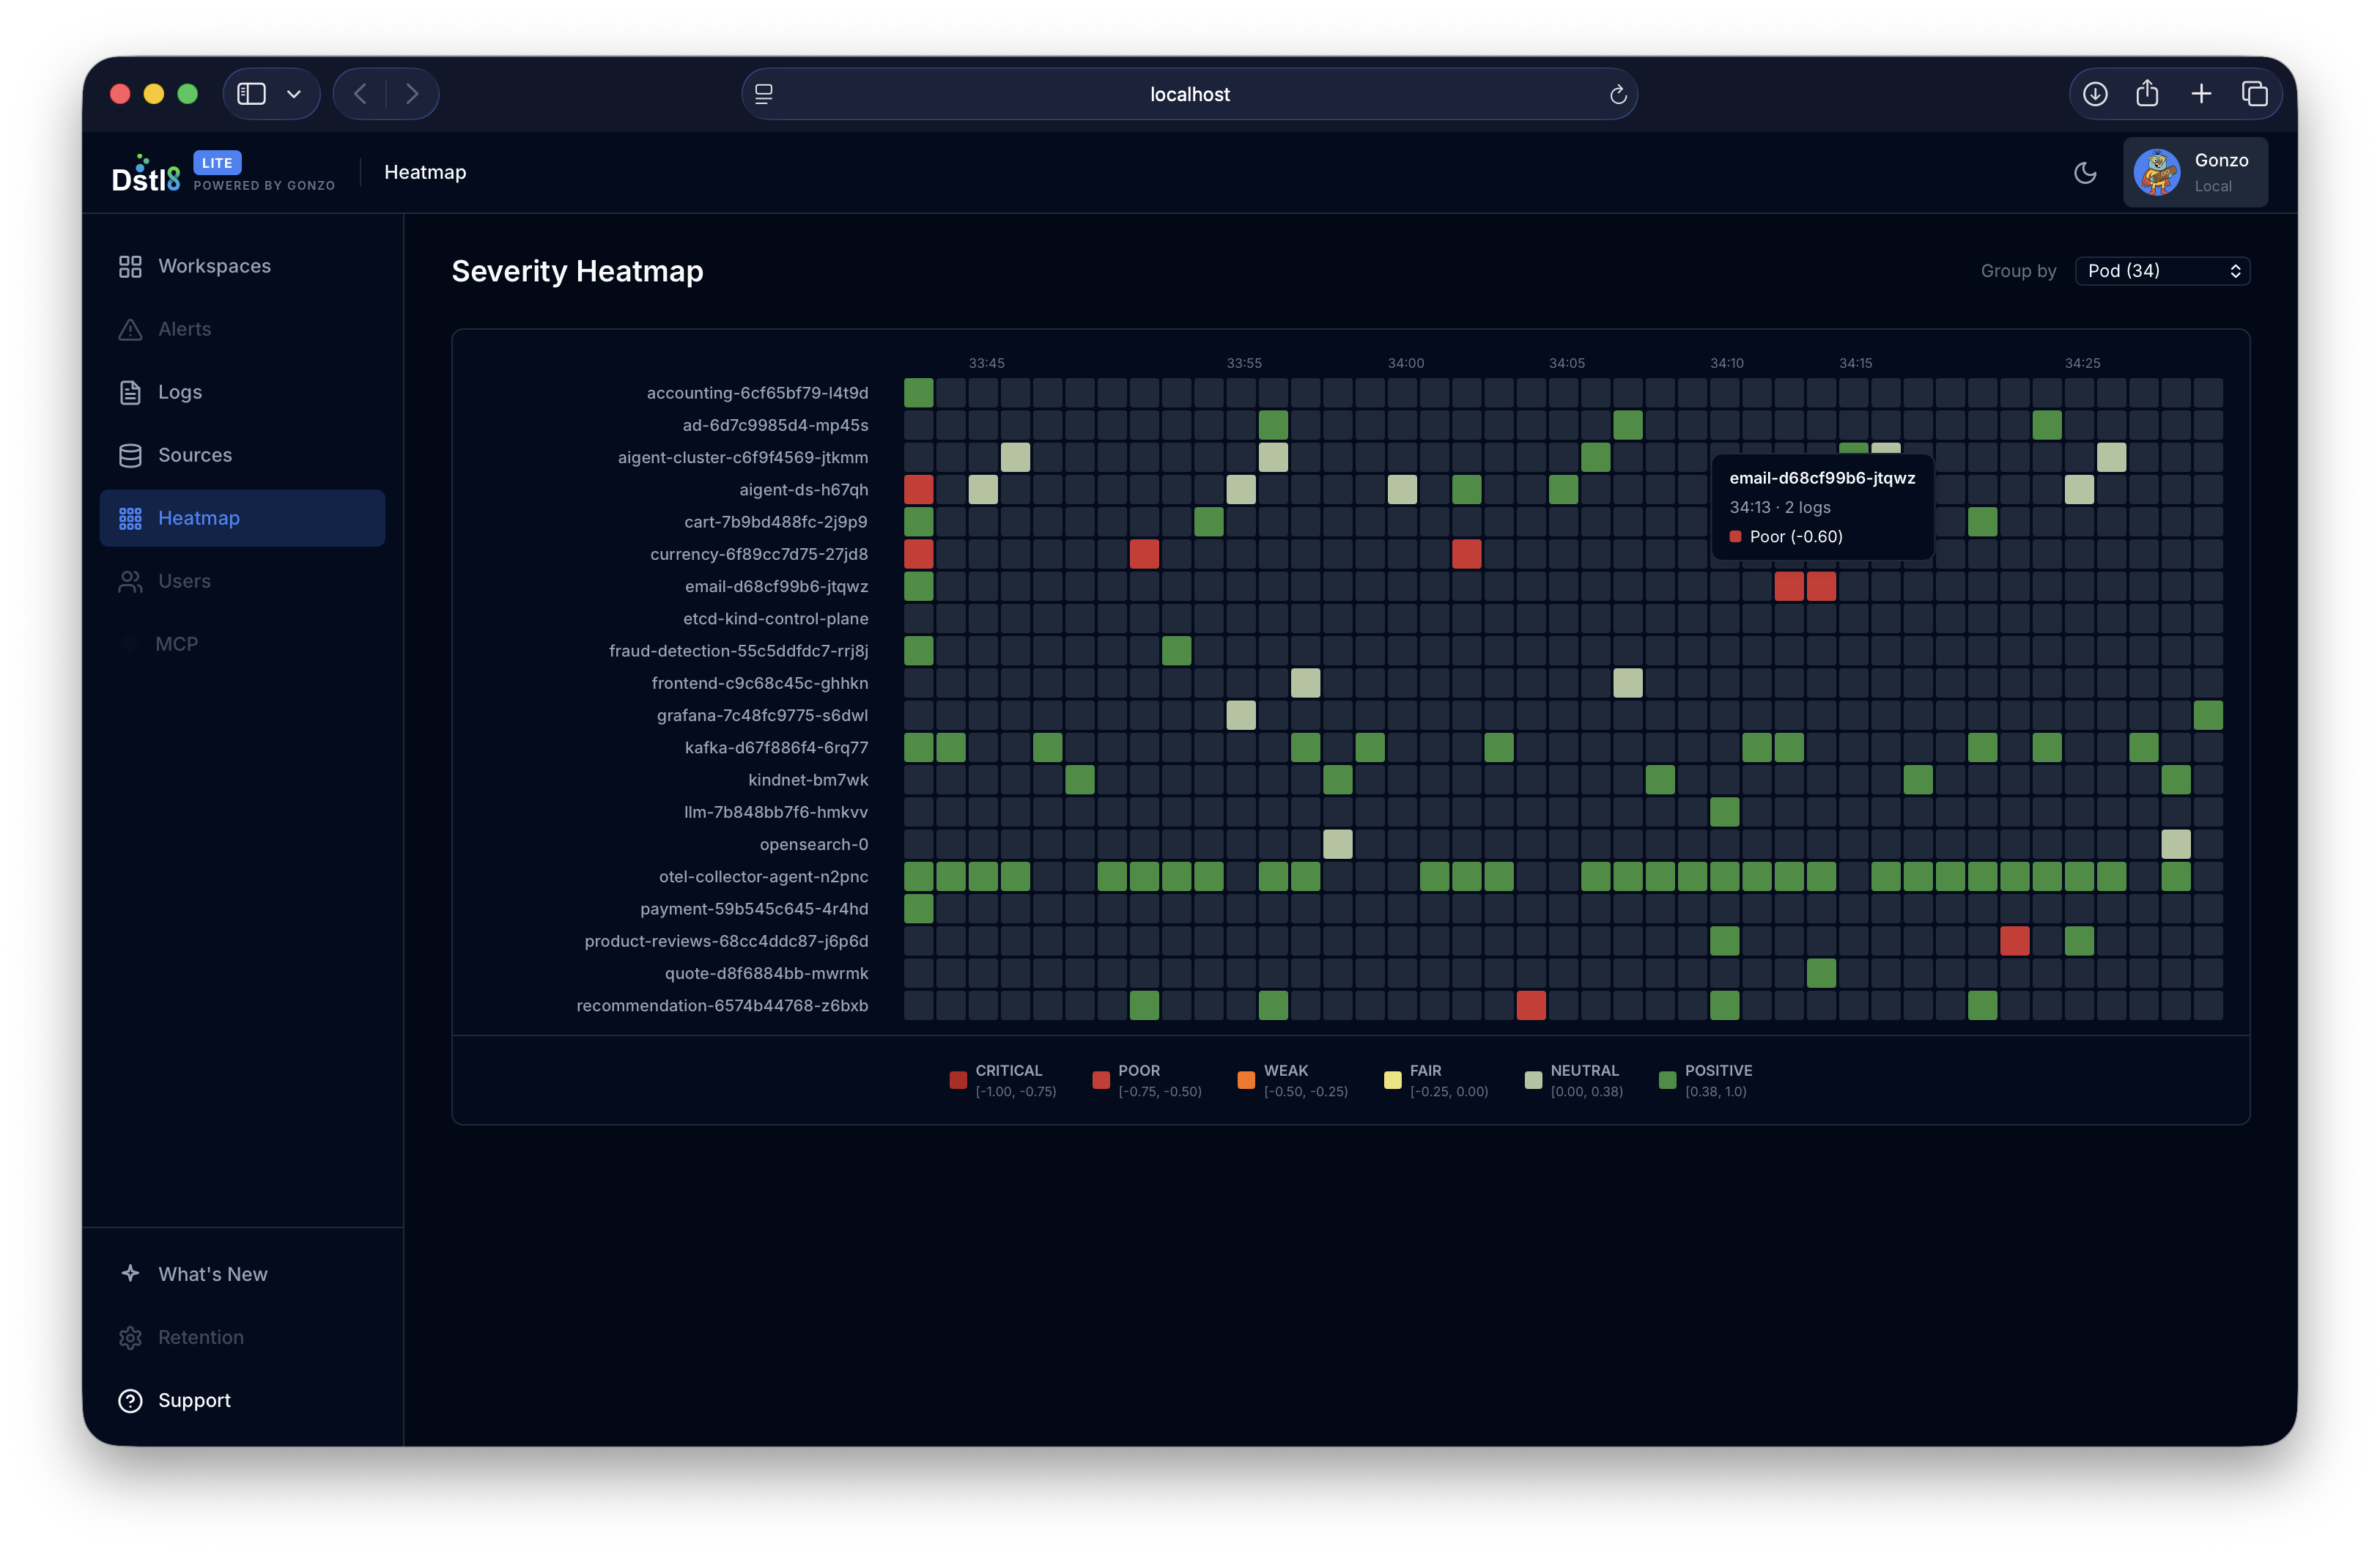
f to open a dedicated fullscreen modal for log browsing with all navigation featuresgo install github.com/control-theory/gonzo/cmd/gonzo@latest
brew install gonzo
Download the latest release for your platform from the releases page.
nix run github:control-theory/gonzo
git clone https://github.com/control-theory/gonzo.git
cd gonzo
make build
This repo includes a Claude Code plugin with a guided log-analysis skill. Inside Claude Code:
/plugin marketplace add control-theory/gonzo
/plugin install gonzo@gonzo
Then ask Claude to "tail my logs", "watch my Vercel logs", or "analyze my Kubernetes logs". The skill detects your deployment platform, installs Gonzo if needed, configures AI analysis, and generates the right pipe command with platform-specific normalizers. See skills/gonzo/ for the skill content.
# Read logs directly from files
gonzo -f application.log

# Read from multiple files
gonzo -f application.log -f error.log -f debug.log

# Use glob patterns to read multiple files
gonzo -f "/var/log/*.log"
gonzo -f "/var/log/app/*.log" -f "/var/log/nginx/*.log"

# Follow log files in real-time (like tail -f)
gonzo -f /var/log/app.log --follow
gonzo -f "/var/log/*.log" --follow

# Analyze logs from stdin (traditional way)
cat application.log | gonzo

# Stream logs directly from Kubernetes clusters
gonzo --k8s-enabled=true --k8s-namespaces=default
gonzo --k8s-enabled=true --k8s-namespaces=production --k8s-namespaces=staging
gonzo --k8s-enabled=true --k8s-selector="app=my-app"

# Stream logs from kubectl (traditional way)
kubectl logs -f deployment/my-app | gonzo

# Follow system logs
tail -f /var/log/syslog | gonzo

# Analyze Docker container logs
docker logs -f my-container 2>&1 | gonzo

# With AI analysis (requires API key)
export OPENAI_API_KEY=sk-your-key-here
gonzo -f application.log --ai-model="gpt-4"

# Press `d` once Gonzo is running to launch the Dstl8.Lite GUI in your browser
Gonzo supports custom log formats through YAML configuration files. This allows you to parse any structured log format without modifying the source code.
Some example custom formats are included in the repo, simply download, copy, or modify as you like! In order for the commands below to work, you must first download them and put them in the Gonzo config directory.
# Use a built-in custom format
gonzo --format=loki-stream -f loki_logs.json

# List available custom formats
ls ~/.config/gonzo/formats/

# Use your own custom format
gonzo --format=my-custom-format -f custom_logs.txt
Custom formats support:
For detailed information on creating custom formats, see the Custom Formats Guide.
Gonzo can receive logs directly via OpenTelemetry Protocol (OTLP) over both gRPC and HTTP:
# Start Gonzo as an OTLP receiver (both gRPC on port 4317 and HTTP on port 4318)
gonzo --otlp-enabled

# Use custom ports
gonzo --otlp-enabled --otlp-grpc-port=5317 --otlp-http-port=5318

# gRPC endpoint: localhost:4317
# HTTP endpoint: http://localhost:4318/v1/logs
Using gRPC:
exporters:
  otlp/gonzo_grpc:
    endpoint: localhost:4317
    tls:
      insecure: true

service:
  pipelines:
    logs:
      receivers: [your_receivers]
      processors: [your_processors]
      exporters: [otlp/gonzo_grpc]
Using HTTP:
exporters:
  otlphttp/gonzo_http:
    endpoint: http://localhost:4318/v1/logs

service:
  pipelines:
    logs:
      receivers: [your_receivers]
      processors: [your_processors]
      exporters: [otlphttp/gonzo_http]
Using gRPC:
from opentelemetry.exporter.otlp.proto.grpc._log_exporter import OTLPLogExporter

exporter = OTLPLogExporter(
    endpoint="localhost:4317",
    insecure=True
)
Using HTTP:
from opentelemetry.exporter.otlp.proto.http._log_exporter import OTLPLogExporter

exporter = OTLPLogExporter(
    endpoint="http://localhost:4318/v1/logs",
)
See examples/send_otlp_logs.py for a complete example.
# Auto-select best available model (recommended) - file input
export OPENAI_API_KEY=sk-your-key-here
gonzo -f logs.json

# Or specify a particular model - file input
export OPENAI_API_KEY=sk-your-key-here
gonzo -f logs.json --ai-model="gpt-4"

# Follow logs with AI analysis
export OPENAI_API_KEY=sk-your-key-here
gonzo -f "/var/log/app.log" --follow --ai-model="gpt-4"

# Using local LM Studio (auto-selects first available)
export OPENAI_API_KEY="local-key"
export OPENAI_API_BASE="http://localhost:1234/v1"
gonzo -f logs.json

# Using Ollama (auto-selects best model like gpt-oss:20b)
export OPENAI_API_KEY="ollama"
export OPENAI_API_BASE="http://localhost:11434"
gonzo -f logs.json --follow

# Using Claude Code (uses sonnet by default)
gonzo --ai-provider=claude-code -f logs.json

# Claude Code with specific model
gonzo --ai-provider=claude-code --ai-model=haiku -f /var/log/app.log --follow

# Traditional stdin approach still works
export OPENAI_API_KEY=sk-your-key-here
cat logs.json | gonzo --ai-model="gpt-4"
Gonzo includes an embedded web dashboard that runs alongside the TUI. It starts automatically on port 5718.
# Gonzo starts the web dashboard automatically
gonzo -f application.log --follow
# Open http://localhost:5718 in your browser

# Use a custom port
gonzo -f application.log --web-port=3000

# Disable the web dashboard
gonzo -f application.log --web-disabled
The dashboard includes:
All data updates in real-time via WebSocket, matching what you see in the TUI.
| Key/Mouse | Action |
|---|---|
Tab / Shift+Tab |
Navigate between panels |
Mouse Click |
Click on any section to switch to it |
↑/↓ or k/j |
Move selection up/down |
Mouse Wheel |
Scroll up/down to navigate selections |
←/→ or h/l |
Horizontal navigation |
Enter |
View log details or open analysis modal (Counts section) |
ESC |
Close modal/cancel |
| Key | Action |
|---|---|
Space |
Pause/unpause entire dashboard |
/ |
Enter filter mode (regex supported) |
s |
Search and highlight text in logs |
d |
Launch Dstl8.Lite GUI in browser |
Ctrl+f |
Open severity filter modal |
Ctrl+k |
Open Kubernetes filter modal (k8s mode) |
f |
Open fullscreen log viewer modal |
c |
Toggle columns (Host/Service ↔ Namespace/Pod in k8s mode) |
C |
Configure visible columns (column picker) |
r |
Reset all data (manual reset) |
u / U |
Cycle update intervals (forward/backward) |
i |
AI analysis (in detail view) |
m |
Switch AI model (shows available models) |
? / h |
Show help |
q / Ctrl+C |
Quit |
| Key | Action |
|---|---|
Home |
Jump to top of log buffer (stops auto-scroll) |
End |
Jump to latest logs (resumes auto-scroll) |
PgUp / PgDn |
Navigate by pages (10 entries at a time) |
↑/↓ or k/j |
Navigate entries with smart auto-scroll |
| Key | Action |
|---|---|
c |
Start chat with AI about current log |
Tab |
Switch between log details and chat pane |
m |
Switch AI model (works in modal too) |
The severity filter modal (Ctrl+f) provides fine-grained control over which log levels to display:
| Key | Action |
|---|---|
↑/↓ or k/j |
Navigate severity options |
Space |
Toggle selected severity level on/off |
Enter |
Apply filter and close modal (or select All/None) |
ESC |
Cancel changes and close modal |
Features:
The column picker modal (C key) lets you configure which columns are visible in the log viewer:
| Key | Action |
|---|---|
↑/↓ or k/j |
Navigate column options |
Space |
Toggle selected column on/off |
Enter |
Apply changes and close modal |
ESC |
Discard changes and close modal |
Features:
(N/M active) indicating how many columns are currently enabledPress Enter on the Counts section to open a comprehensive analysis modal featuring:
The modal uses the same receive time architecture as the main dashboard, ensuring consistent and reliable visualization regardless of log timestamp accuracy or clock skew issues.
gonzo [flags]
gonzo [command]

Commands:
  version     Print version information
  help        Help about any command
  completion  Generate shell autocompletion

Flags:
  -f, --file stringArray           Files or file globs to read logs from (can specify multiple)
  --follow                         Follow log files like 'tail -f' (watch for new lines in real-time)
  --format string                  Log format to use (auto-detect if not specified). Can be: otlp, json, text, or a custom format name
  -u, --update-interval duration   Dashboard update interval (default: 1s)
  -b, --log-buffer int             Maximum log entries to keep (default: 1000)
  -m, --memory-size int            Maximum frequency entries (default: 10000)
  --ai-provider string             AI provider to use: 'openai' (default), 'claude-code'
  --ai-model string                AI model for analysis (auto-selects best available if not specified)
  -s, --skin string                Color scheme/skin to use (default, or name of a skin file)
  --stop-words strings             Additional stop words to filter out from analysis (adds to built-in list)

Web Dashboard Flags:
  --web-port int                   Port for the Dstl8 Lite web dashboard (default: 5718)
  --web-disabled                   Disable the web dashboard

Kubernetes Flags:
  --k8s-enabled=true               Enable Kubernetes log streaming mode
  --k8s-namespaces stringArray      Kubernetes namespace(s) to watch (can specify multiple, default: all)
  --k8s-selector string            Kubernetes label selector for filtering pods
  --k8s-tail int                   Number of previous log lines to retrieve (default: 10)
  --k8s-since int                  Only return logs newer than relative duration in seconds
  --k8s-kubeconfig string          Path to kubeconfig file (default: $HOME/.kube/config)
  --k8s-context string             Kubernetes context to use

  -t, --test-mode                  Run without TTY for testing
  -v, --version                    Print version information
  --config string                  Config file (default: $HOME/.config/gonzo/config.yml)
  -h, --help                       Show help message
Create ~/.config/gonzo/config.yml for persistent settings:
# File input configuration
files:
  - "/var/log/app.log"
  - "/var/log/error.log"
  - "/var/log/*.log" # Glob patterns supported
follow: true # Enable follow mode (like tail -f)

# Update frequency for dashboard refresh
update-interval: 2s

# Buffer sizes
log-buffer: 2000
memory-size: 15000

# UI customization
skin: dracula # Choose from: default, dracula, nord, monokai, github-light, etc.

# Additional stop words to filter from analysis
stop-words:
  - "log"
  - "message"
  - "debug"

# Development/testing
test-mode: false

# AI configuration
ai-provider: "openai"  # Options: "openai" (default), "claude-code"
ai-model: "gpt-4"

# Web dashboard (Dstl8 Lite)
web-port: 5718       # Port for the web dashboard
web-disabled: false   # Set to true to disable
See examples/config.yml for a complete configuration example with detailed comments.
Gonzo supports multiple AI providers for intelligent log analysis. Configure using command line flags and environment variables. You can switch between available models at runtime using the m key.
# Set your API key
export OPENAI_API_KEY="sk-your-actual-key-here"

# Auto-select best available model (recommended)
cat logs.json | gonzo

# Or specify a particular model
cat logs.json | gonzo --ai-model="gpt-4"
# 1. Install Claude Code CLI
# Download from https://claude.ai/download

# 2. Authenticate (if not already done)
claude auth login

# 3. Run Gonzo with Claude Code (uses sonnet by default)
gonzo --ai-provider=claude-code -f application.log

# Specify a model
gonzo --ai-provider=claude-code --ai-model=sonnet -f logs.json  # Default, balanced
gonzo --ai-provider=claude-code --ai-model=haiku -f logs.json   # Faster, efficient
gonzo --ai-provider=claude-code --ai-model=opus -f logs.json    # Most capable

# Works with all input methods
gonzo --ai-provider=claude-code --k8s-enabled
cat logs.json | gonzo --ai-provider=claude-code
tail -f /var/log/app.log | gonzo --ai-provider=claude-code --ai-model=haiku

# Run Claude in a container (Podman/Docker)
export GONZO_CLAUDE_PATH="podman exec -it claude-container claude"
gonzo --ai-provider=claude-code -f logs.json

export GONZO_CLAUDE_PATH="docker exec -it my-claude-container claude"
gonzo --ai-provider=claude-code --ai-model=haiku -f /var/log/app.log --follow
Available Models:
sonnet (default) - Claude Sonnet, balanced performance and capabilityhaiku - Fastest and most efficient, best for high-volume logsopus - Most capable, best for complex analysisNotes:
OPENAI_API_KEY environment variable is not needed.GONZO_CLAUDE_PATH to specify a custom path or command (useful for running Claude in containers).# 1. Start LM Studio server with a model loaded # 2. Set environment variables (IMPORTANT: include /v1 in URL) export OPENAI_API_KEY="local-key" export OPENAI_API_BASE="http://localhost:1234/v1" # Auto-select first available model (recommended) cat logs.json | gonzo # Or specify the exact model name from LM Studio cat logs.json | gonzo --ai-model="openai/gpt-oss-120b"
# 1. Start Ollama: ollama serve
# 2. Pull a model: ollama pull gpt-oss:20b
# 3. Set environment variables (note: no /v1 suffix needed)
export OPENAI_API_KEY="ollama"
export OPENAI_API_BASE="http://localhost:11434"

# Auto-select best model (prefers gpt-oss, llama3, mistral, etc.)
cat logs.json | gonzo

# Or specify a particular model
cat logs.json | gonzo --ai-model="gpt-oss:20b"
cat logs.json | gonzo --ai-model="llama3"
# For any OpenAI-compatible API endpoint
export OPENAI_API_KEY="your-api-key"
export OPENAI_API_BASE="https://api.your-provider.com/v1"
cat logs.json | gonzo --ai-model="your-model-name"
Once Gonzo is running, you can switch between available AI models without restarting:
m anywhere in the interface to open the model selection modalThe model selection modal shows:
Note: Model switching requires the AI service to be properly configured and running. The modal will only appear if models are available from your AI provider.
Provider-Specific Behavior:
When you don't specify the --ai-model flag, Gonzo automatically selects the best available model:
Selection Priority:
gpt-4 → gpt-3.5-turbo → first availablesonnet (haiku and opus also available)gpt-oss:20b → llama3 → mistral → codellama → first availableBenefits:
m keyExample: Instead of gonzo --ai-model="llama3", simply run gonzo and it will auto-select llama3 if available.
LM Studio Issues:
--ai-model="openai/model-name"/v1 in base URL: http://localhost:1234/v1curl http://localhost:1234/v1/modelsOllama Issues:
ollama serveollama listcurl http://localhost:11434/api/tagshttp://localhost:11434 (no /v1 suffix)gpt-oss:20b, llama3:8bOpenAI Issues:
Claude Code Issues:
claude --versionclaude auth loginclaude -p "test prompt"sonnet (default), haiku, opus--ai-provider=claude-code flag when running Gonzo| Variable | Description |
|---|---|
OPENAI_API_KEY |
API key for AI analysis (required for OpenAI-based AI features) |
OPENAI_API_BASE |
Custom API endpoint (default: https://api.openai.com/v1) |
GONZO_AI_PROVIDER |
AI provider to use ('openai' or 'claude-code') |
GONZO_CLAUDE_PATH |
Custom path/command for Claude CLI (e.g., for container execution) |
GONZO_FILES |
Comma-separated list of files/globs to read (equivalent to -f flags) |
GONZO_FOLLOW |
Enable follow mode (true/false) |
GONZO_UPDATE_INTERVAL |
Override update interval |
GONZO_LOG_BUFFER |
Override log buffer size |
GONZO_MEMORY_SIZE |
Override memory size |
GONZO_AI_MODEL |
Override default AI model |
GONZO_WEB_PORT |
Override web dashboard port (default: 5718) |
GONZO_WEB_DISABLED |
Disable web dashboard (true/false) |
GONZO_TEST_MODE |
Enable test mode |
NO_COLOR |
Disable colored output |
Enable shell completion for better CLI experience:
# Bash
source <(gonzo completion bash)

# Zsh
source <(gonzo completion zsh)

# Fish
gonzo completion fish | source

# PowerShell
gonzo completion powershell | Out-String | Invoke-Expression
For permanent setup, save the completion script to your shell's completion directory.
By leveraging K9s plugin system Gonzo integrates seamlessly with K9s for real-time Kubernetes log analysis.
Add this plugin to your $XDG_CONFIG_HOME/k9s/plugins.yaml file:
plugins:
  gonzo:
    shortCut: Ctrl-L
    description: "Gonzo log analysis"
    scopes:
      - po
      - deploy
      - sts
      - ds
      - svc
      - job
      - cj
    command: sh
    background: false
    args:
      - -c
      - "kubectl logs -f --tail=0 $RESOURCE_NAME/$NAME -n $NAMESPACE --context $CONTEXT | gonzo"
⚠️ NOTE: on
macOSalthough it is not required, definingXDG_CONFIG_HOME=~/.configis recommended in order to maintain consistency with Linux configuration practices.
ctrl-lGonzo is built with:
The architecture follows a clean separation with a shared analysis engine:
cmd/gonzo/              # Main application entry
internal/
├── engine/            # Shared analysis engine (feeds TUI and web)
├── tui/               # Terminal UI implementation
├── web/               # Dstl8 Lite web dashboard (embedded React)
├── analyzer/          # Log analysis engine
├── memory/            # Frequency tracking
├── otlplog/           # OTLP format handling
└── ai/                # AI integration
web/                    # React frontend source (Vite + TypeScript)
# Quick build (includes web dashboard)
make build

# Build web dashboard only
make web-deps    # Install npm dependencies
make web-build   # Build React app

# Run tests
make test

# Build for all platforms
make cross-build

# Development mode (format, vet, test, build)
make dev
# Run unit tests
make test

# Run with race detection
make test-race

# Integration tests
make test-integration

# Test with sample data
make demo
Gonzo supports beautiful, customizable color schemes to match your terminal environment and personal preferences.
Be sure you download and place in the Gonzo config directory so Gonzo can find them.
# Use a dark theme
gonzo --skin=dracula
gonzo --skin=nord
gonzo --skin=monokai

# Use a light theme
gonzo --skin=github-light
gonzo --skin=solarized-light
gonzo --skin=vs-code-light

# Use Control Theory branded themes
gonzo --skin=controltheory-light    # Light theme
gonzo --skin=controltheory-dark     # Dark theme
Dark Themes 🌙: default, controltheory-dark, dracula, gruvbox, monokai, nord, solarized-dark
Light Themes ☀️: controltheory-light, github-light, solarized-light, vs-code-light, spring
See SKINS.md for complete documentation on:
We love contributions! Please see CONTRIBUTING.md for details.
git checkout -b feature/amazing-feature)git commit -m 'Add amazing feature')git push origin feature/amazing-feature)This project is licensed under the MIT License - see the LICENSE file for details.
Found a bug? Please open an issue with:
If you find this project useful, please consider giving it a star! It helps others discover the tool.
Made with ❤️ by ControlTheory and the Gonzo community
more like this
🧠 A simple command-line client for the Perplexity API. Ask questions and receive answers directly from the terminal! 🚀🚀🚀
YiMao · 云海求片助手 — 双核心 Telegram 影视求片机器人。订阅模式:TMDB 智能搜索一键订阅 / 趣味求片模式:AI 生成五层地狱闯关,通关解锁优先求片。深度集成 MoviePilot + Emby/Jellyfin。…
search projects, people, and tags