prompt-to-puzzle
A web app that dynamically generates playable 'Spot the Difference' games from a single text prompt using a multimodal…
TypeScript★ 53
Create Generative Art with R
 cutterkom
git clone https://github.com/cutterkom/generativeart.gitcutterkom/generativeartThis package collects more and more stars here on Github and is widely used for NFTs. Just browse on NFT platforms - it won't take you long to discover patterns be that might be decandents of this repository.
I would like to clarify: I am not a fan of Blockchain, NFT and Web3.
Why? Read this text: "The Third Web" by @tante.
Create Generative Art with R.
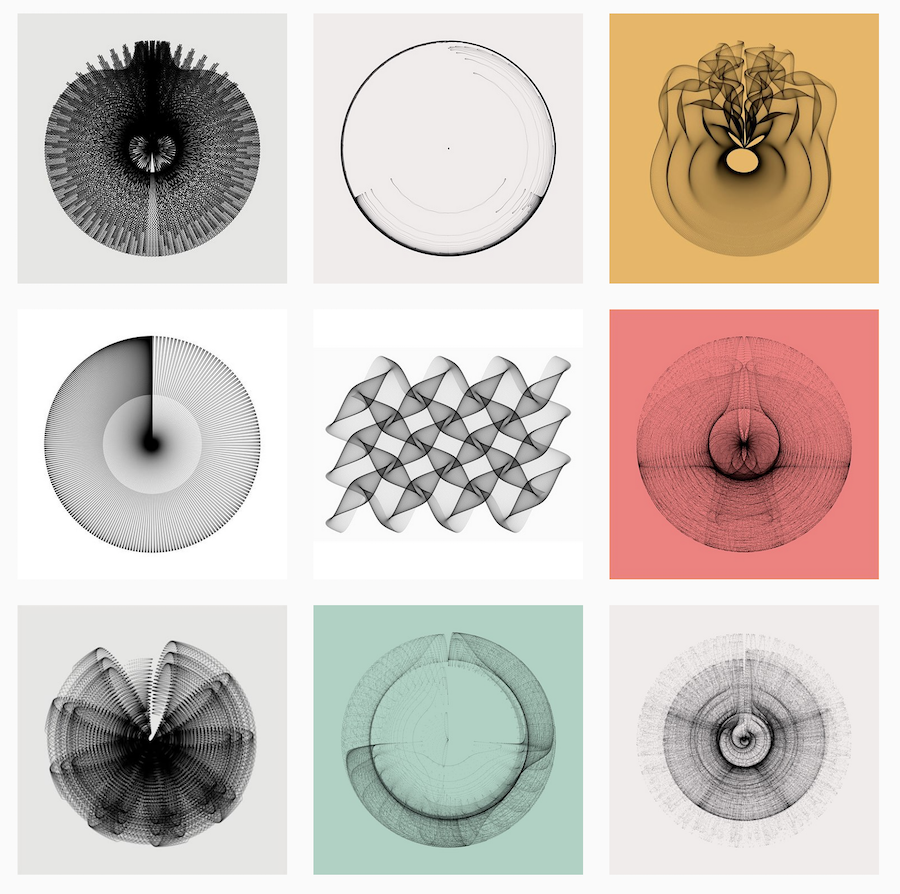
One overly simple but useful definition is that generative art is art programmed using a computer that intentionally introduces randomness as part of its creation process. -- Why Love Generative Art? - Artnome
The R package generativeart let's you create images based on many thousand points.
The position of every single point is calculated by a formula, which has random parameters.
Because of the random numbers, every image looks different.
In order to make an image reproducible, generative art implements a log file that saves the file_name, the seed and the formula.
You can install the package with the devtools package directly from Github:
devtools::install_github("cutterkom/generativeart")
generativeart uses the packages ggplot2, magrittr, purrr and dplyr.
The package works with a specific directory structure that fits my needs best.
The first step is to create it with setup_directories().
All images are saved by default in img/everything/. I use img/handpicked/ to choose the best ones.
In logfile/ you will find a csv file that saves the file_name, the seed and the used formula.
library(generativeart)

# set the paths
IMG_DIR <- "img/"
IMG_SUBDIR <- "everything/"
IMG_SUBDIR2 <- "handpicked/"
IMG_PATH <- paste0(IMG_DIR, IMG_SUBDIR)

LOGFILE_DIR <- "logfile/"
LOGFILE <- "logfile.csv"
LOGFILE_PATH <- paste0(LOGFILE_DIR, LOGFILE)

# create the directory structure
generativeart::setup_directories(IMG_DIR, IMG_SUBDIR, IMG_SUBDIR2, LOGFILE_DIR)

# include a specific formula, for example:
my_formula <- list(
  x = quote(runif(1, -1, 1) * x_i^2 - sin(y_i^2)),
  y = quote(runif(1, -1, 1) * y_i^3 - cos(x_i^2))
)

# call the main function to create five images with a polar coordinate system
generativeart::generate_img(formula = my_formula, nr_of_img = 5, polar = TRUE, filetype = "png", color = "black", background_color = "white")
nr_of_img.polar = TRUE or polar = FALSEcolor = 'black' and background_color = 'hotpink'png, the alternatives are defined by the device options of ggplot::ggsave().list()It is a good idea to use the sine and cosine in the formula, since it guarantees nice shapes, especially when combined with a polar coordinate system. One simple example:
my_formula <- list(
  x = quote(runif(1, -1, 1) * x_i^2 - sin(y_i^2)),
  y = quote(runif(1, -1, 1) * y_i^3 - cos(x_i^2))
)

generativeart::generate_img(formula = my_formula, nr_of_img = 5, polar = TRUE, color = "black", background_color = "white")
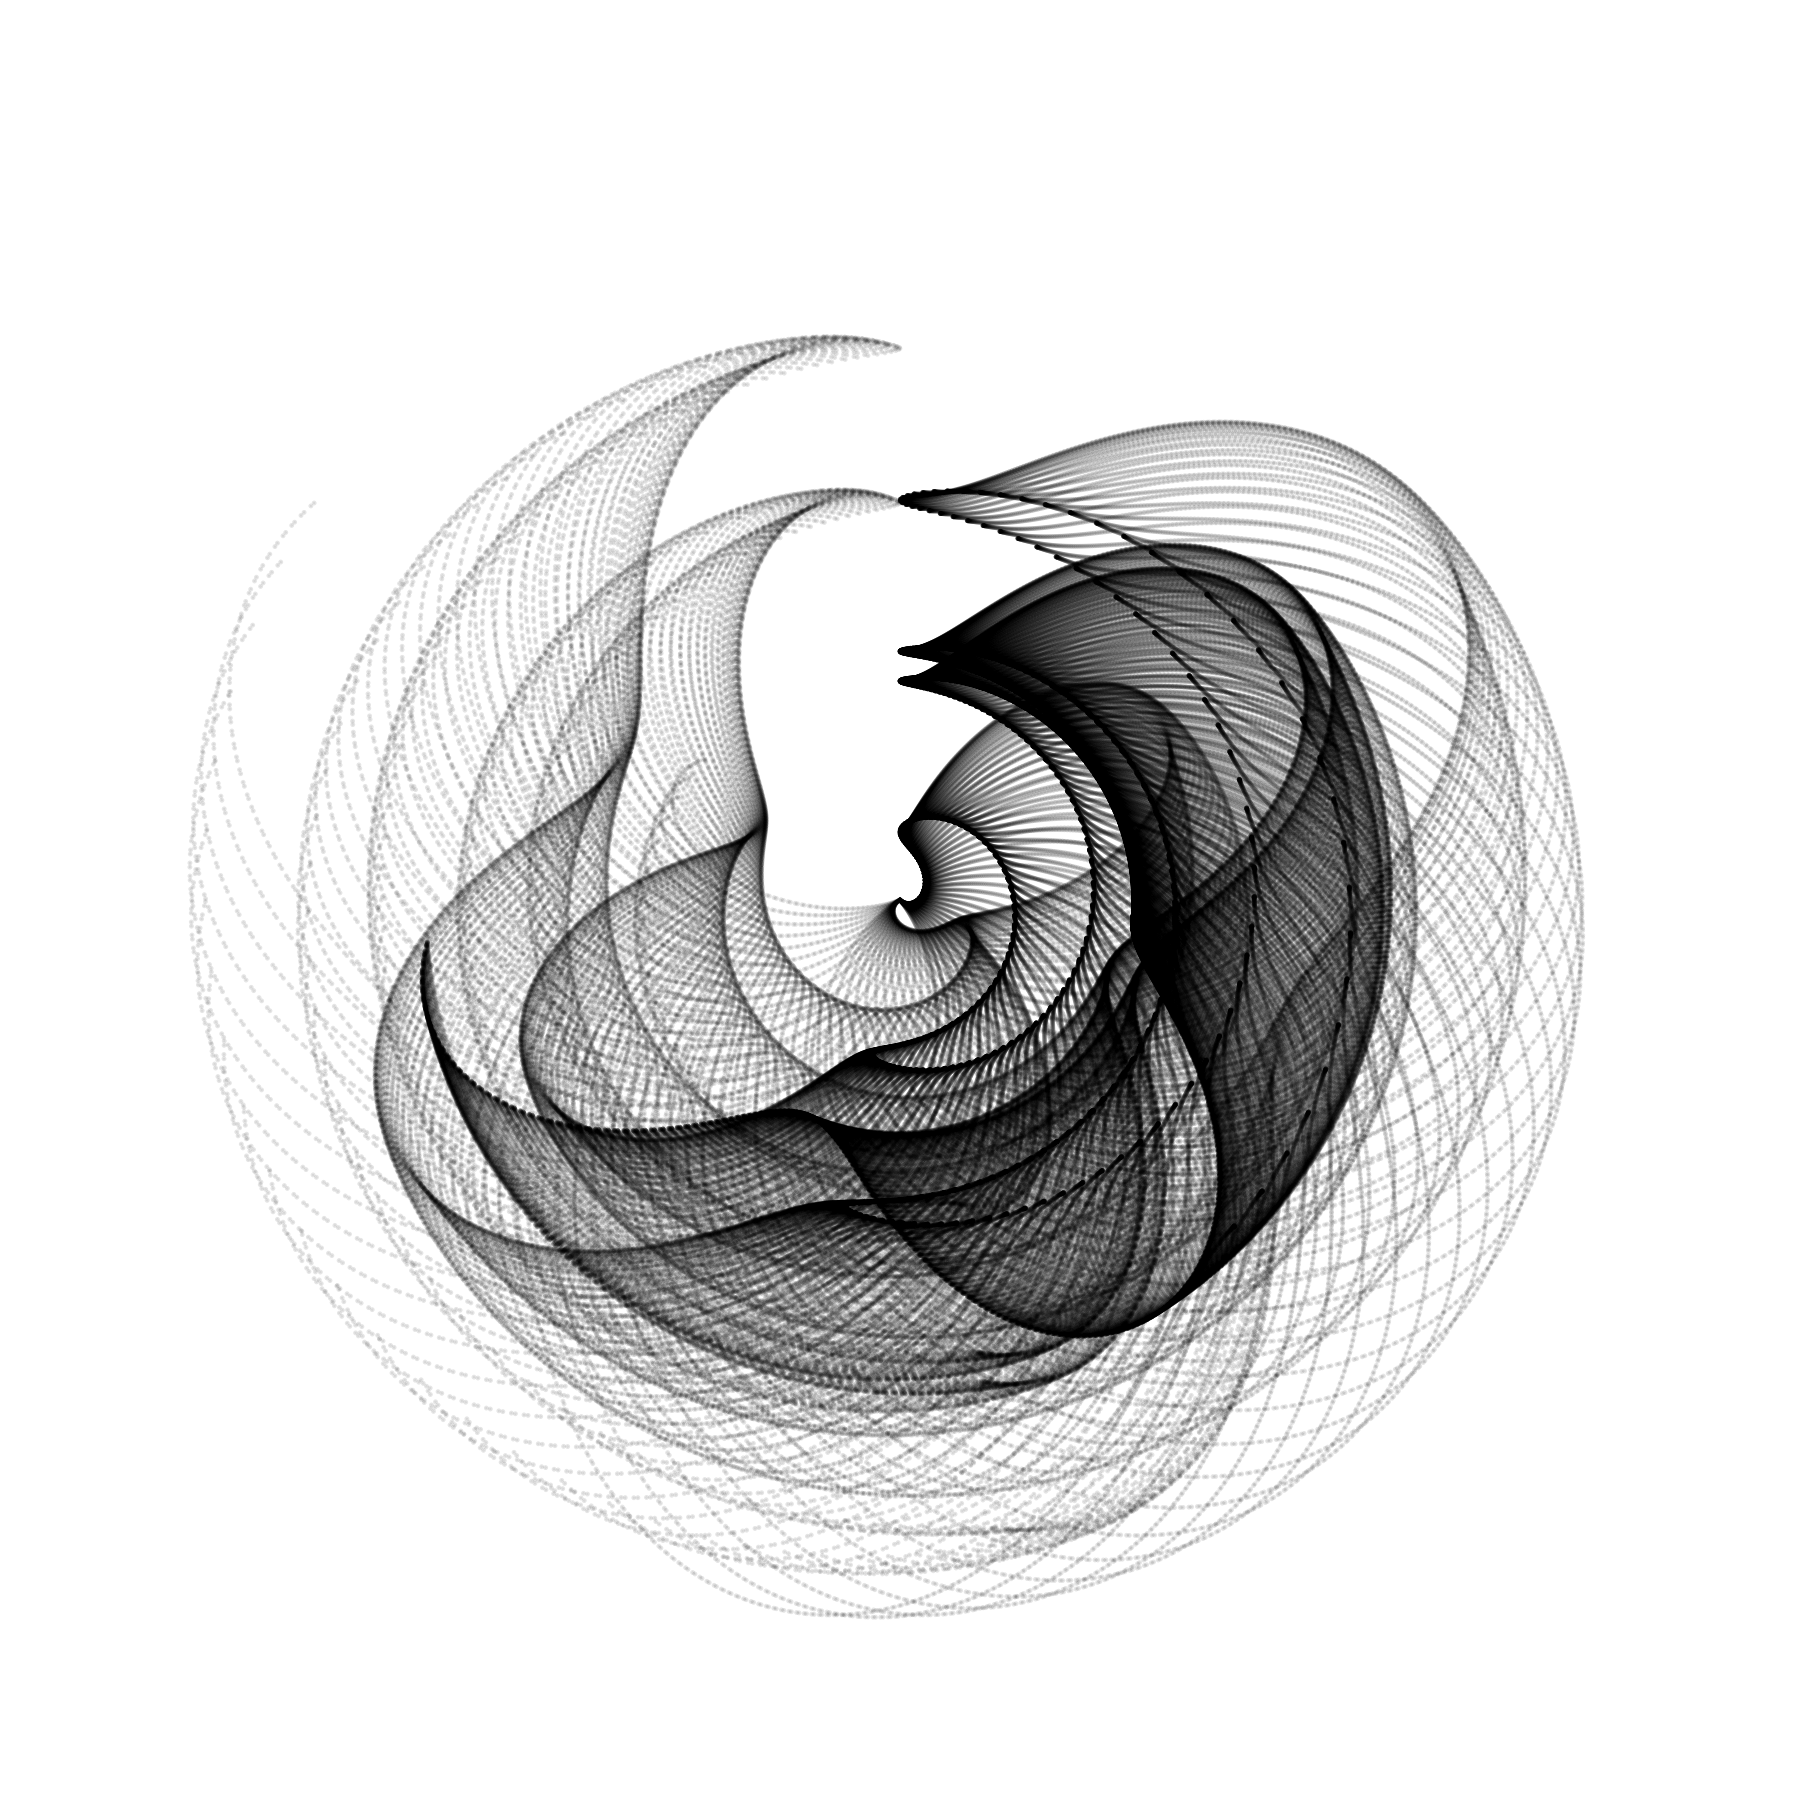
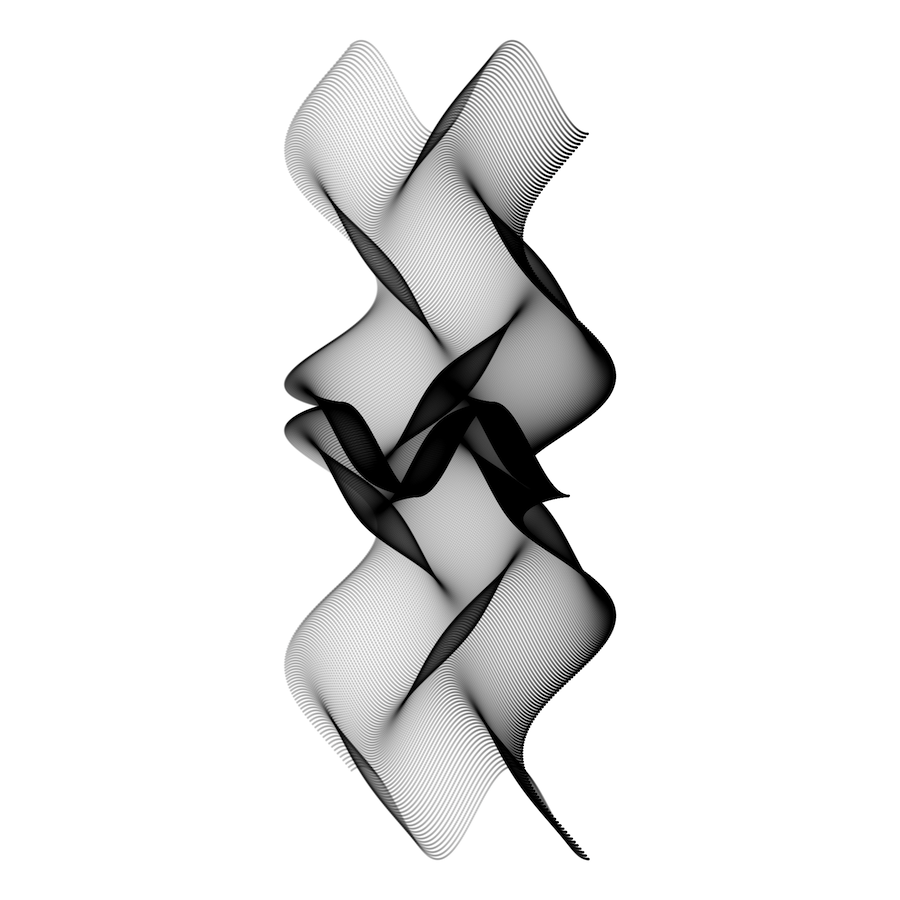
Two possible images:
seed = 1821, polar = TRUE:
seed = 5451, polar = FALSE:
The corresponding log file looks like that:
| file_name | seed | formula_x | formula_y |
|---|---|---|---|
| 2018-11-16-17-13_seed_1821.png | 1821 | runif(1, -1, 1) * x_i^2 - sin(y_i^2) | runif(1, -1, 1) * y_i^3 - cos(x_i^2) |
| 2018-11-16-17-12_seed_5451.png | 5451 | runif(1, -1, 1) * x_i^2 - sin(y_i^2) | runif(1, -1, 1) * y_i^3 - cos(x_i^2) |
The basic concept is heavily inspired by Fronkonstin's great blog.
more like this
A web app that dynamically generates playable 'Spot the Difference' games from a single text prompt using a multimodal…
L5 is a fun, fast, cross-platform, and lightweight implementation of the Processing API in Lua.
search projects, people, and tags