iterated-dynamics
Iterated Dynamics is a fractal renderer with support for many fractal types and extensive context-sensitive help.
C++★ 50
Model, simulate, and visualize discrete nonlinear dynamical systems, chaos, and fractals
 gboeing

Python package for modeling, simulating, visualizing, and animating discrete nonlinear dynamical systems and chaos
Pynamical uses pandas, numpy, and numba for fast simulation, and matplotlib for visualizations and animations to explore system behavior.
Pynamical comes packaged with the logistic map, the Singer map, and the cubic map predefined. The models may be run with a range of parameter values over a set of time steps, and the resulting numerical output is returned as a pandas DataFrame. Pynamical can then visualize this output in various ways, including with bifurcation diagrams, two-dimensional phase diagrams, three-dimensional phase diagrams, and cobweb plots.
Citation info: Boeing, G. 2016. "Visual Analysis of Nonlinear Dynamical Systems: Chaos, Fractals, Self-Similarity and the Limits of Prediction." Systems, 4 (4), 37. doi:10.3390/systems4040037.
You can install pynamical with conda:
conda config --prepend channels conda-forge
conda create -n pynamical --strict-channel-priority jupyterlab pynamical
Alternatively, you can run pynamical + Jupyter directly from its Docker container, or you can install it with pip.
Available on readthedocs.
First import pynamical. Then simulate some model and visualize its bifurcation diagram in just 2 lines of code:
from pynamical import logistic_map, simulate, bifurcation_plot
pops = simulate(model=logistic_map, num_gens=100, rate_min=0, rate_max=4, num_rates=1000, num_discard=100)
bifurcation_plot(pops)
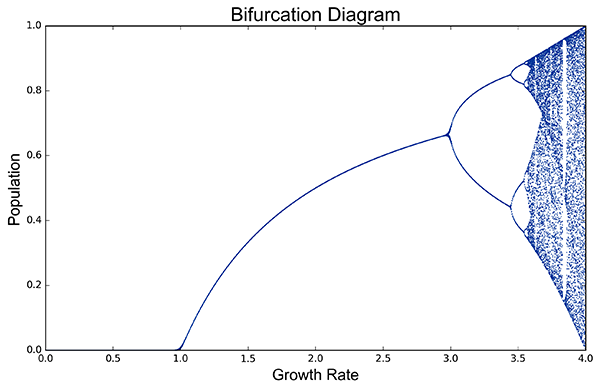
Zoom into a slice of this bifurcation diagram to see its fractal structure:
pops = simulate(model=logistic_map, num_gens=100, rate_min=3.7, rate_max=3.9, num_rates=1000, num_discard=100)
bifurcation_plot(pops, xmin=3.7, xmax=3.9)
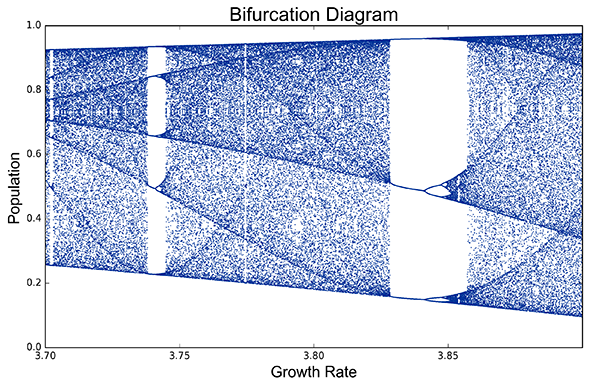
Plot a two-dimensional phase diagram of the logistic map:
from pynamical import phase_diagram
pops = simulate(model=logistic_map, num_gens=4000, rate_min=3.6, rate_max=4.0, num_rates=50, num_discard=100)
phase_diagram(pops, xmin=0.25, xmax=0.75, ymin=0.8, ymax=1.01, size=7, color='viridis')
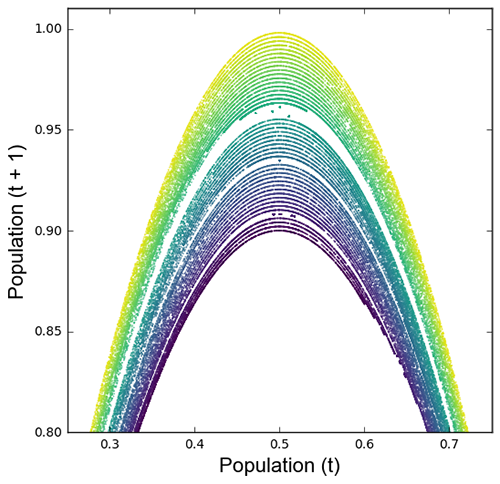
Or a three-dimensional phase diagram of the cubic map:
from pynamical import cubic_map, phase_diagram_3d
pops = simulate(model=cubic_map, num_gens=3000, rate_min=3.5, num_rates=30, num_discard=100)
phase_diagram_3d(pops, xmin=-1, xmax=1, ymin=-1, ymax=1, zmin=-1, zmax=1, alpha=0.2, color='viridis', azim=330)
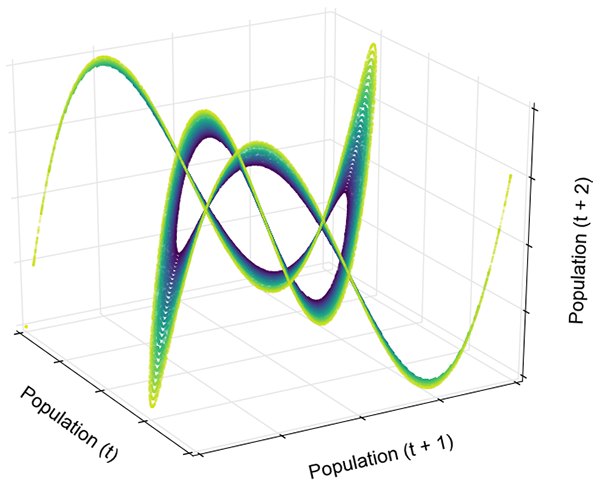
Animate the 3D phase diagram of the logistic map to reveal the strange attractor's structure:
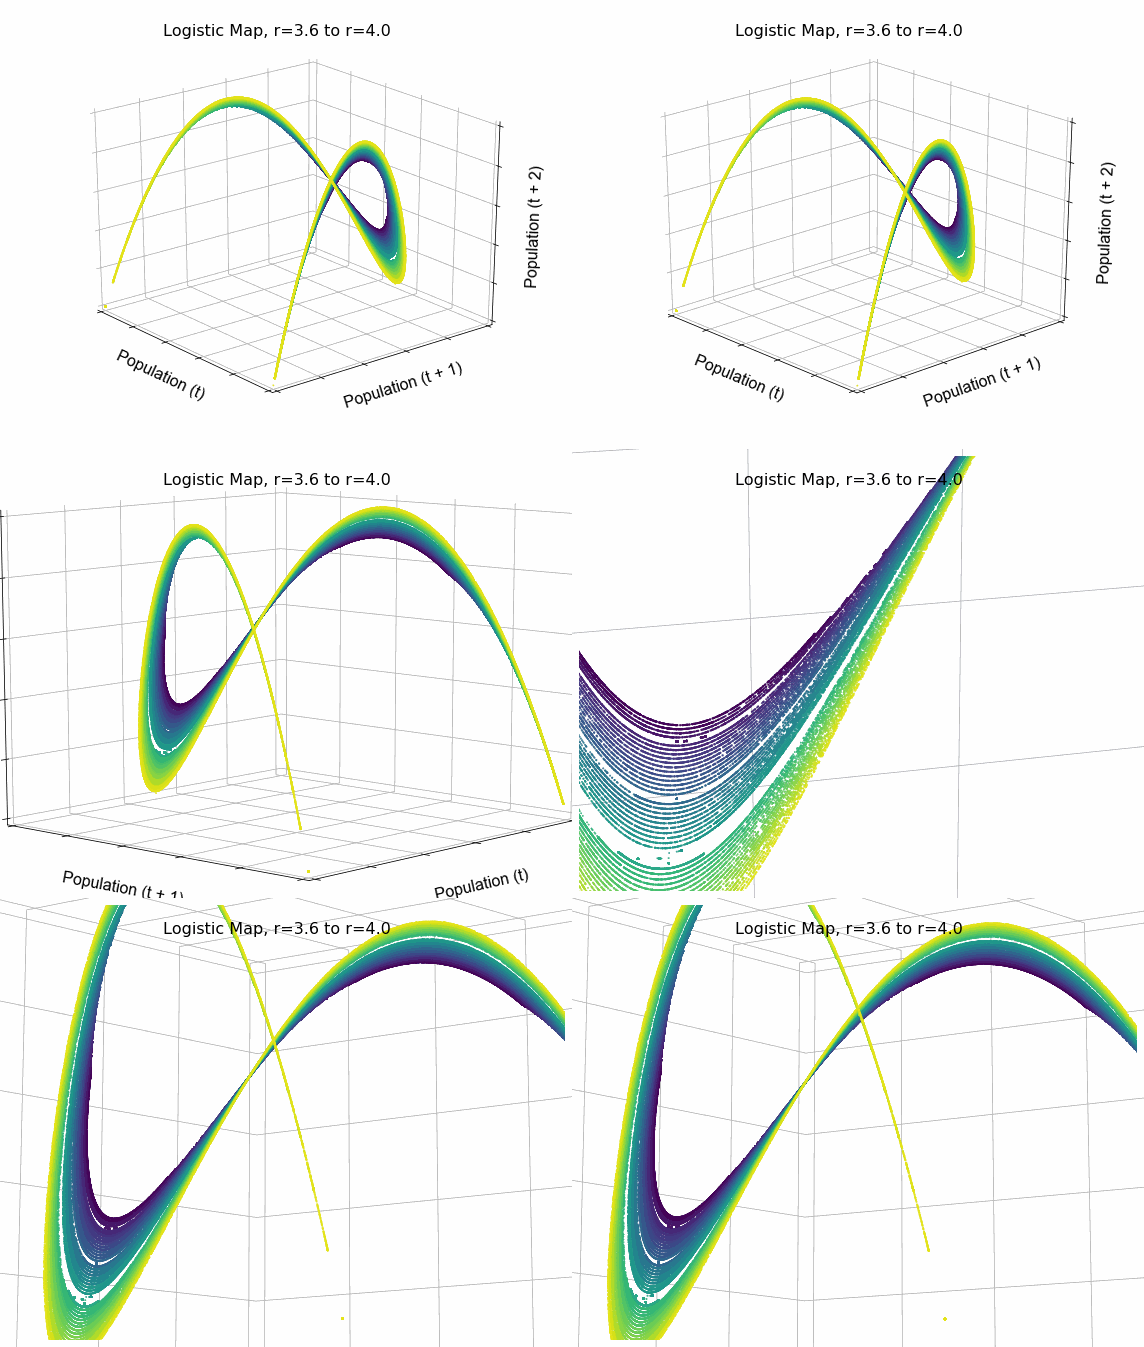
Animate a cobweb plot of the logistic map's parameter space to explore sensitivity and behavior:
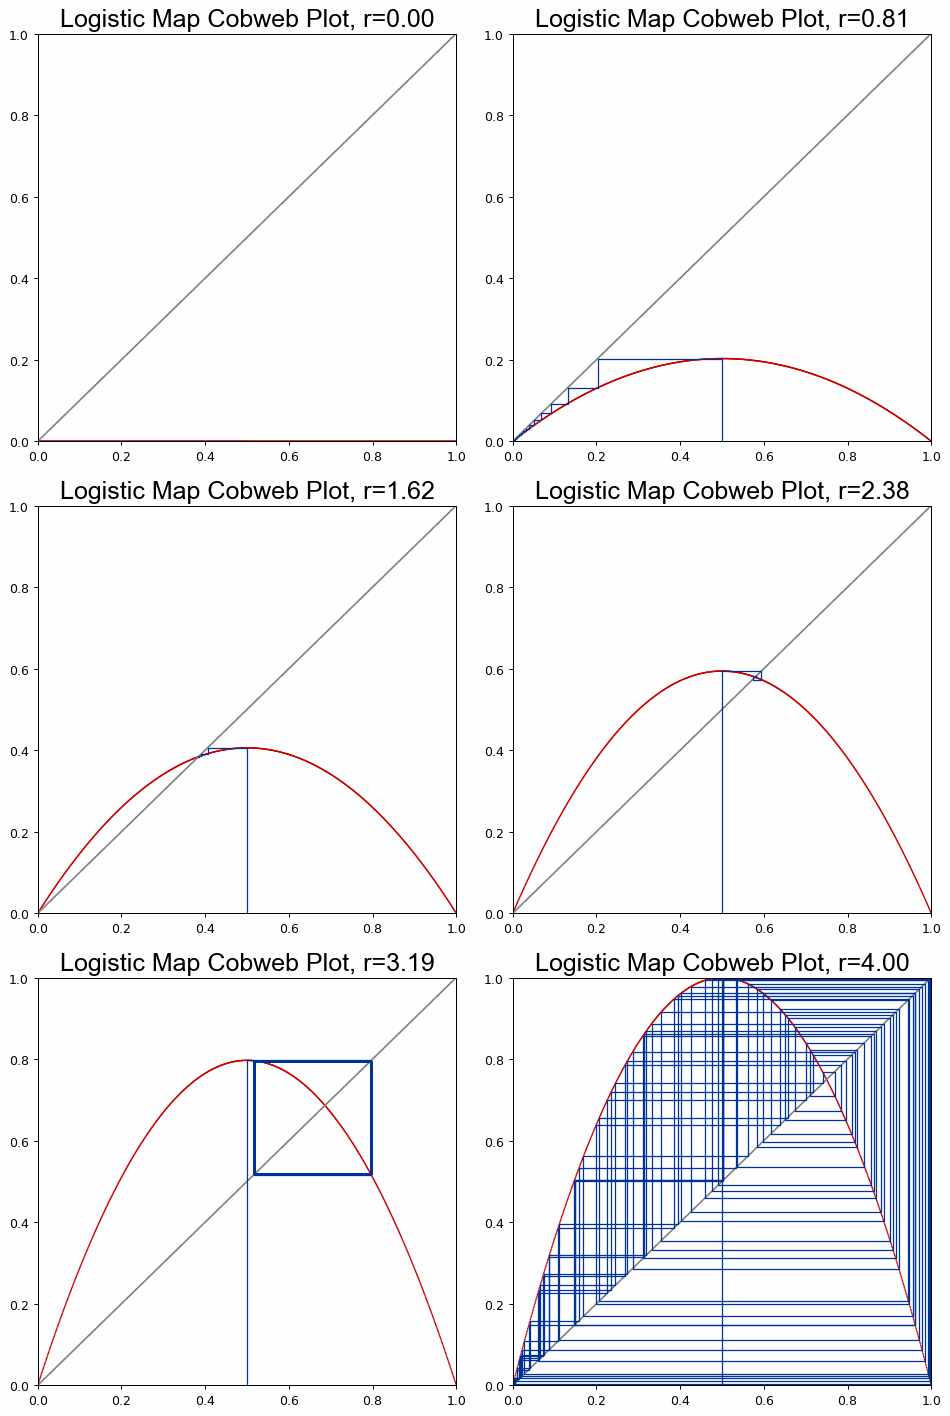
Or define your own model and simulate it with pynamical.
more like this
Iterated Dynamics is a fractal renderer with support for many fractal types and extensive context-sensitive help.
An advanced driver for Razer Chroma hardware in Linux with multi-layer animation support
search projects, people, and tags