agentlytics
Comprehensive analytics dashboard for AI coding agents — Cursor, Windsurf, Claude Code, VS Code Copilot, Zed, Antigravi…
JavaScript★ 555
Custom Grafana Dashboards for Teslamate 🚘
 jheredianet
git clone https://github.com/jheredianet/Teslamate-CustomGrafanaDashboards.gitjheredianet/Teslamate-CustomGrafanaDashboardsThis is a project with Custom Grafana Dashboards, created especially to work with a Teslamate installation. So the main requirement for these dashboards to work, is to have a Teslamate running instance.
Teslamate is a powerful, self-hosted data logger for your Tesla.
In order to auto-import all the dashboard files from this repository, considering that your are using the official Teslamate Docker install documentation guide, proceed as follows.
Note: If you are using Teslamate without Docker you may skip these section and proceed to import manually.
git clone https://github.com/jheredianet/Teslamate-CustomGrafanaDashboards.git
services:
  ...
  ...
  grafana:
    ...
    ...
    volumes:
      - teslamate-grafana-data:/var/lib/grafana
      - ~/Teslamate-CustomGrafanaDashboards/customdashboards.yml:/etc/grafana/provisioning/dashboards/customdashboards.yml
      - ~/Teslamate-CustomGrafanaDashboards/dashboards:/TeslamateCustomDashboards
Attention! On some VPS from certain providers like Google GCC, the user running docker engine is not the current user so it's home folder is different, or maybe you just want to use a specific folder for your data. If this is the case, it's better to use the full path of the repository where you cloned it, instead of using the home path of the current user (~/). So, be sure to modify the path of the volumes section accordingly, as the sample given below:
services:
  ...
  ...
  grafana:
    ...
    ...
    volumes:
      - teslamate-grafana-data:/var/lib/grafana
      - /some/path/Teslamate-CustomGrafanaDashboards/customdashboards.yml:/etc/grafana/provisioning/dashboards/customdashboards.yml
      - /some/path/Teslamate-CustomGrafanaDashboards/dashboards:/TeslamateCustomDashboards
If you want to be sure that you are using the latest version of the Dashboards:
git -C ~/Teslamate-CustomGrafanaDashboards pull
docker compose restart grafana
Or (if you are using a previous docker version)
docker-compose restart grafana
In order to use these dashboards, once imported, you may want to go to the Grafana "Browse" option (from the left vertical bar), from there you will see a new folder with the imported dashboards.
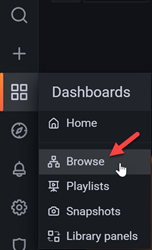
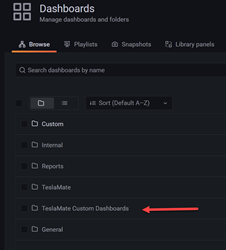
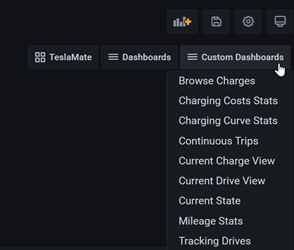
This Custom Dashboards have a special label so they don't get mixed up with the Teslamate defaults dashboards to distinguish easier and group together. When you are in a Custom Dashboard you will see in the upper right corner, a drop-down button from you may access the rest dashboards as well.
The following steps let you import the JSON files into your setup if you don't want to auto-import them:
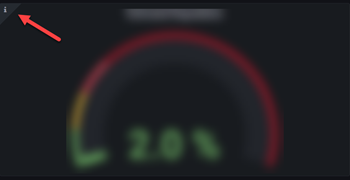
Have in mind that each dashboard may have an "Information" icon (as shown in the following image). If you point on it, you'll have aditional information on the current panel. Try to check it while you are browsing or analyzing your data.
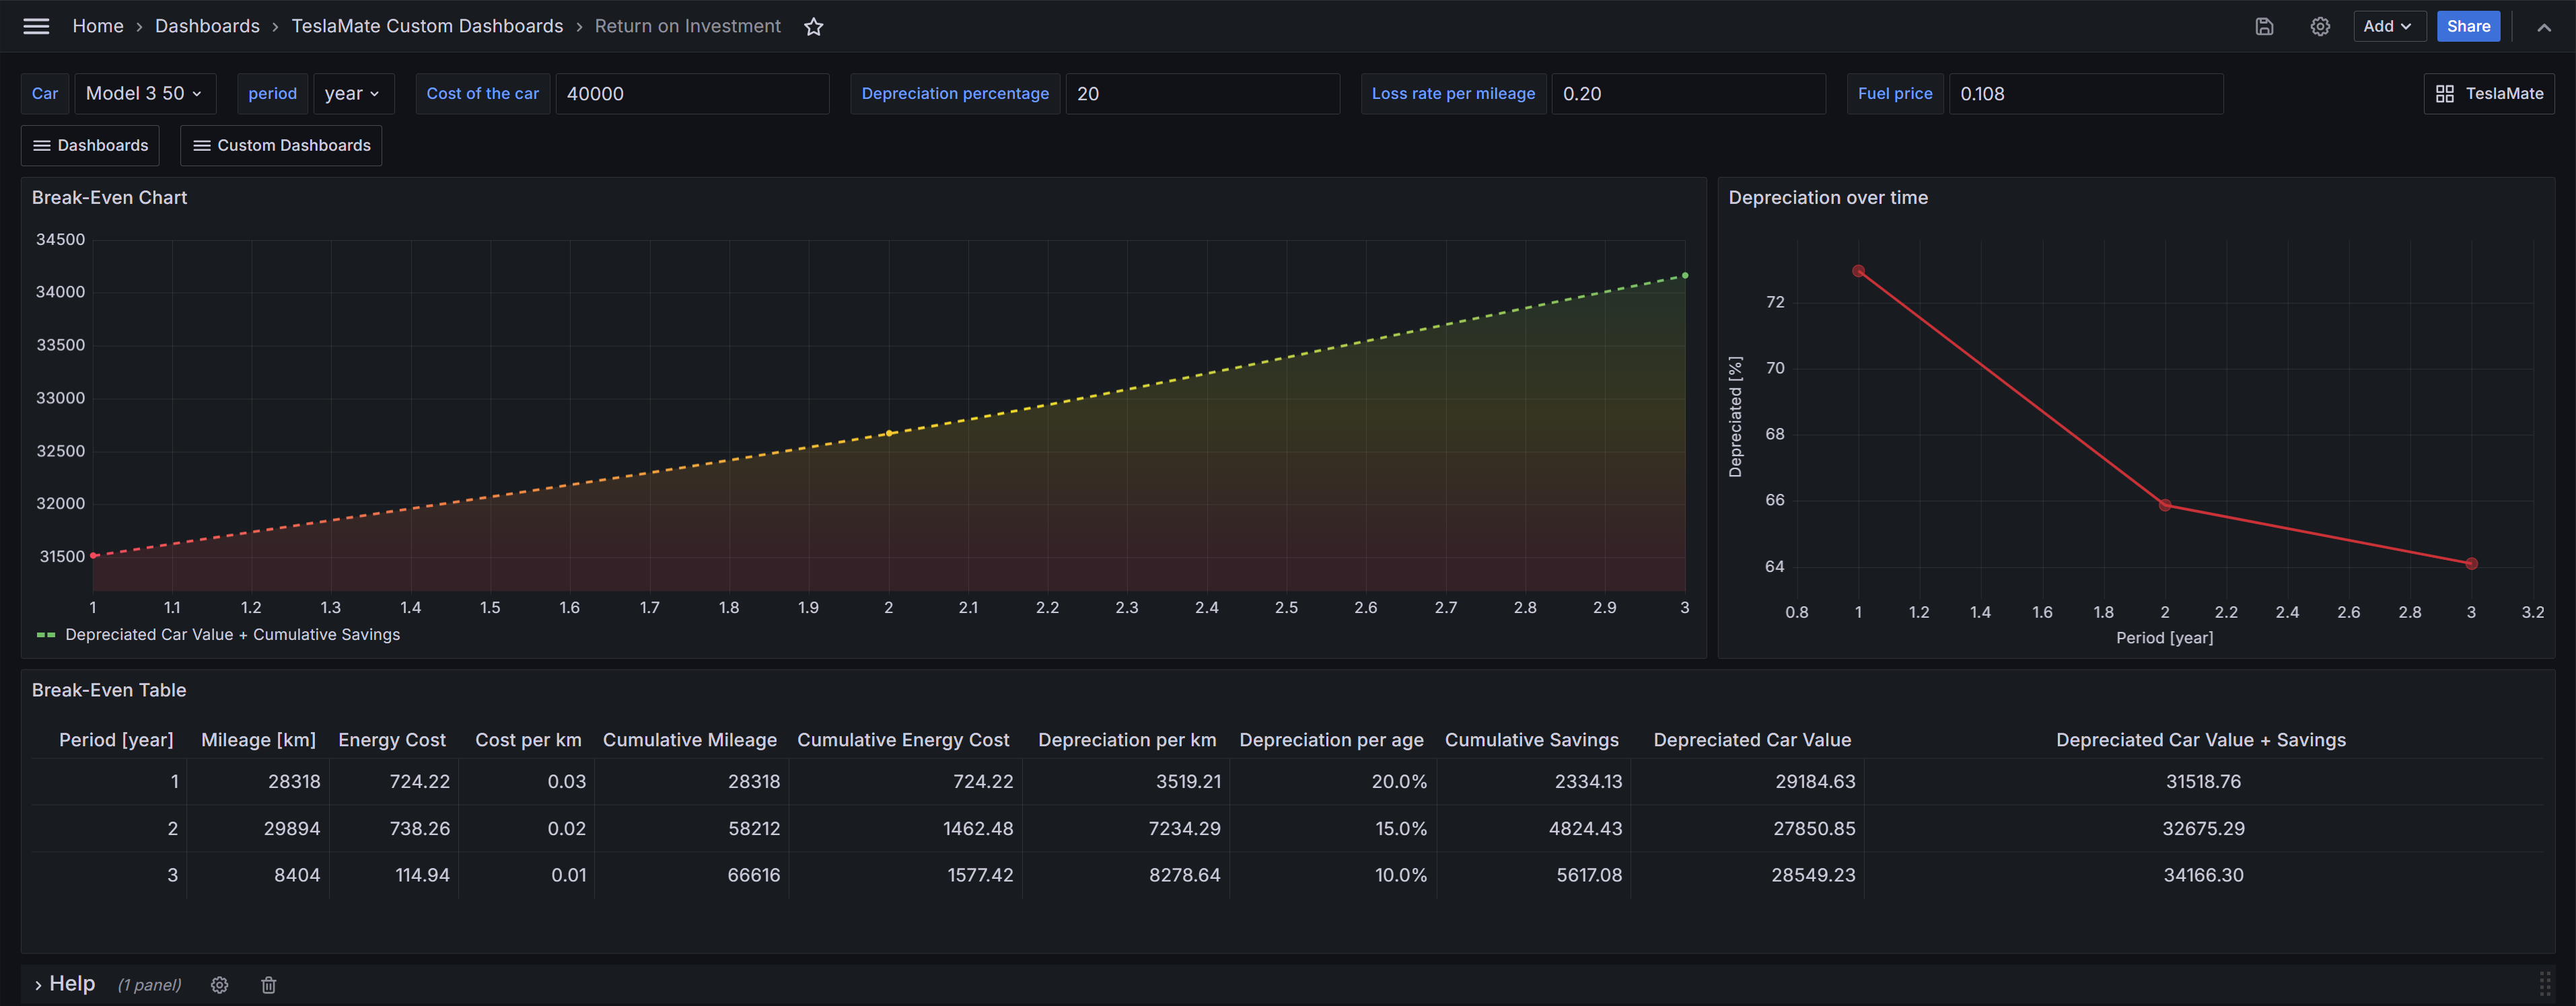
This dashboard aims to show the depreciation value of the car over time and its journey. Depreciating a car by its mileage can be done using various methods. A common approach is to use a depreciation rate per mile or to create a depreciation curve based on data. On the other hand, the depreciation of a car due to age can vary depending on several factors such as the make, model, overall condition of the vehicle, and demand in the market. Here you can put your costs, rates and other variable values to have and idea of the depreciated car value and fuel savings.
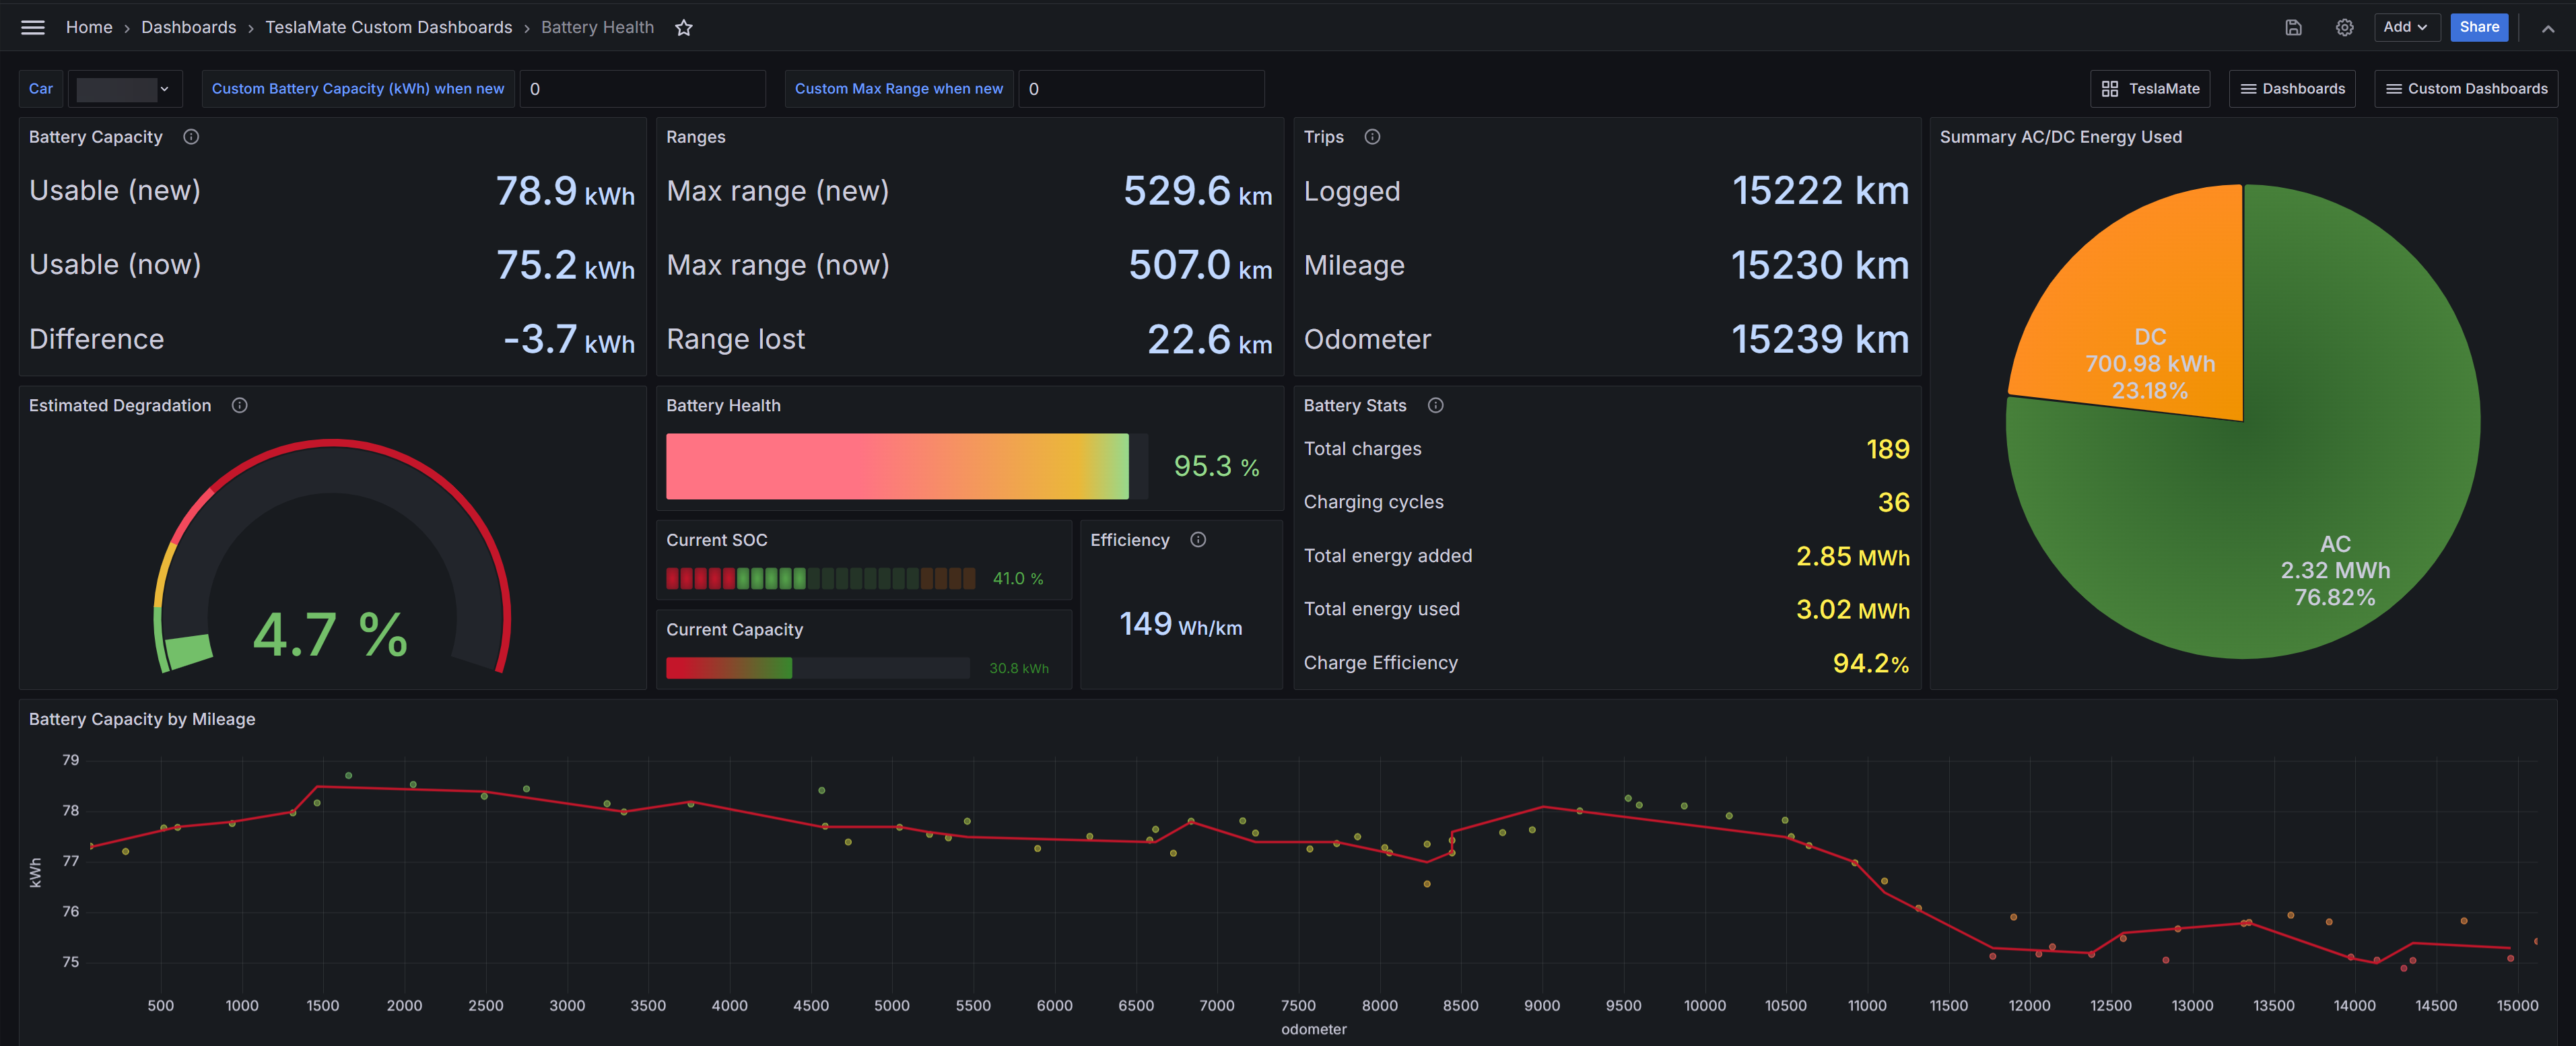
This dashboard has been already migrated (given) to the core dashboards of Teslamate and will continue developing directly there with the collaboration of all the enthusiasts in the community. You will find it there with the same name Battery Health.
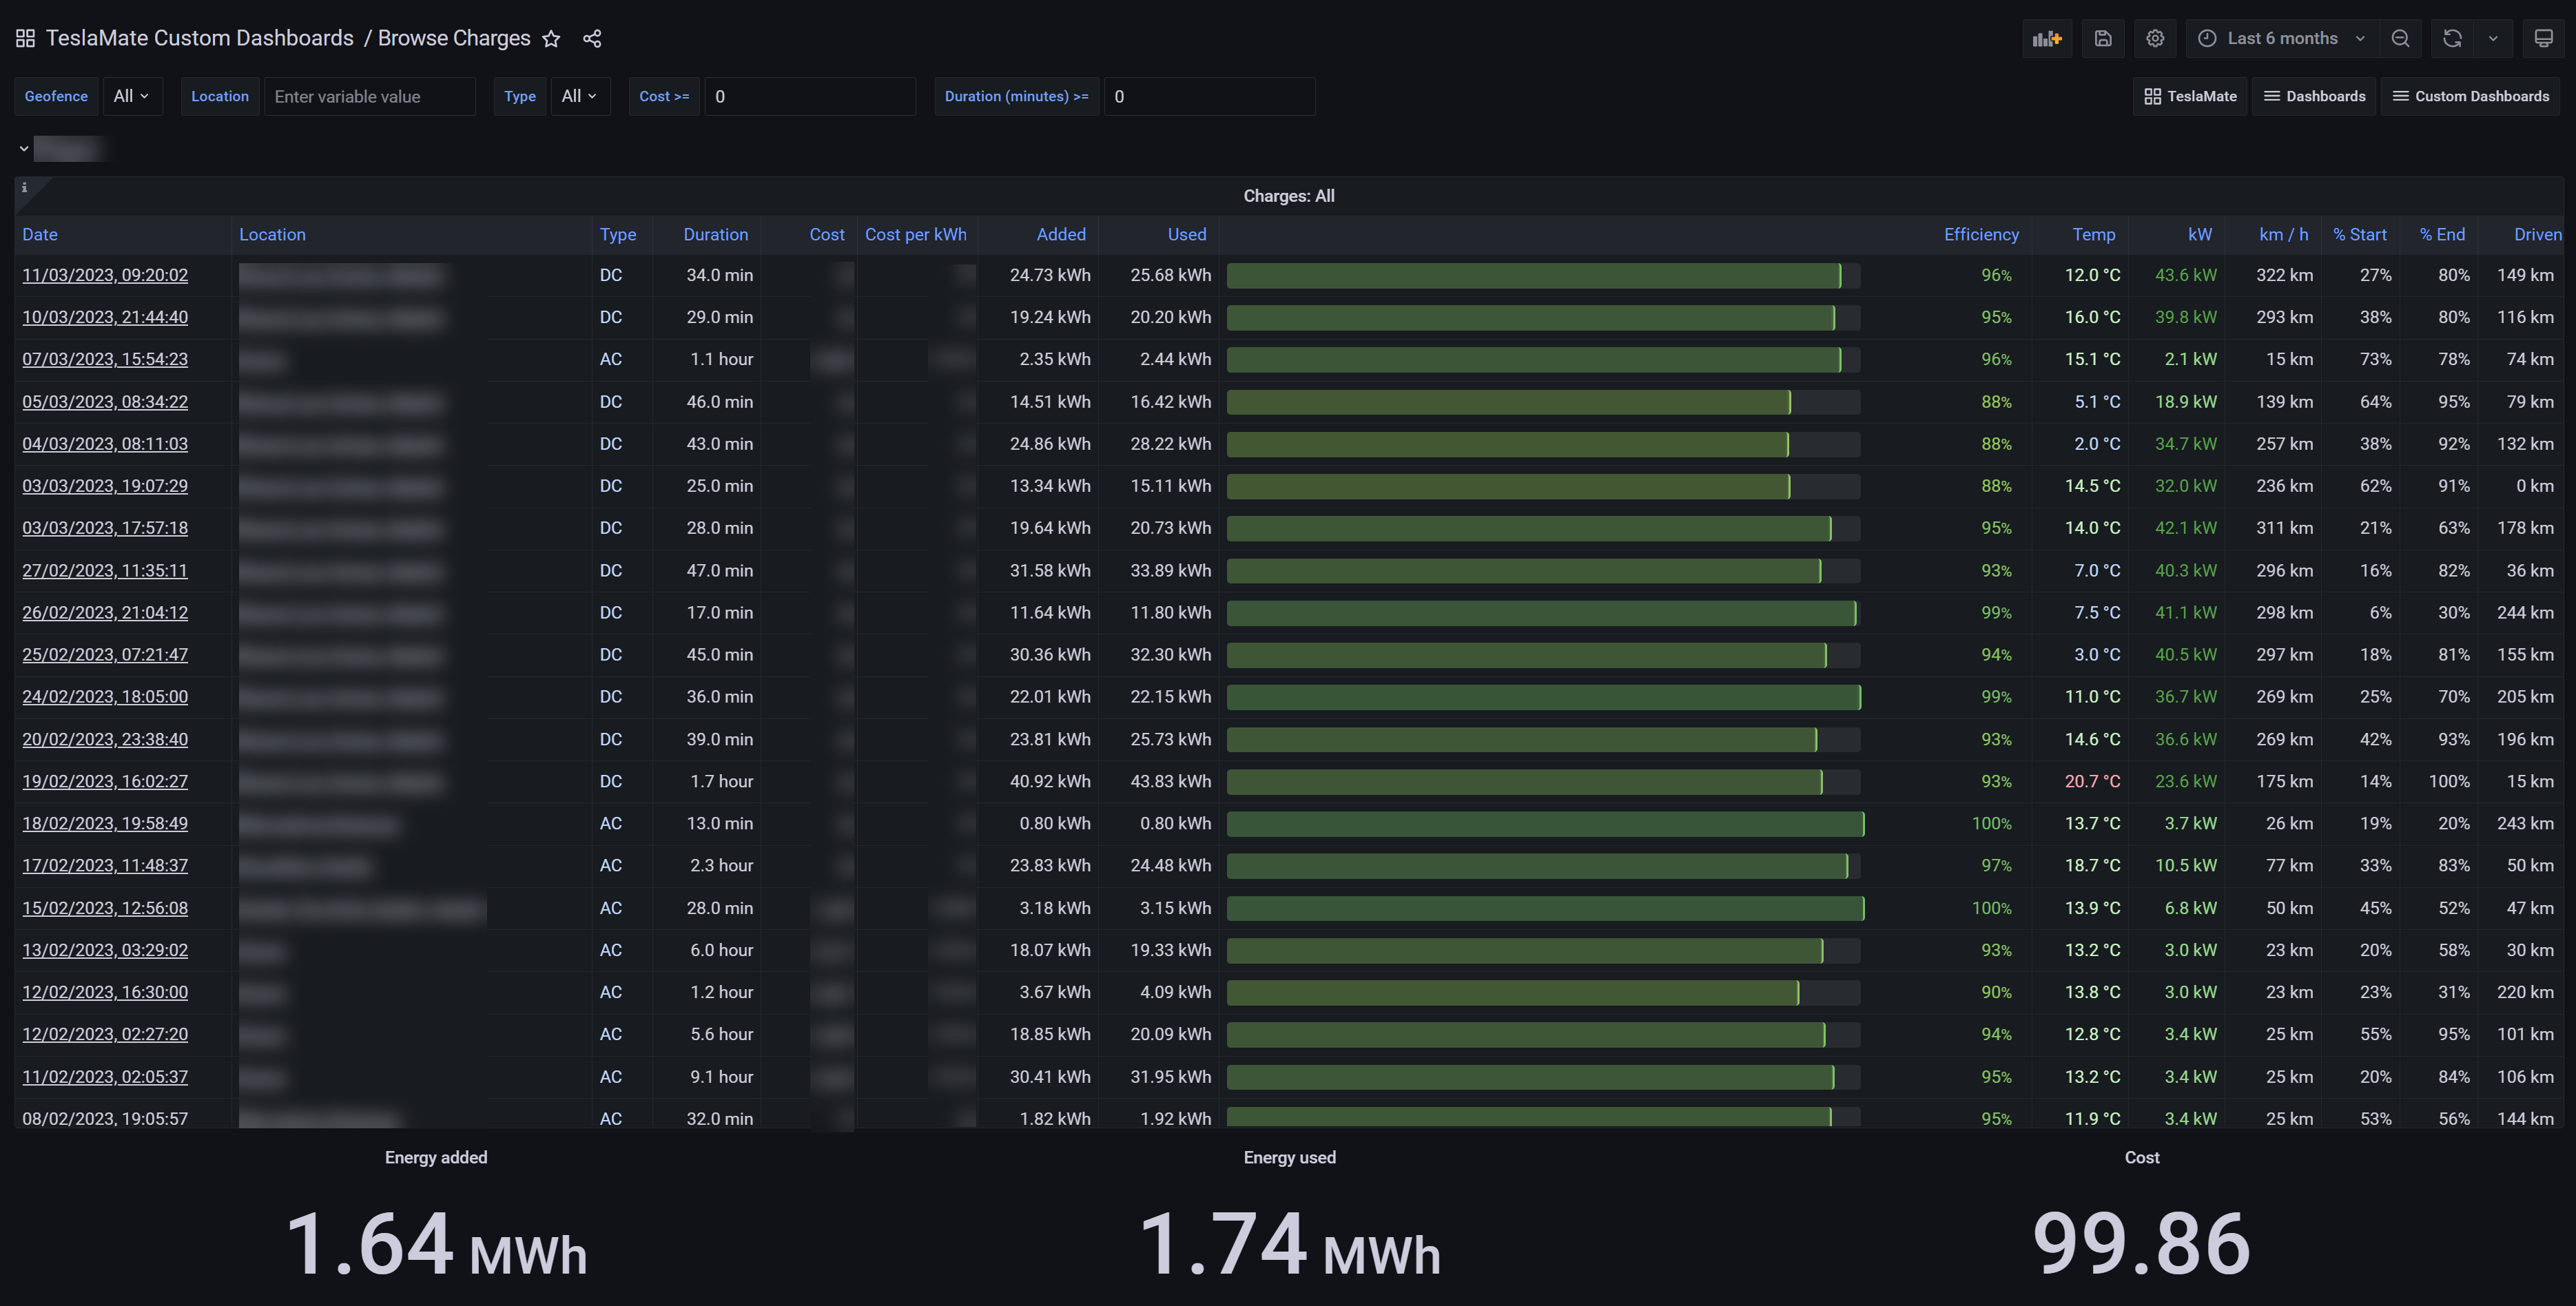
This dashboard has been already migrated (given) to the core dashboards of Teslamate and will continue developing directly there with the collaboration of all the enthusiasts in the community. You will find it there with the name Charges.
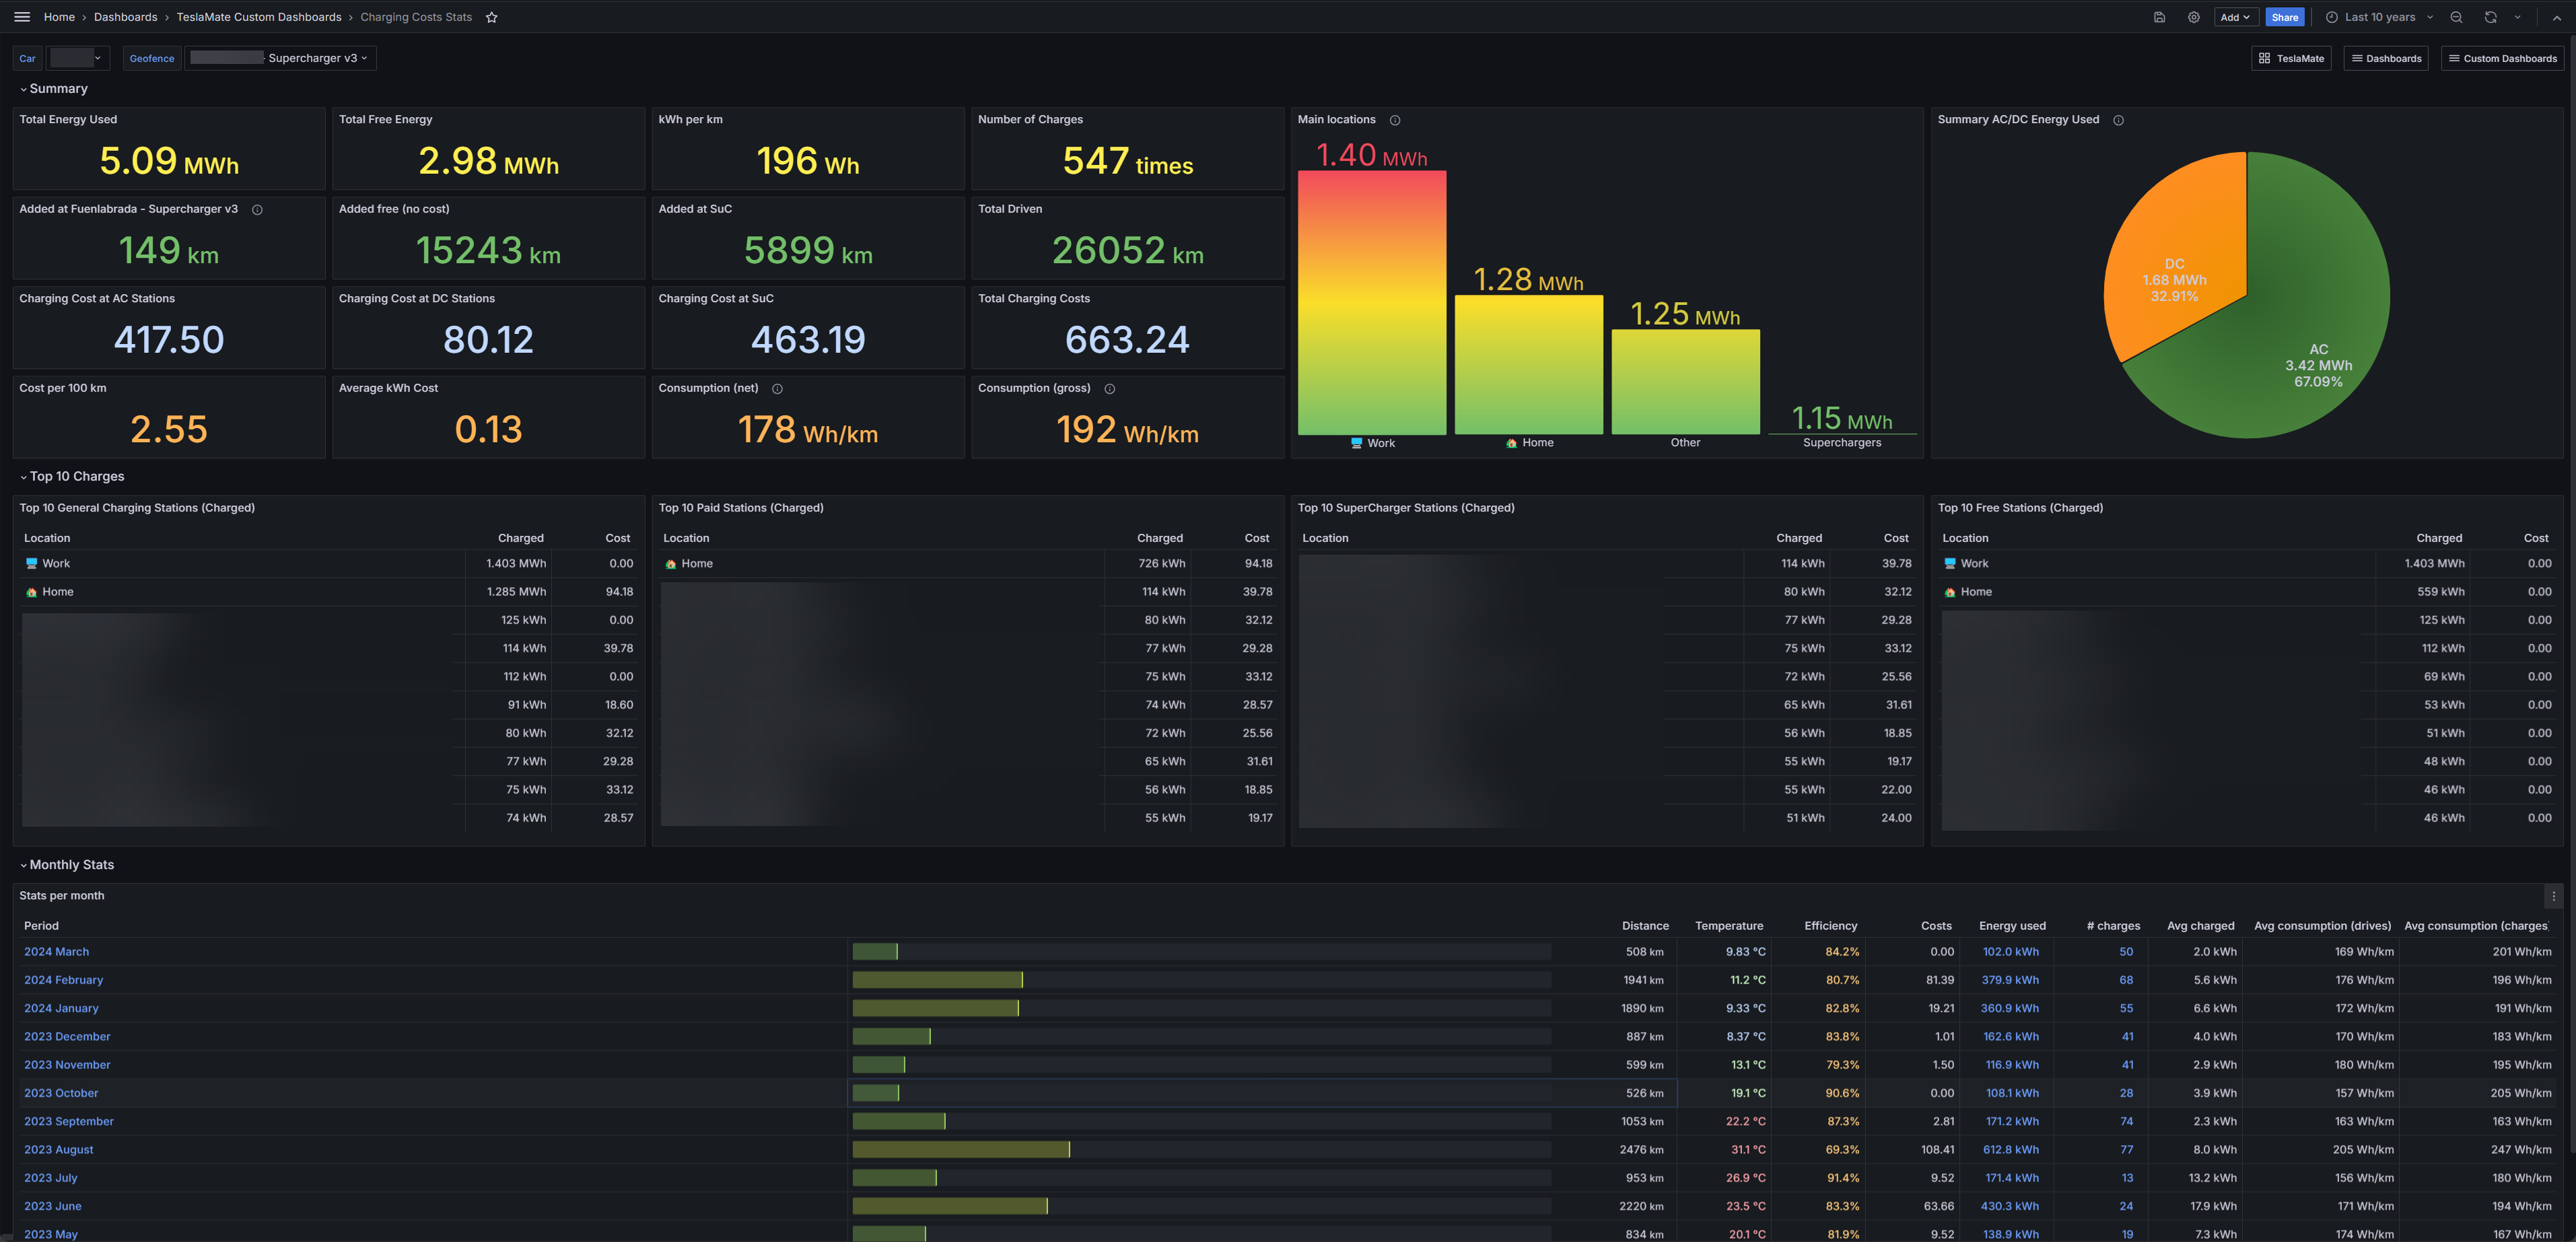
This dashboard is meant to have a look of all the charges in a given period (last 10 years by default). You can see the distance driven, number of charges, total charging cost, etc., both in summary or in separated lists.
You can expand/collapse the rows as needed.
From the Monthly Stats row, you will have a table with links to other Teslamate Dashboards to have a look on a specific period, charge or trip.
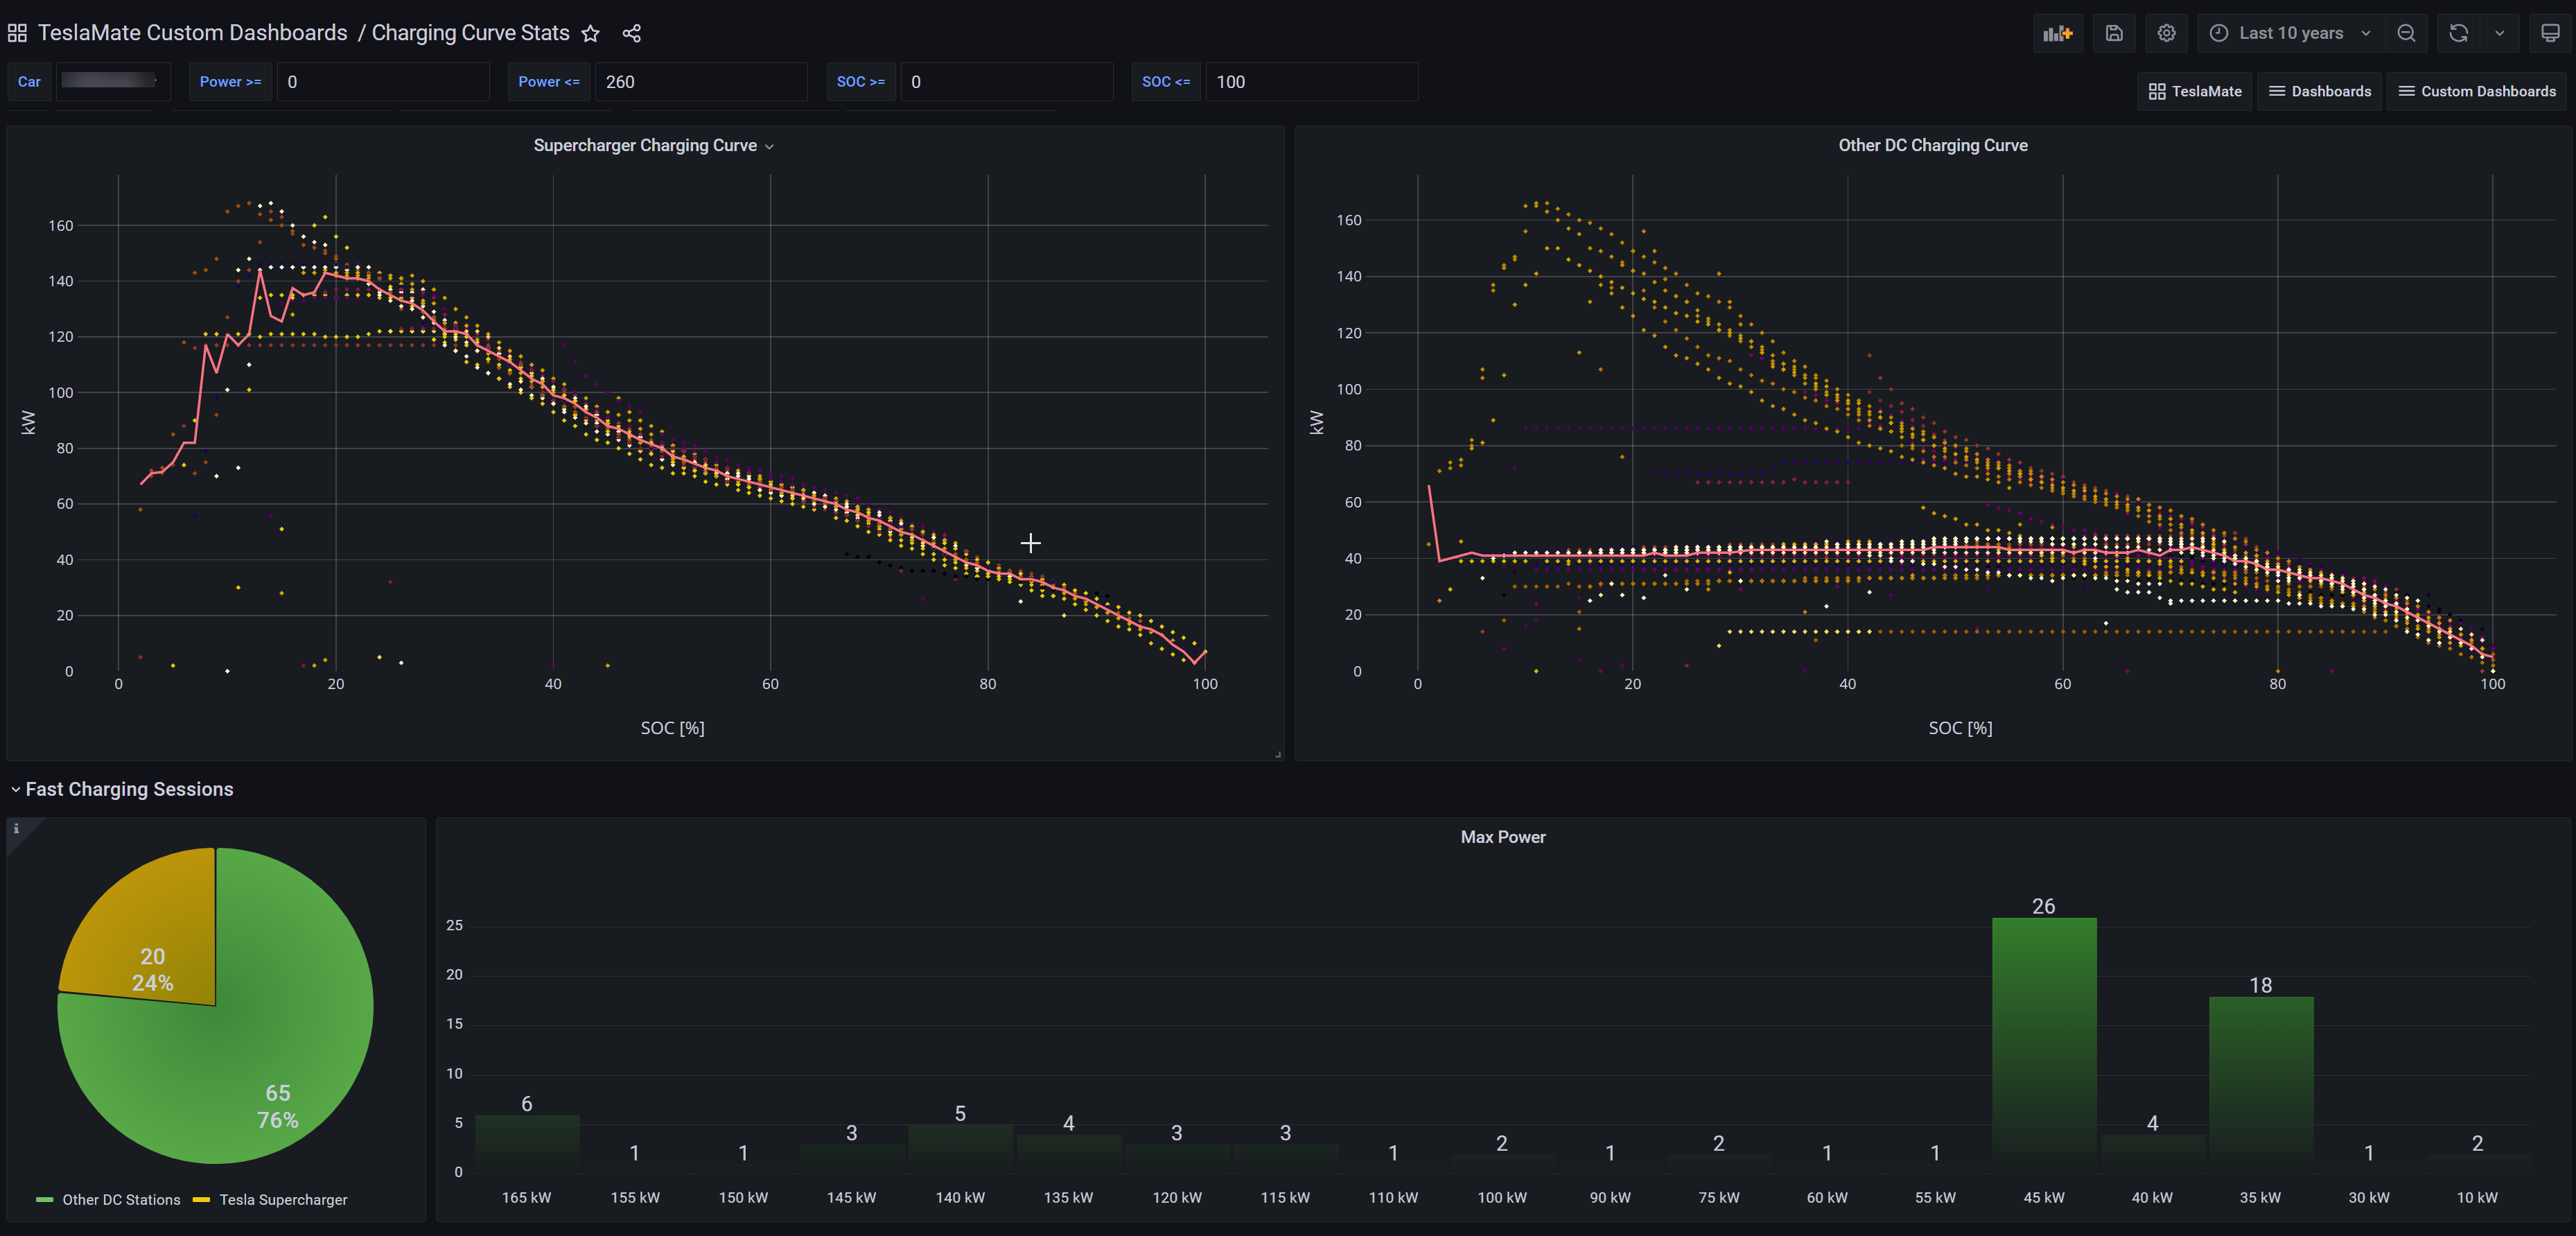
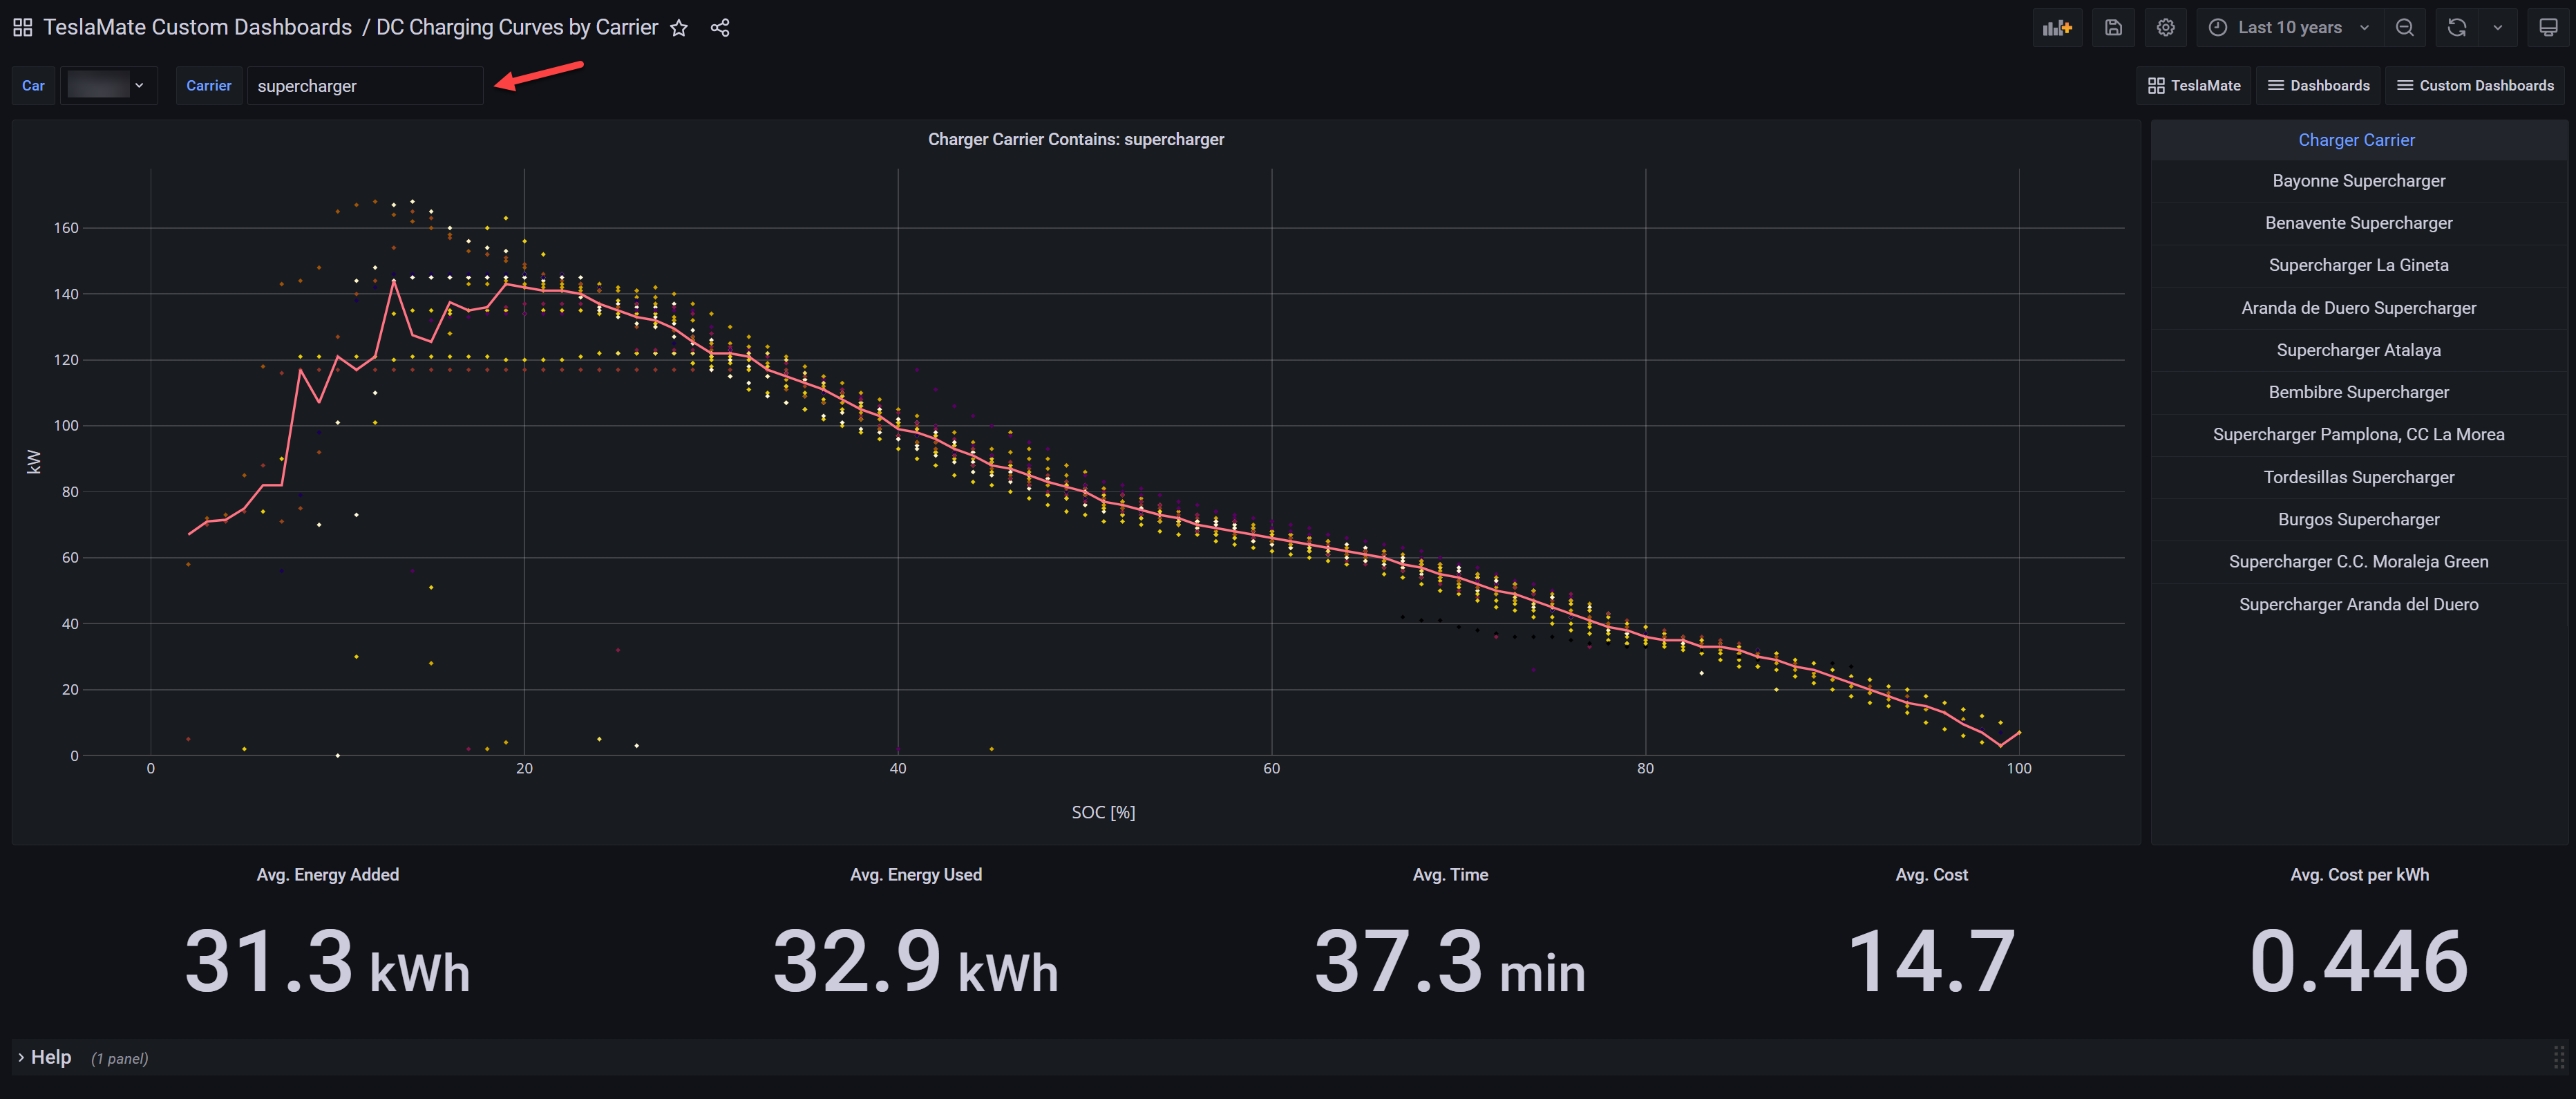
This dashboard is meant to have a look of the charging curve sessions on Tesla Supercharges or other Fast Charging Station. Also, you can see number of fast charging sessions you've done on each type of chargers and the count of max power (kW) reached on a session as shown in the following example.
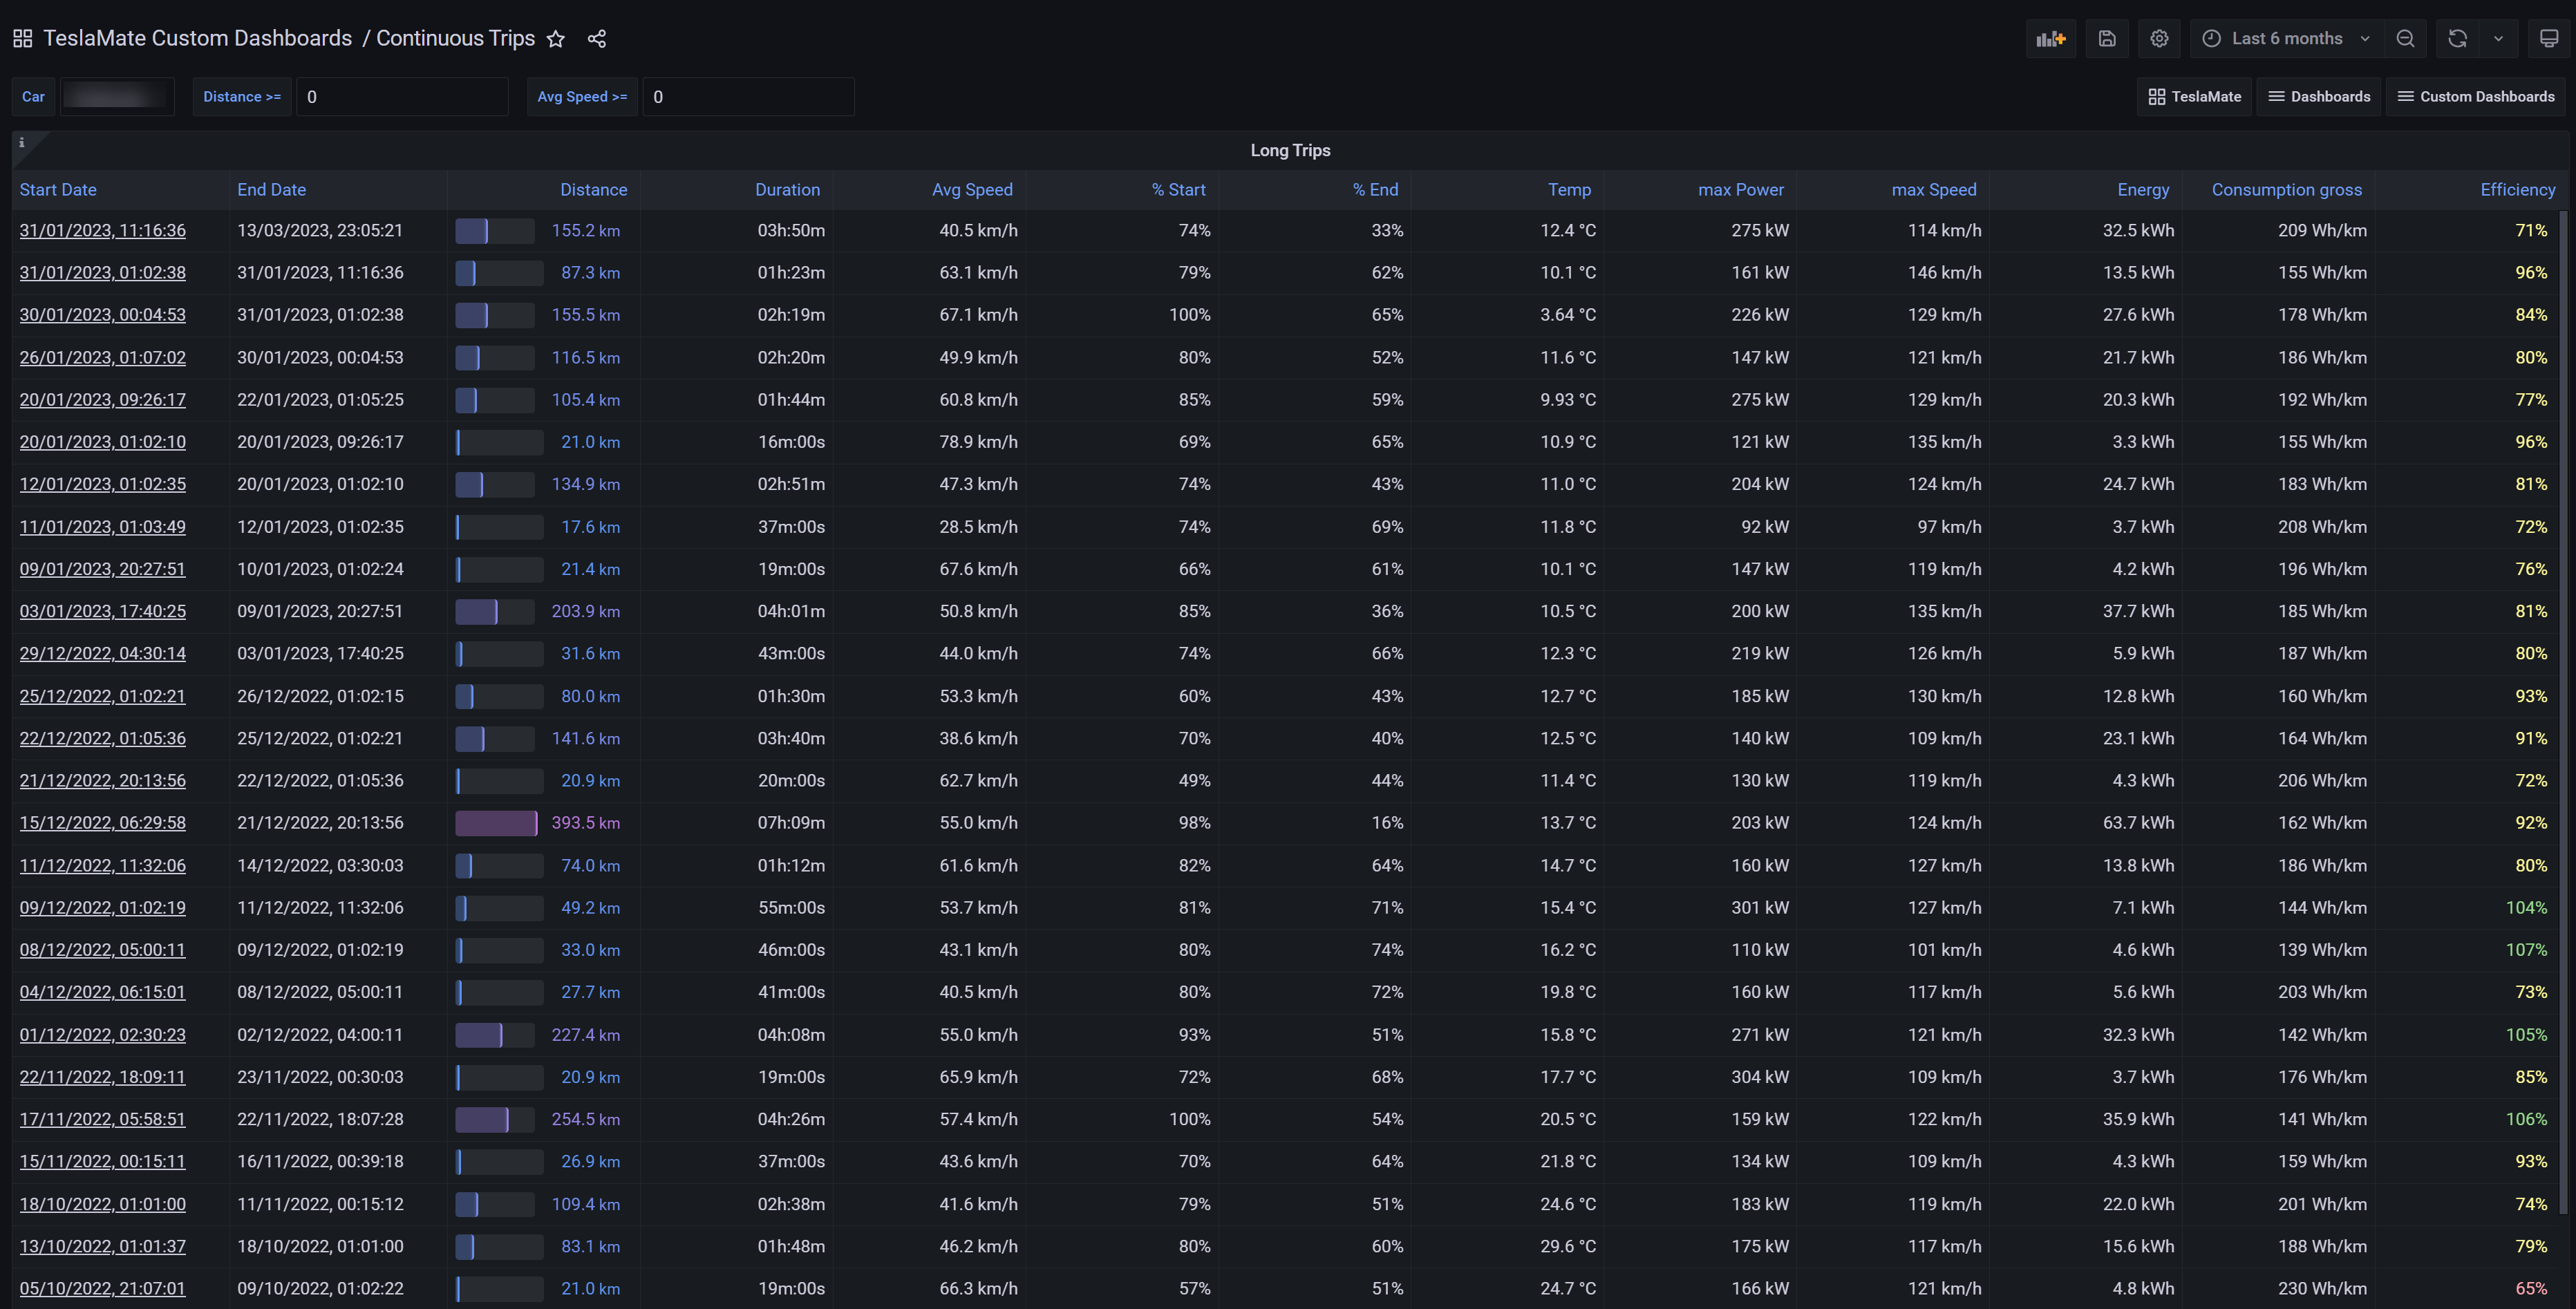
This dashboard has a table with all the trips you've made between charges sesions, so you can browse the longest or shortest mileage you travel.
You may also take a look to a specific trip from the initial charge session (before the trip) to the end of the of the charge session (after the trip), through the link in the first column that will take you to the TeslaMate Trips dashboard.
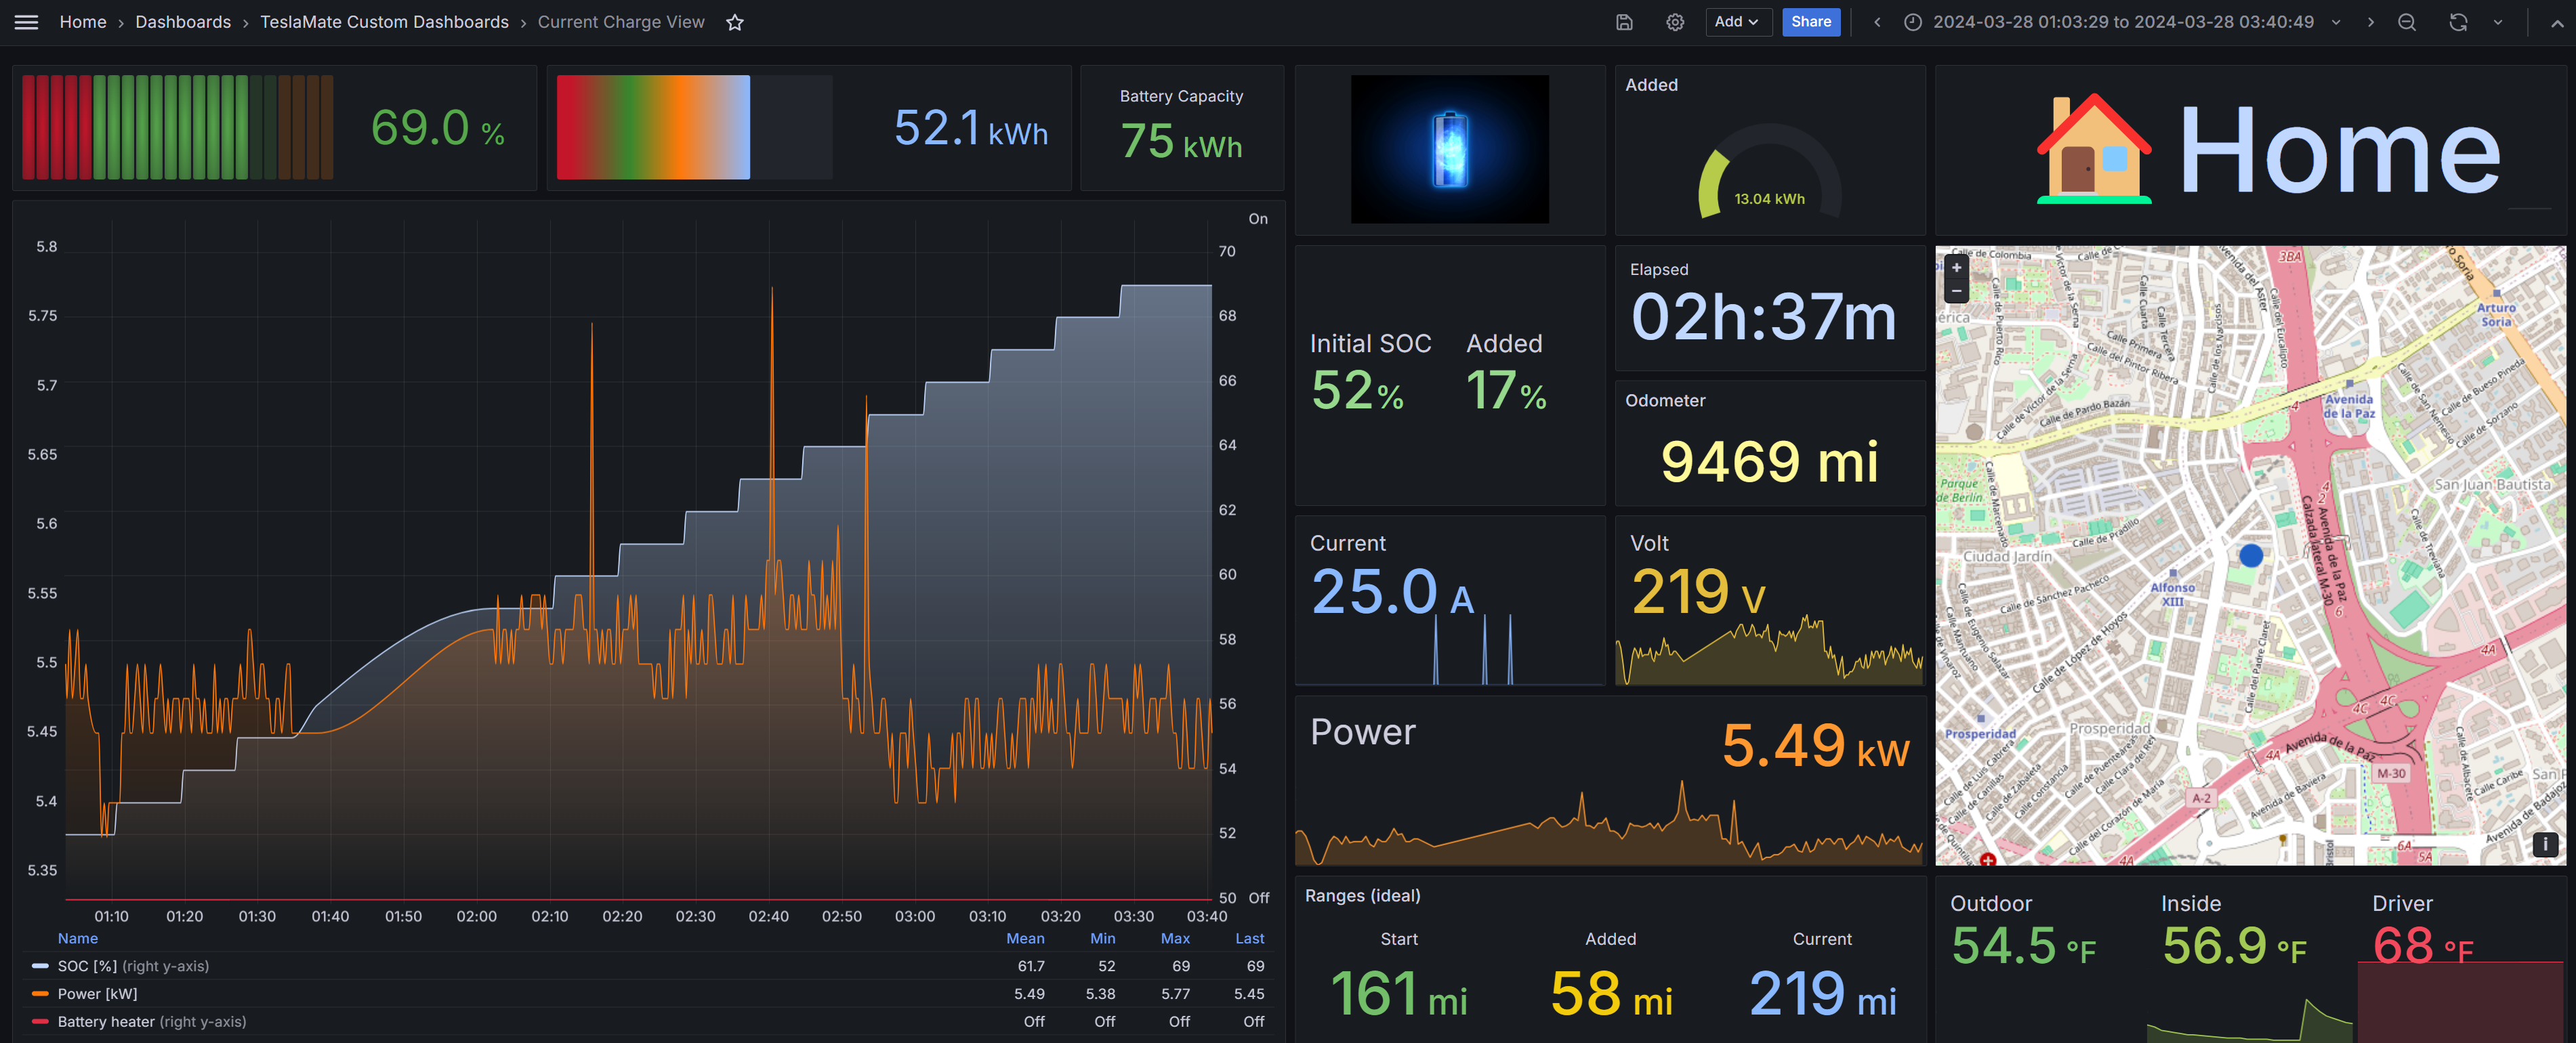
Load this dashboard to while you are in a charging sesion. When you open this dashboard it will show the last 15 minutes, but you should click the "Current Charge" button at the top right corner, to enter in Kiosk mode:
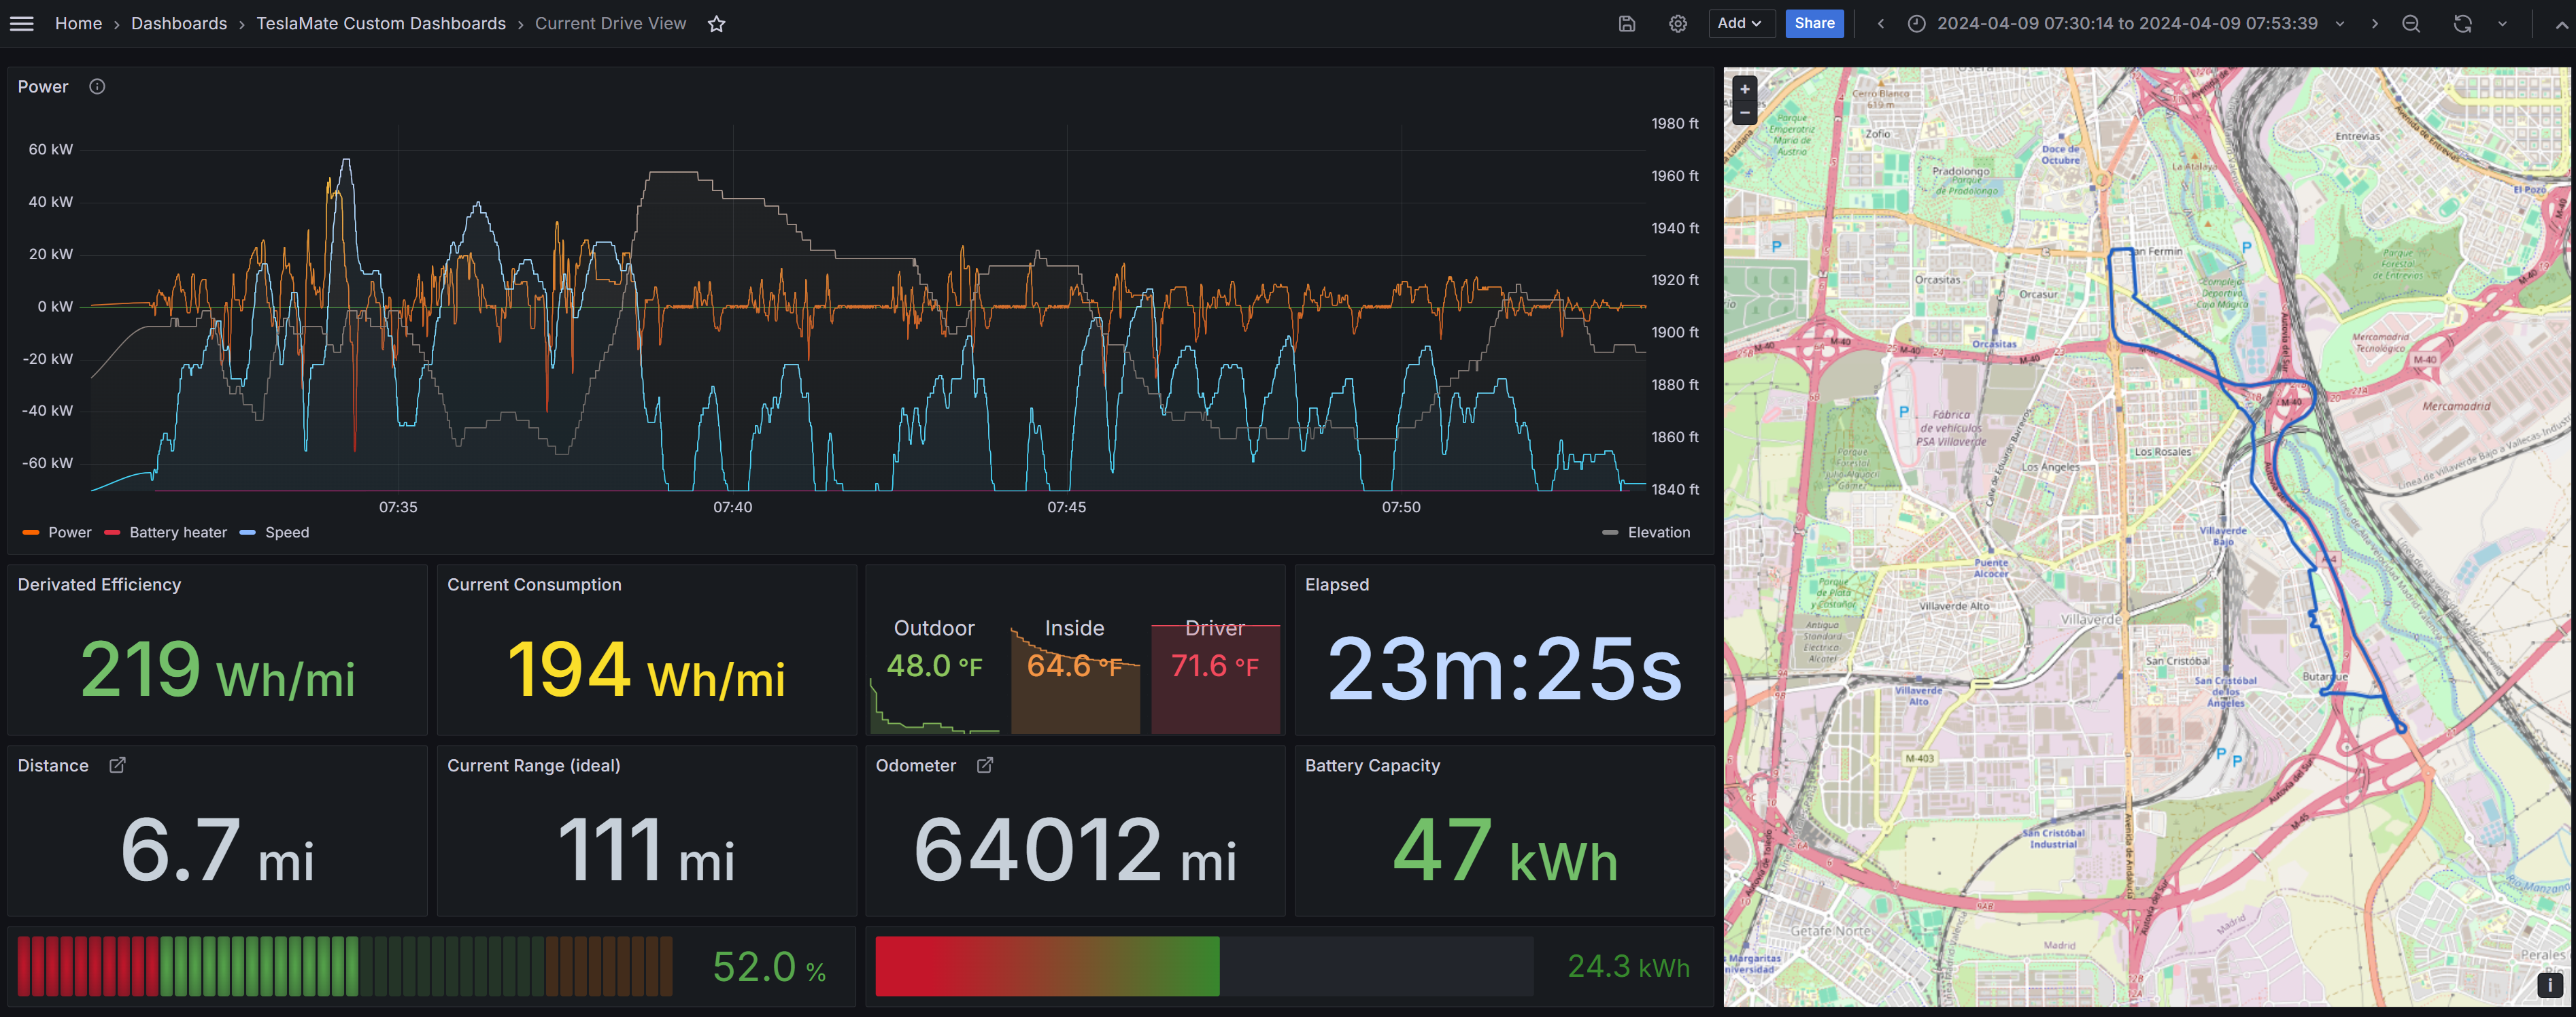
This is a special dashboard to load while driving. When you open this dashboard it will show the last 15 minutes, but you should click the "Current Drive" button at the top right corner, to enter in Kiosk mode:
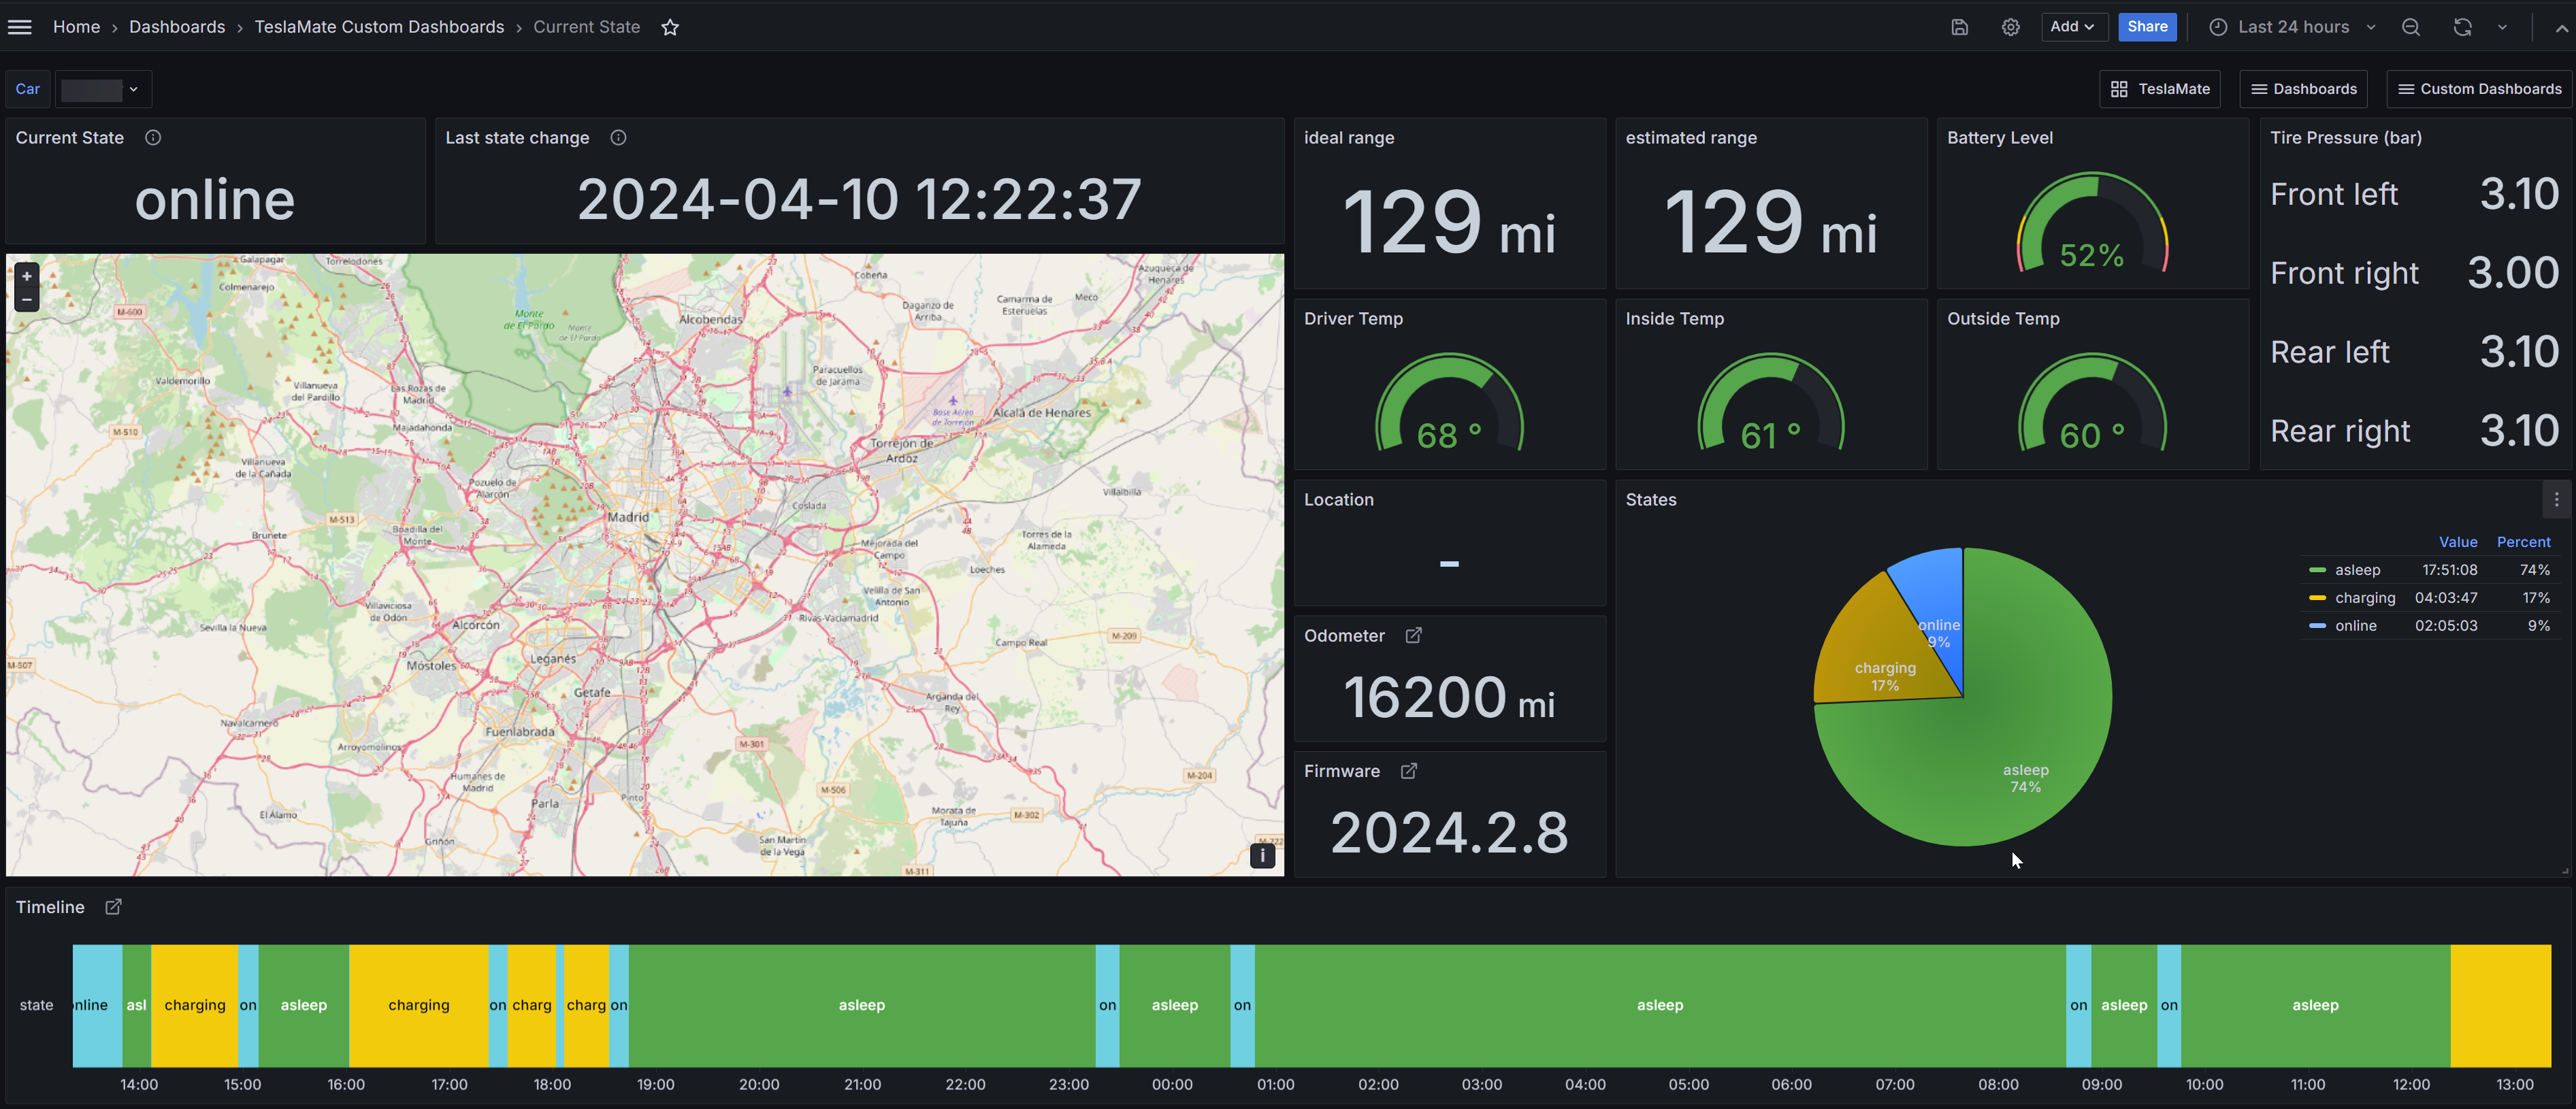
This dasboard is just to see the current state of the car with the last data recorded by TeslaMate.
Additionally, you can see the states stats of the selected period.
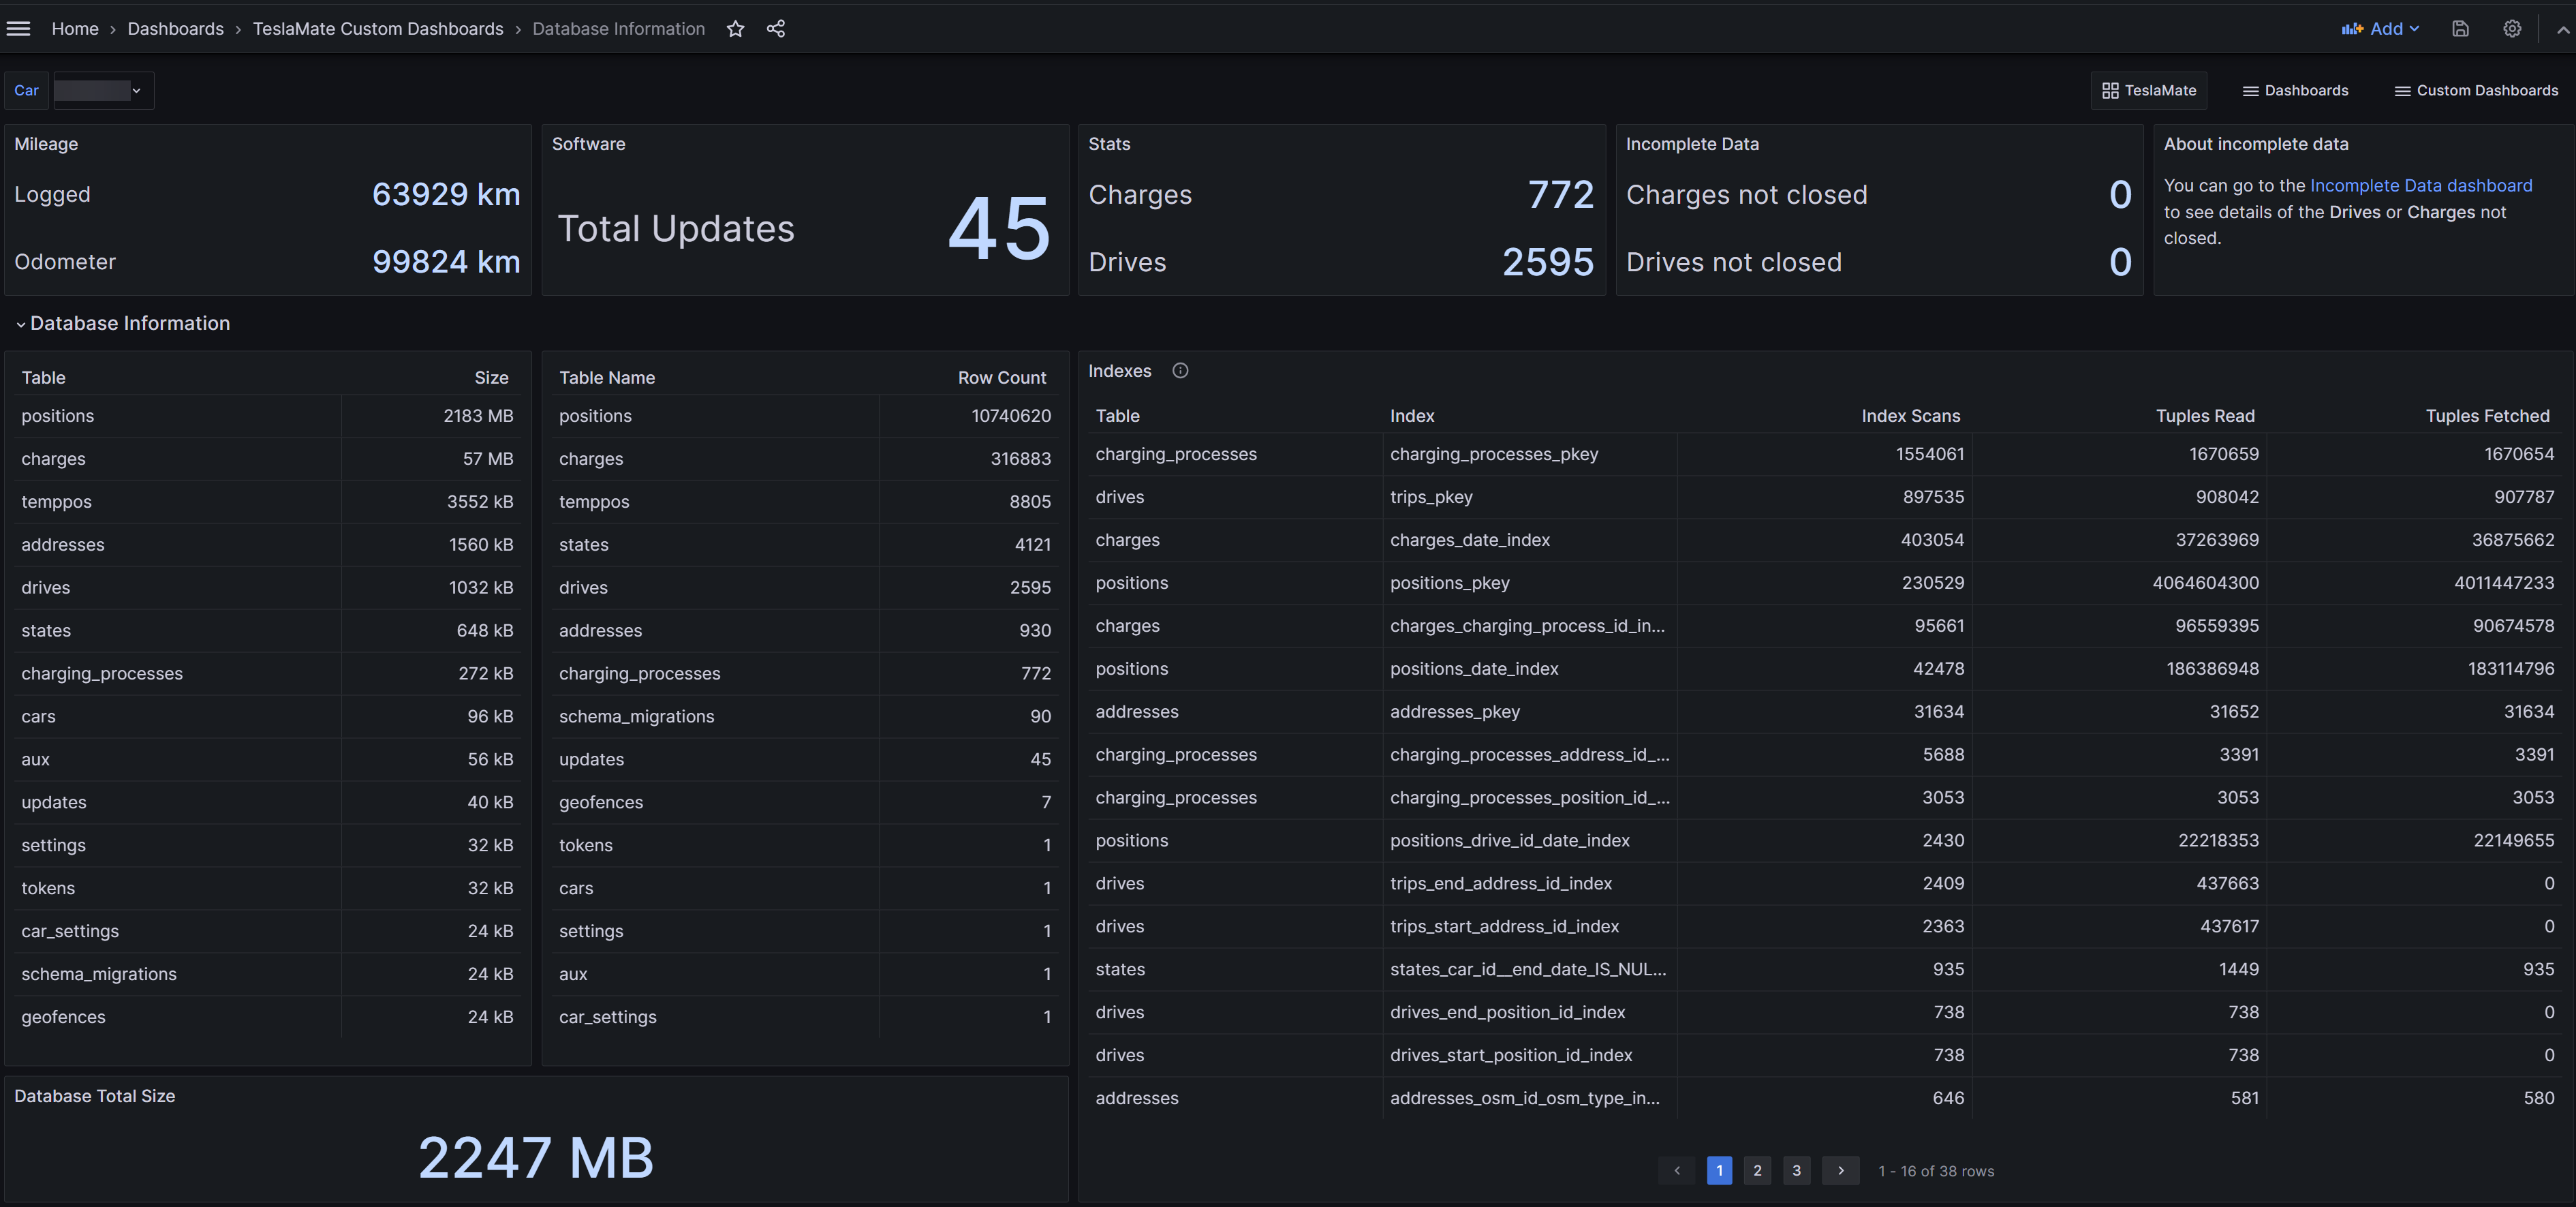
This dashboard has been already migrated (given) to the core dashboards of Teslamate and will continue developing directly there with the collaboration of all the enthusiasts in the community. You will find it there with the name Database Information.
This dasboard is browse your DC charge sessions by charger carriers.
It's important that you have Geo-Fences added related with the name of the carrier you have recharged your car, or you may want to edit periodically the name field of the addresses table, so that it contains its name.
For example, if Teslamate geolocates the name as "Esso Purley Way" you may modify it to "Esso Purley Way - IONITY" or "IONITY Esso Purley Way", then you can filter using the filter textbox IONITY to show all the charging curves of all charging sessions at that carrier.
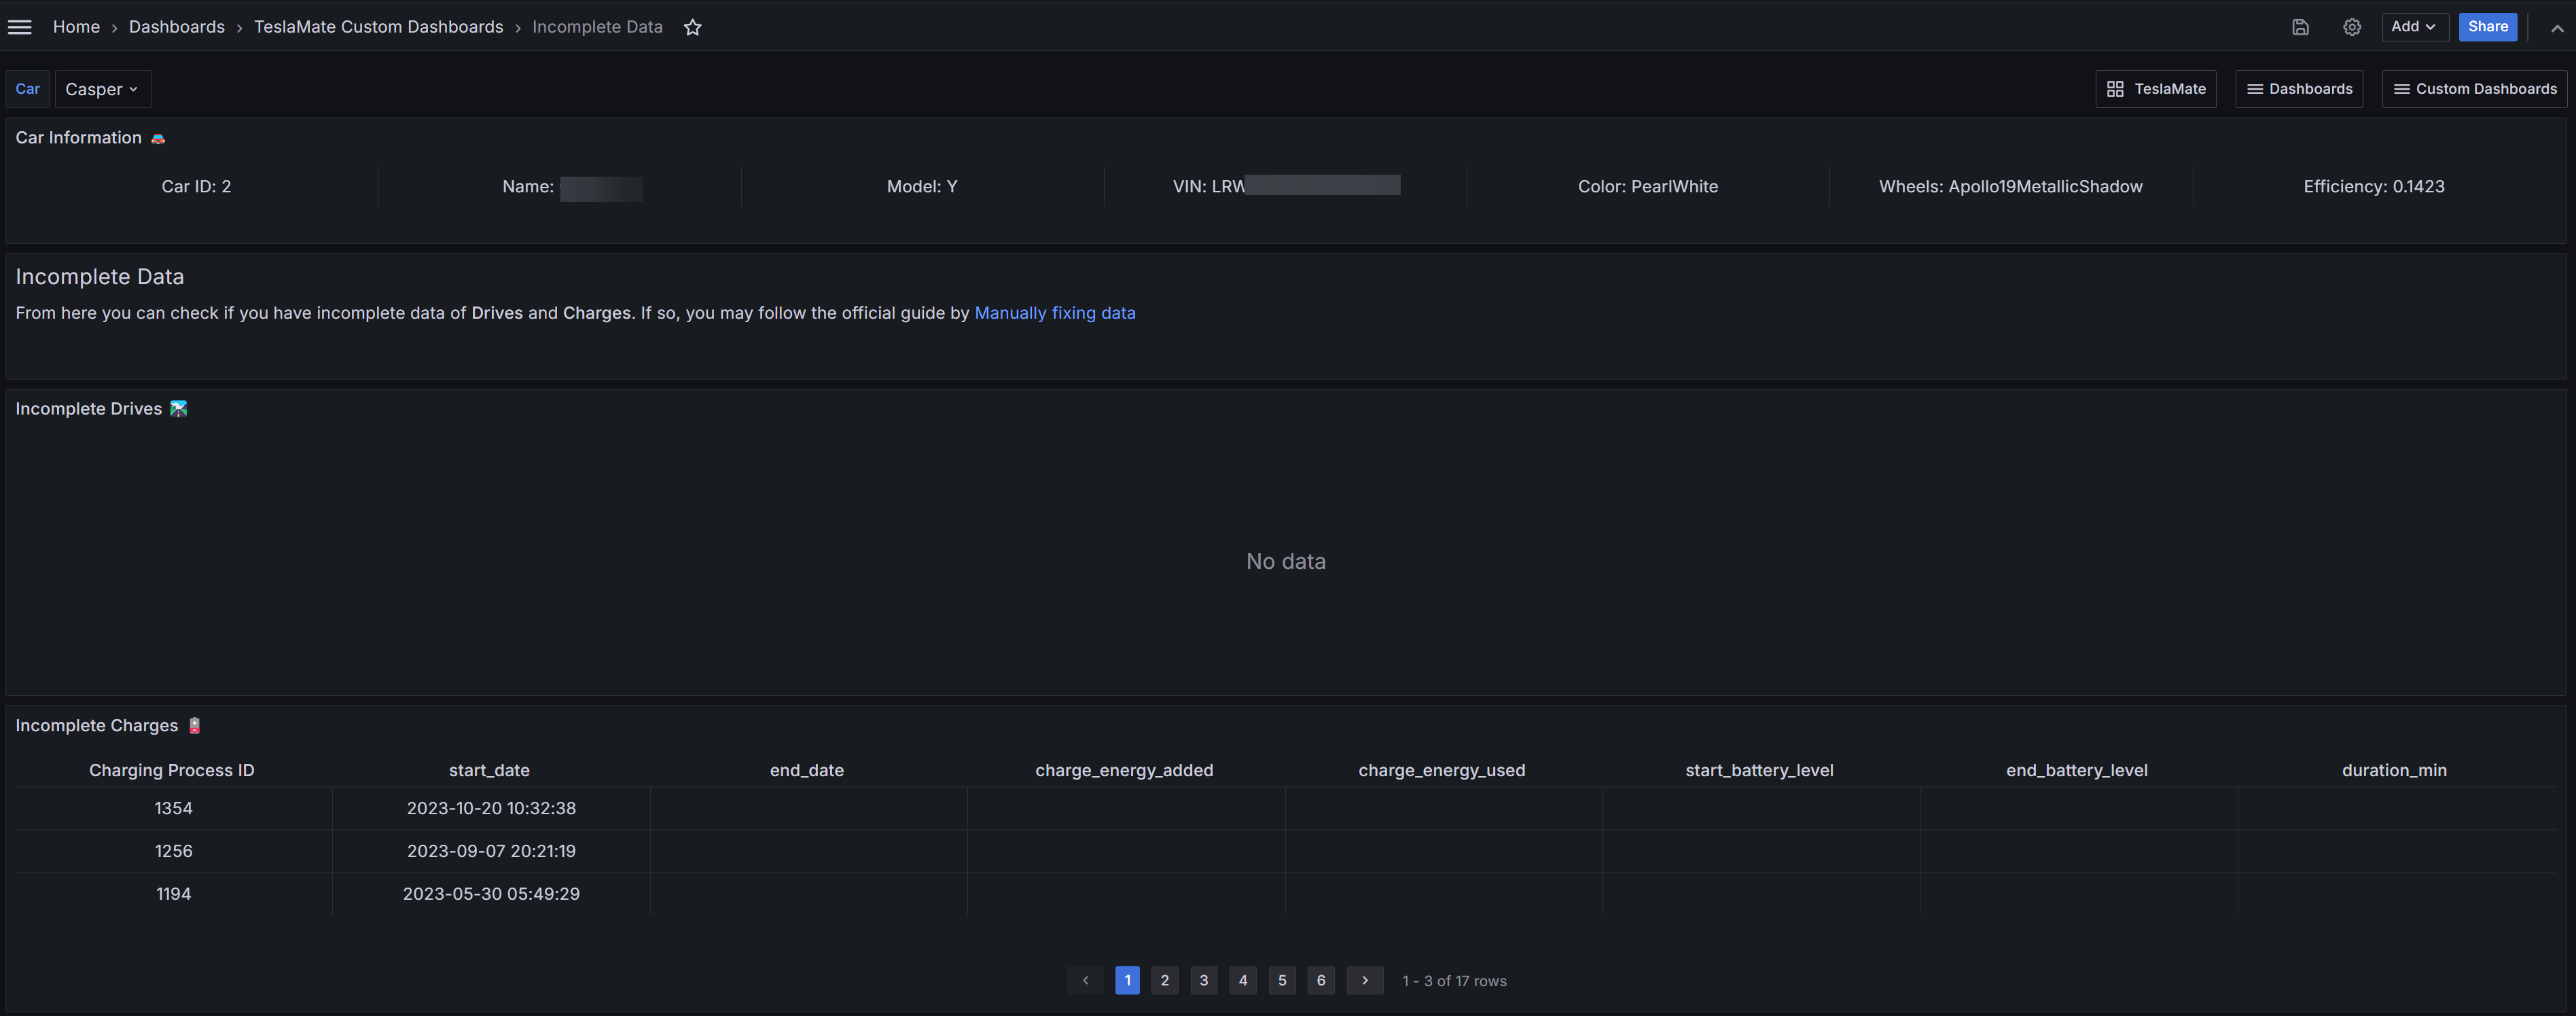
With this dashboard you may find your incomplete drives or charges that have been interrupted by the connection or any other issue. So you may follow the official guide to fix it.
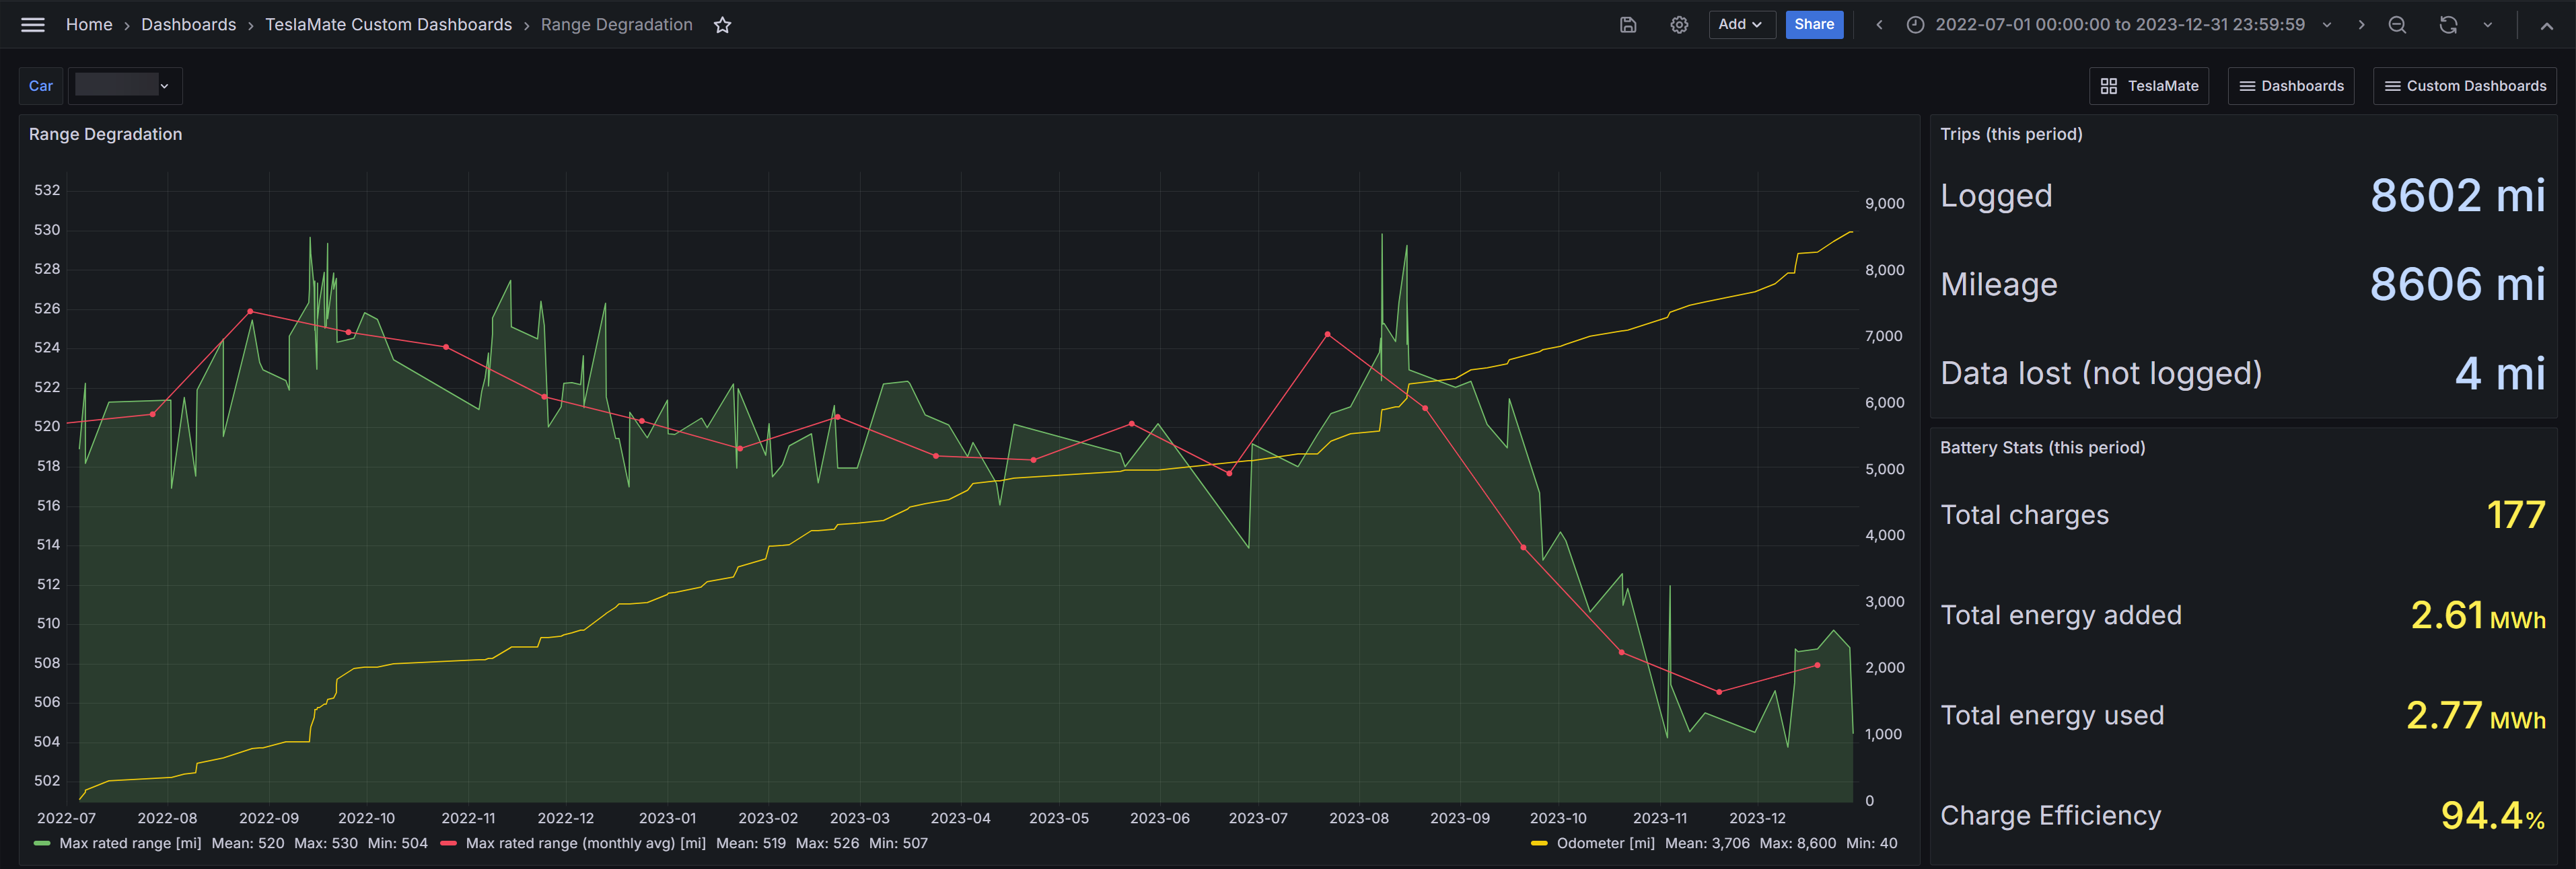
In this dashboard you may analyze your mileage and the range degradation by a selected period.
So you may have an idea of how much of range is lost as well as if there were any failure in Teslamate logging your data.
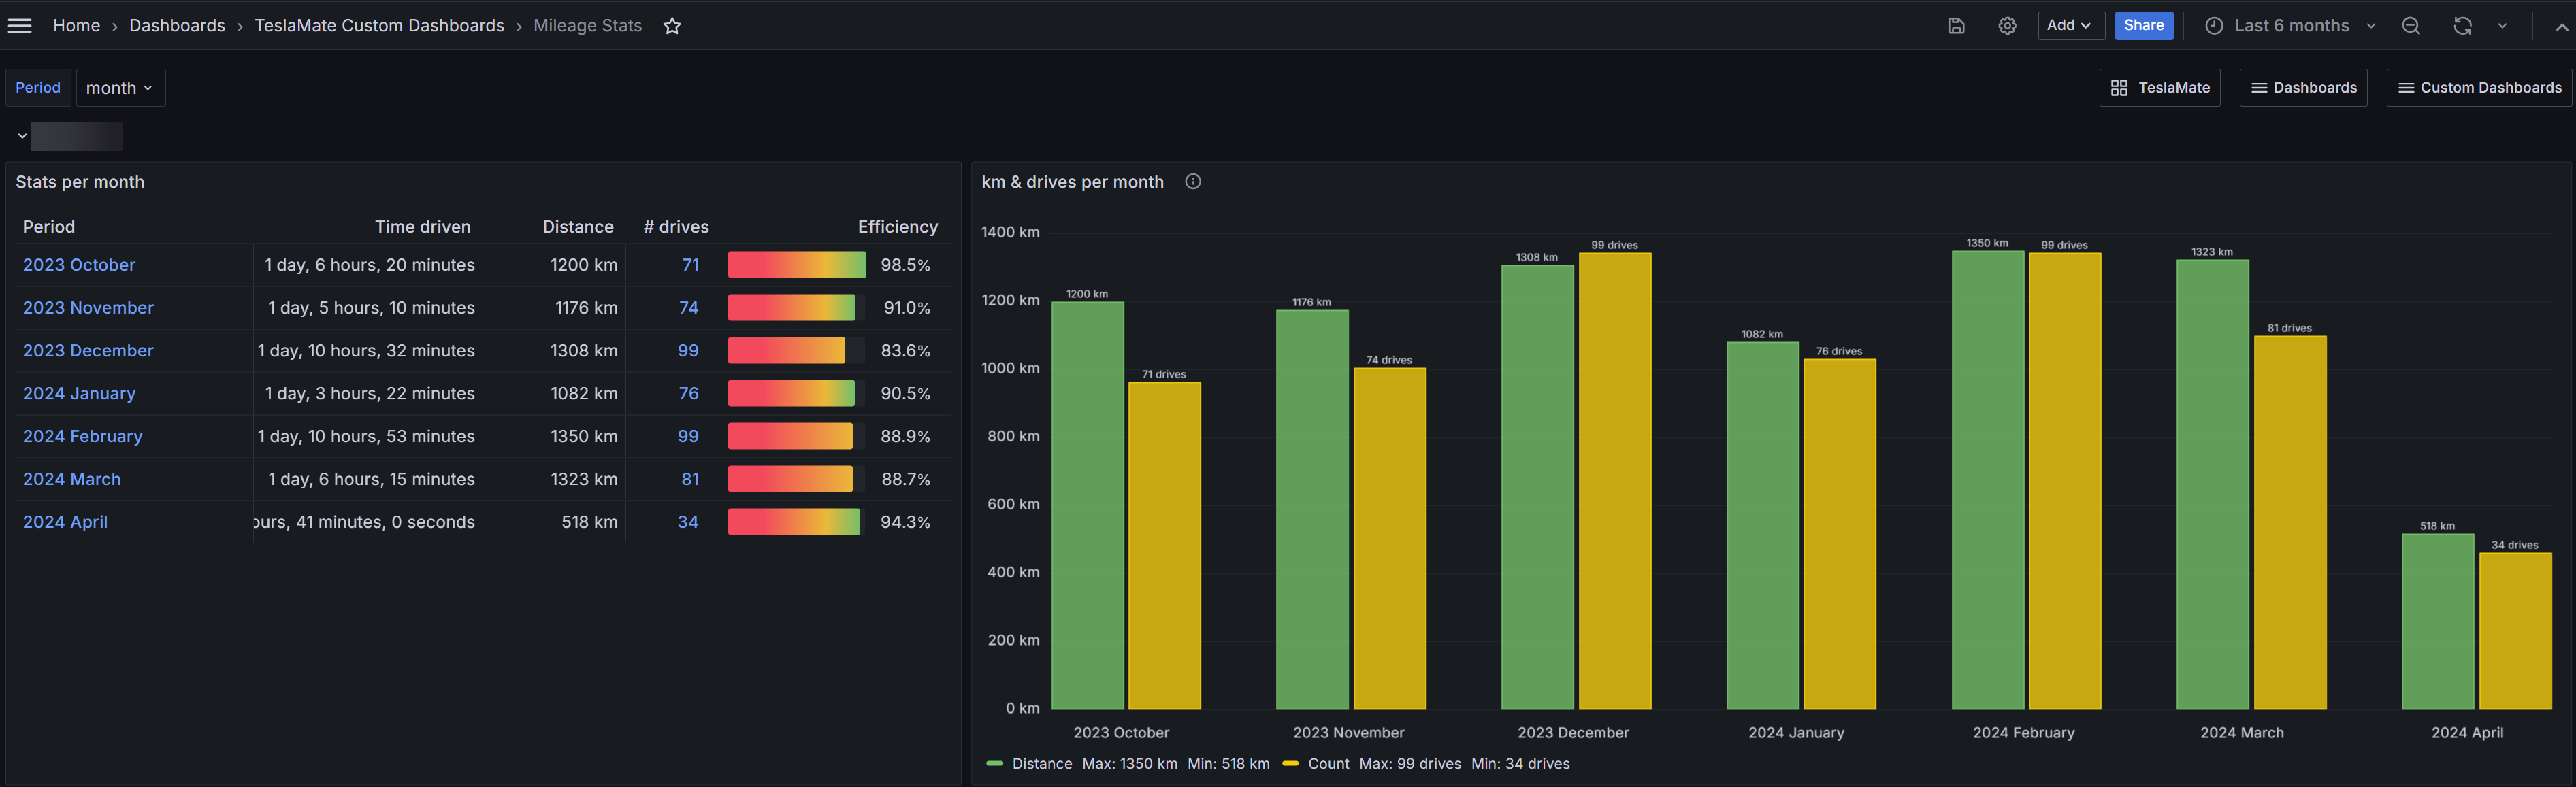
With this dashboard you may analyze your mileage and number of drives by year, month, week or day.
The dashboard shows a table with the selected period, time driven, distance, number of drives and efficiency then a bar chart to have a better look for comparison.
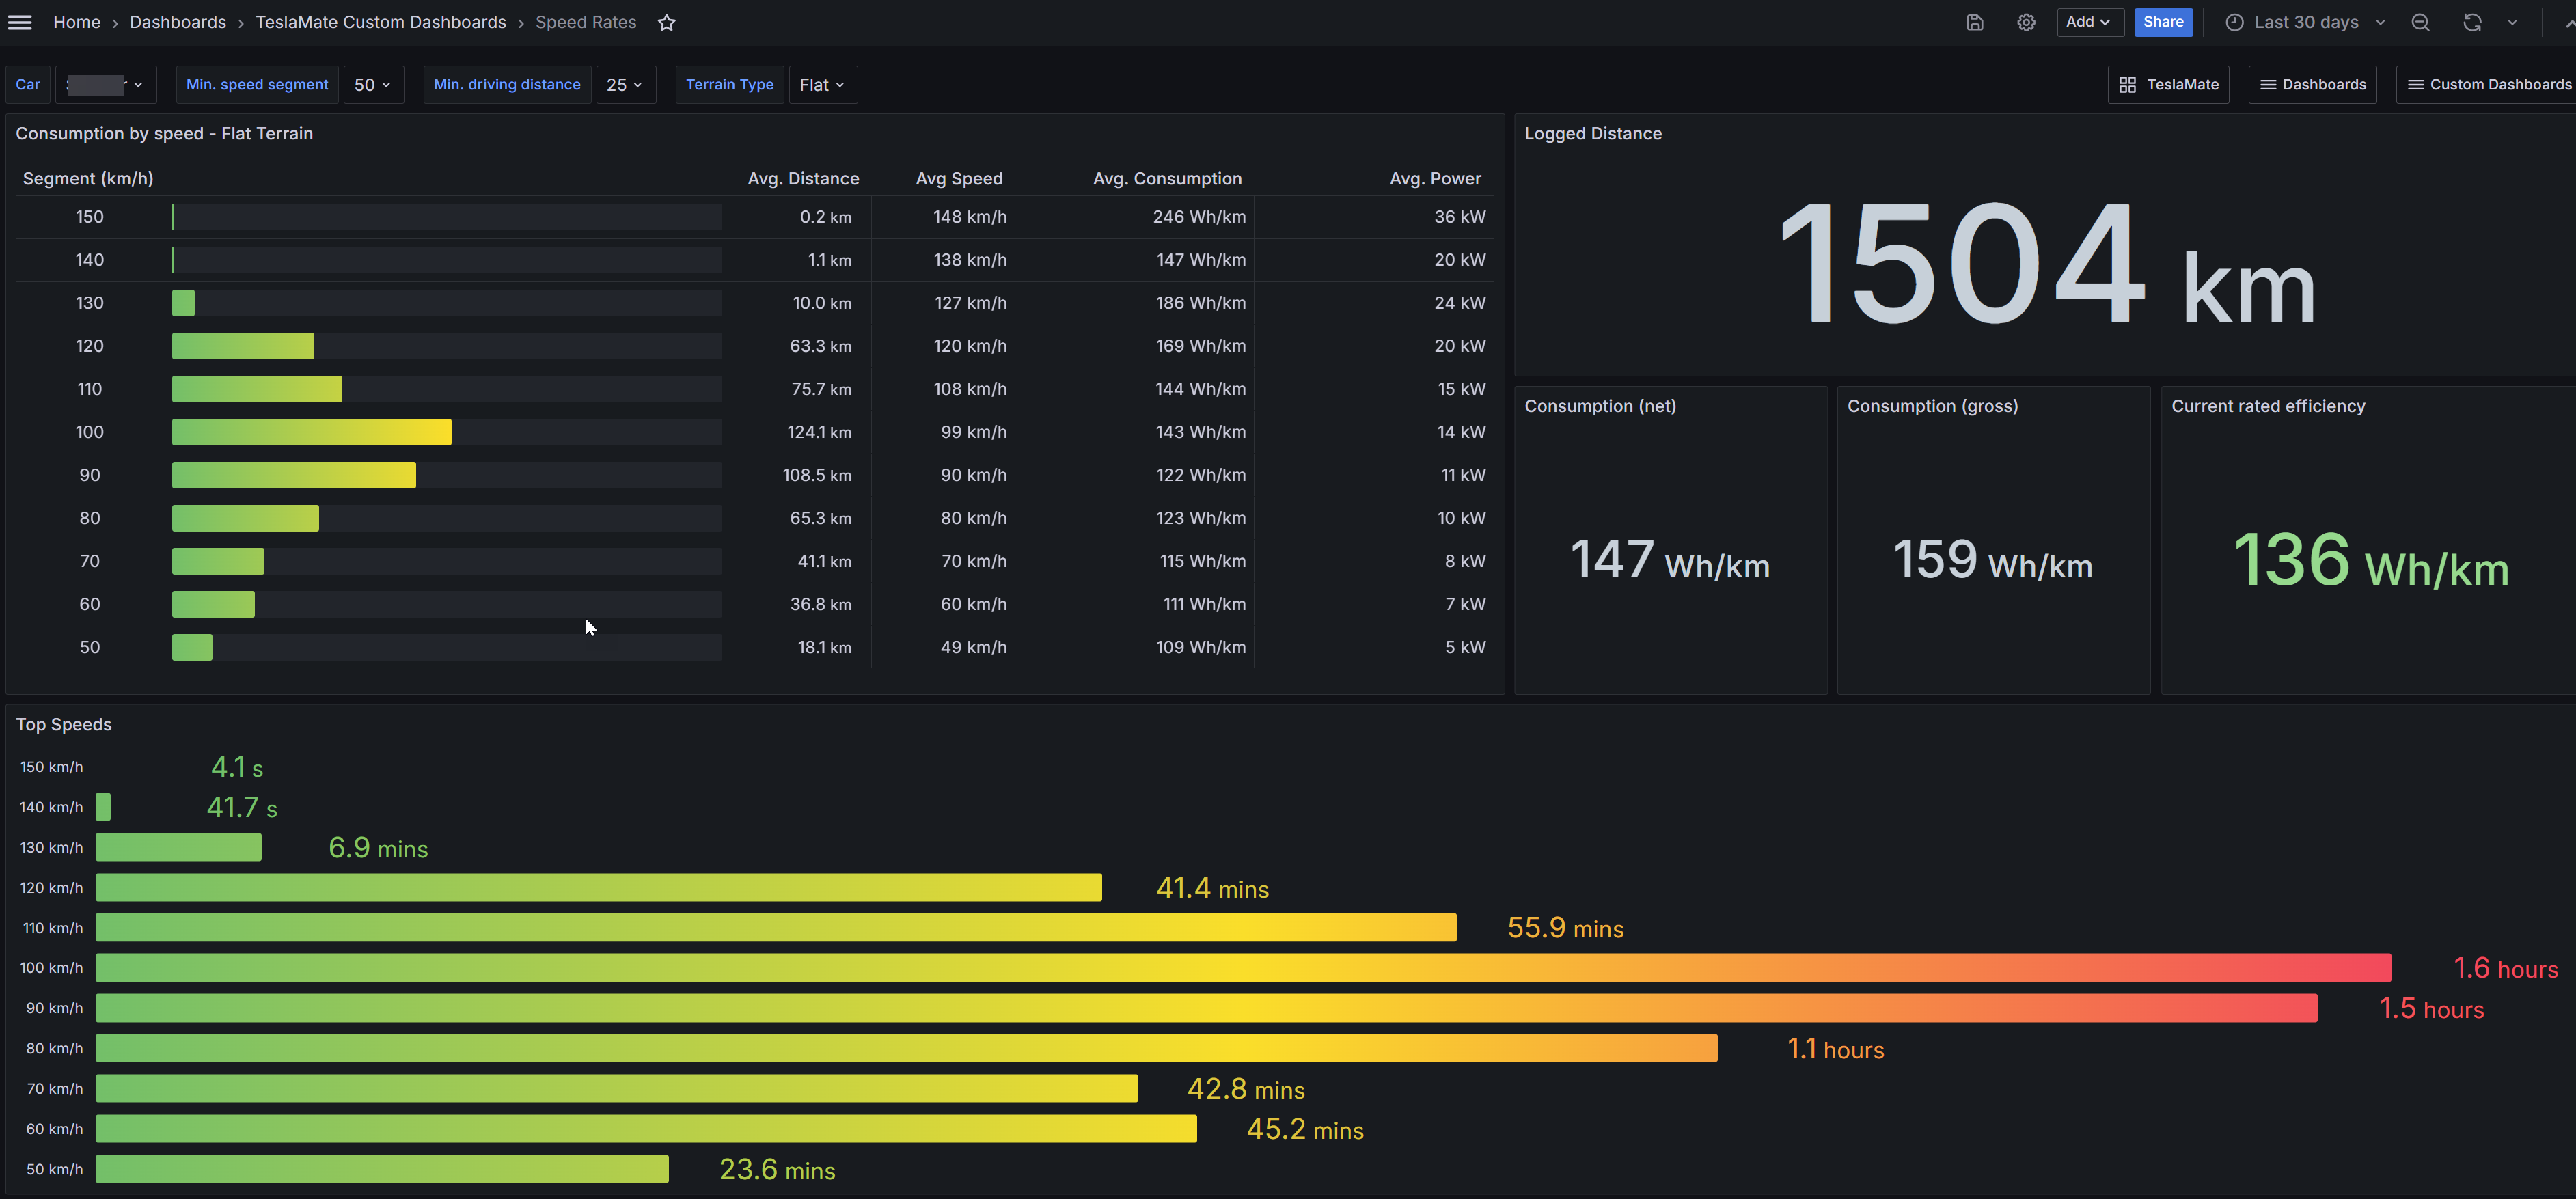
In this dashboard you can browse the speed rates by segments, based on terrain type: Flat, Uphill or Downhill. This way you can see the average consumtion by speed and its average distance. Likewise, you can see the Top speeds you reached and how long it lasted.
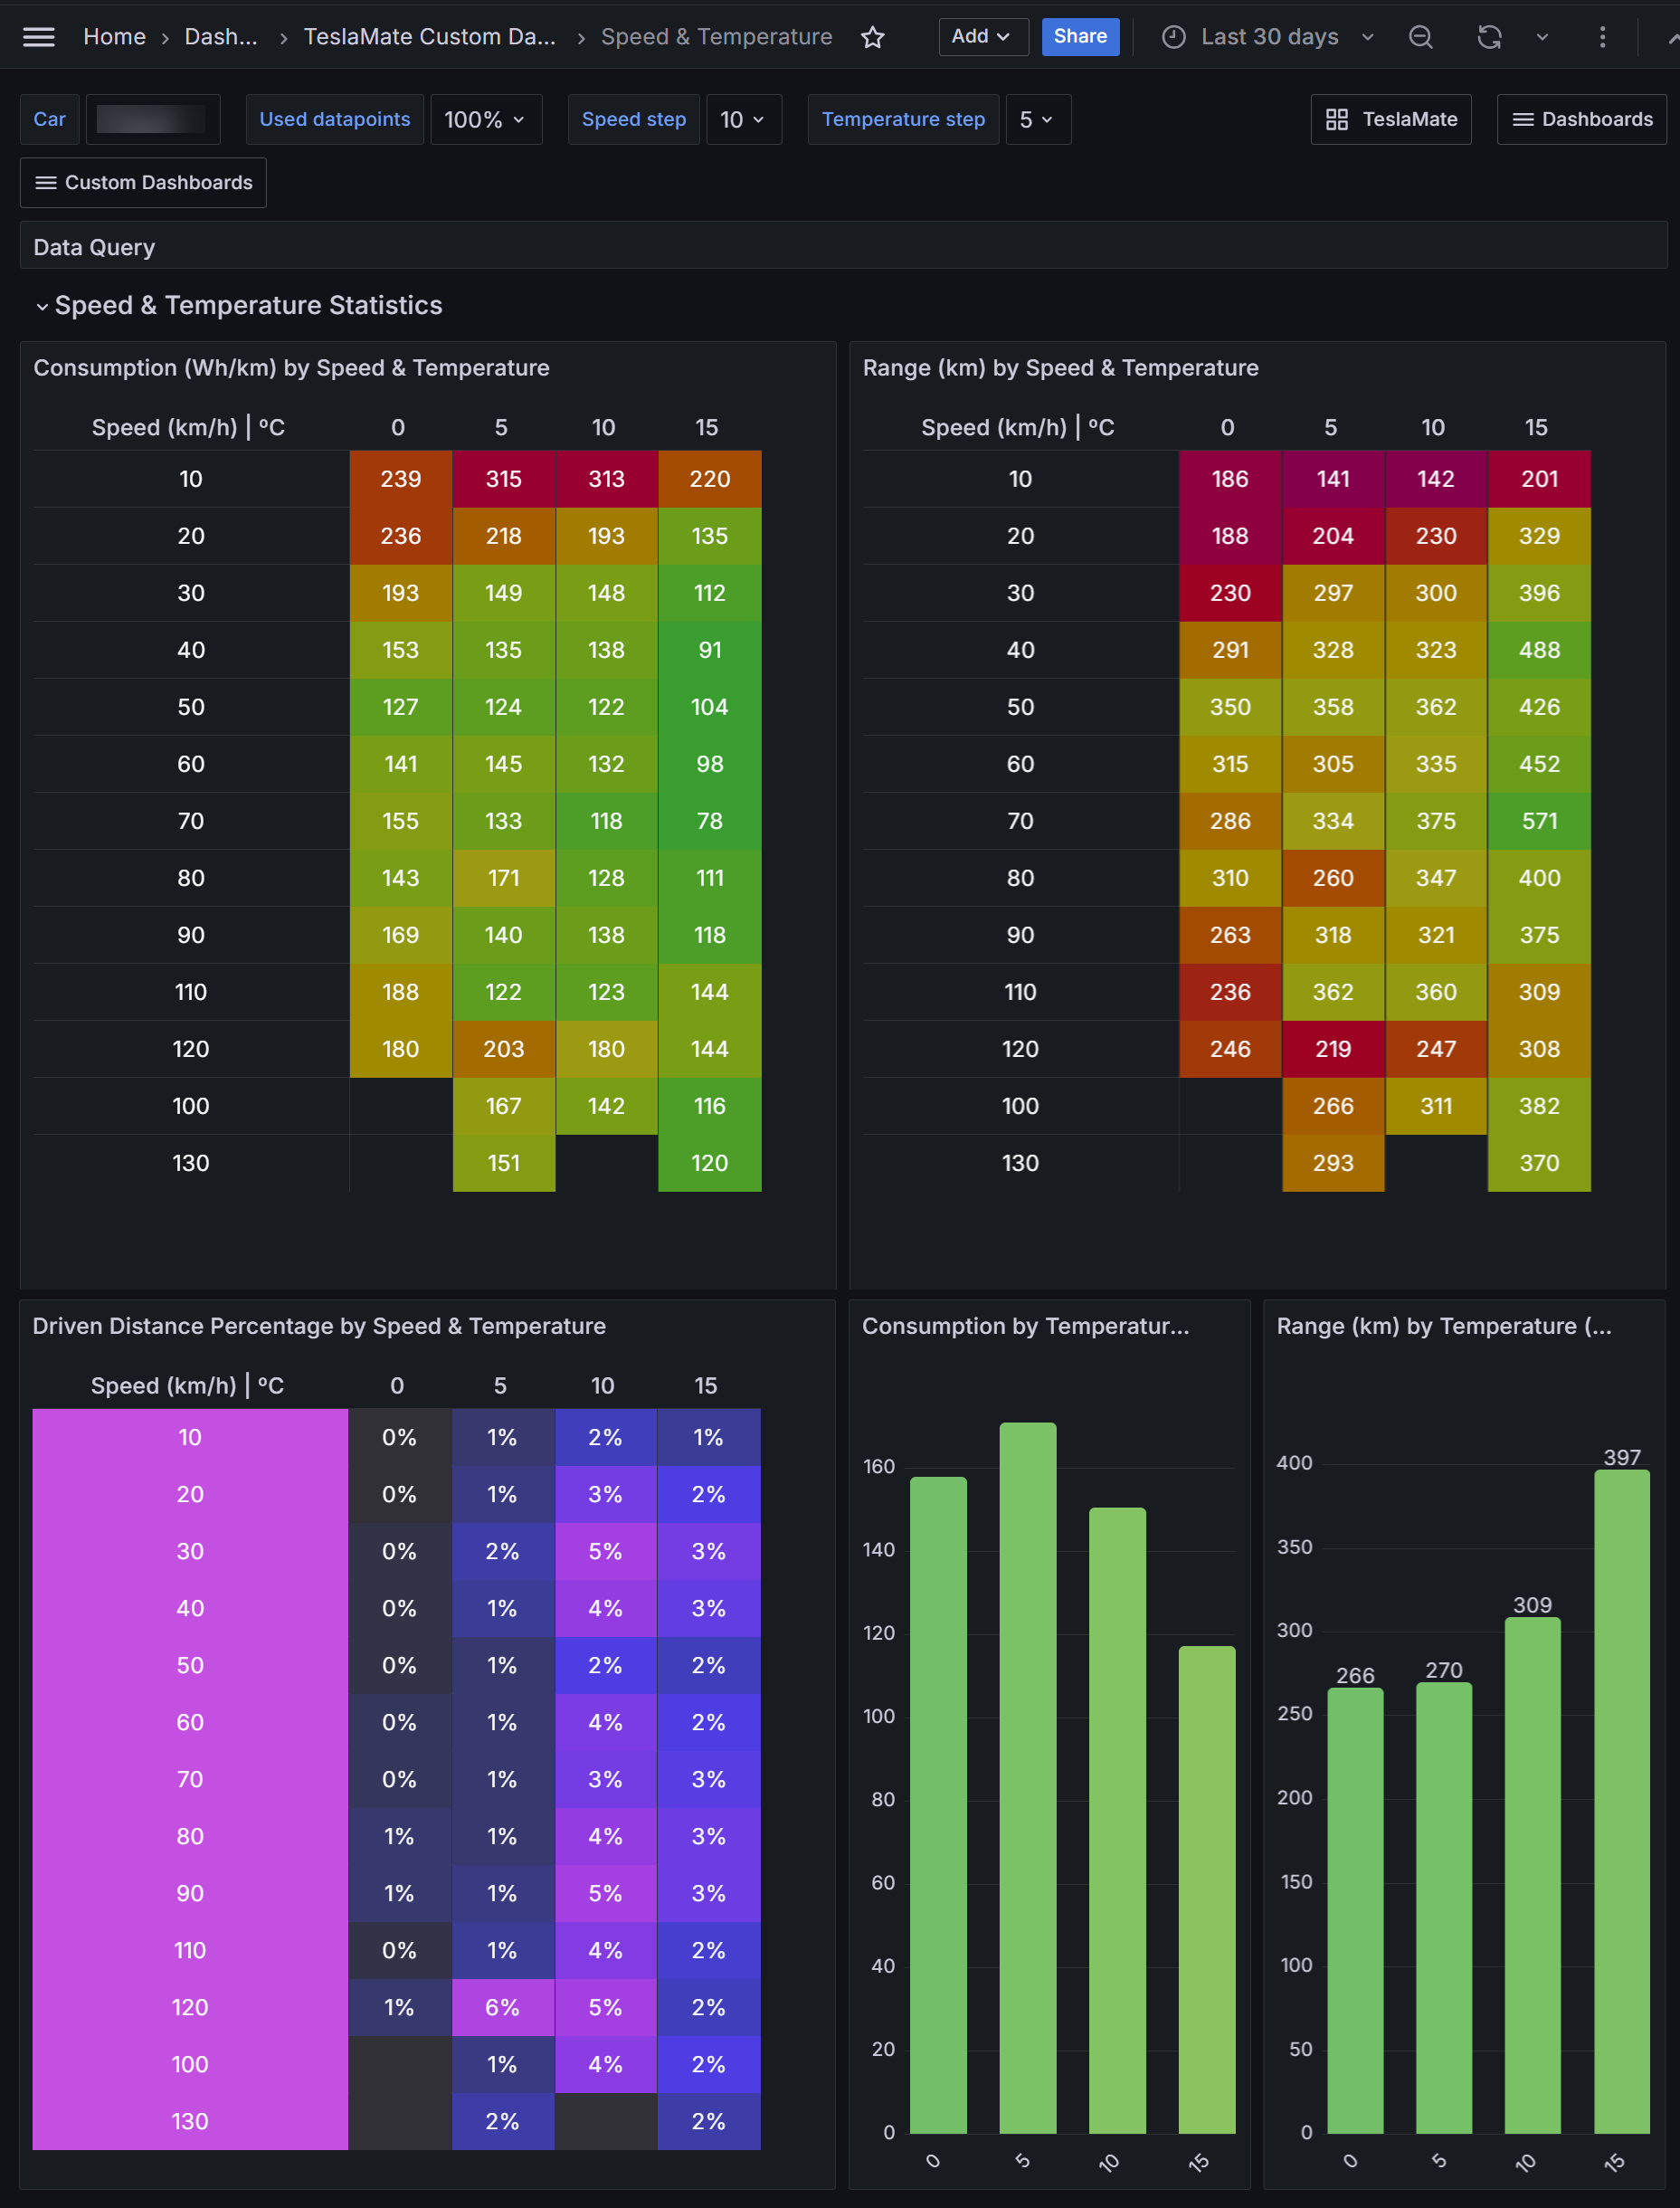
In this dashboard you can browse and analyse the car consumption by temperature in short and long stretches. This way you can see the average consumption depending on the temperature to better understand the efficiency of the car in cold or hot climates.
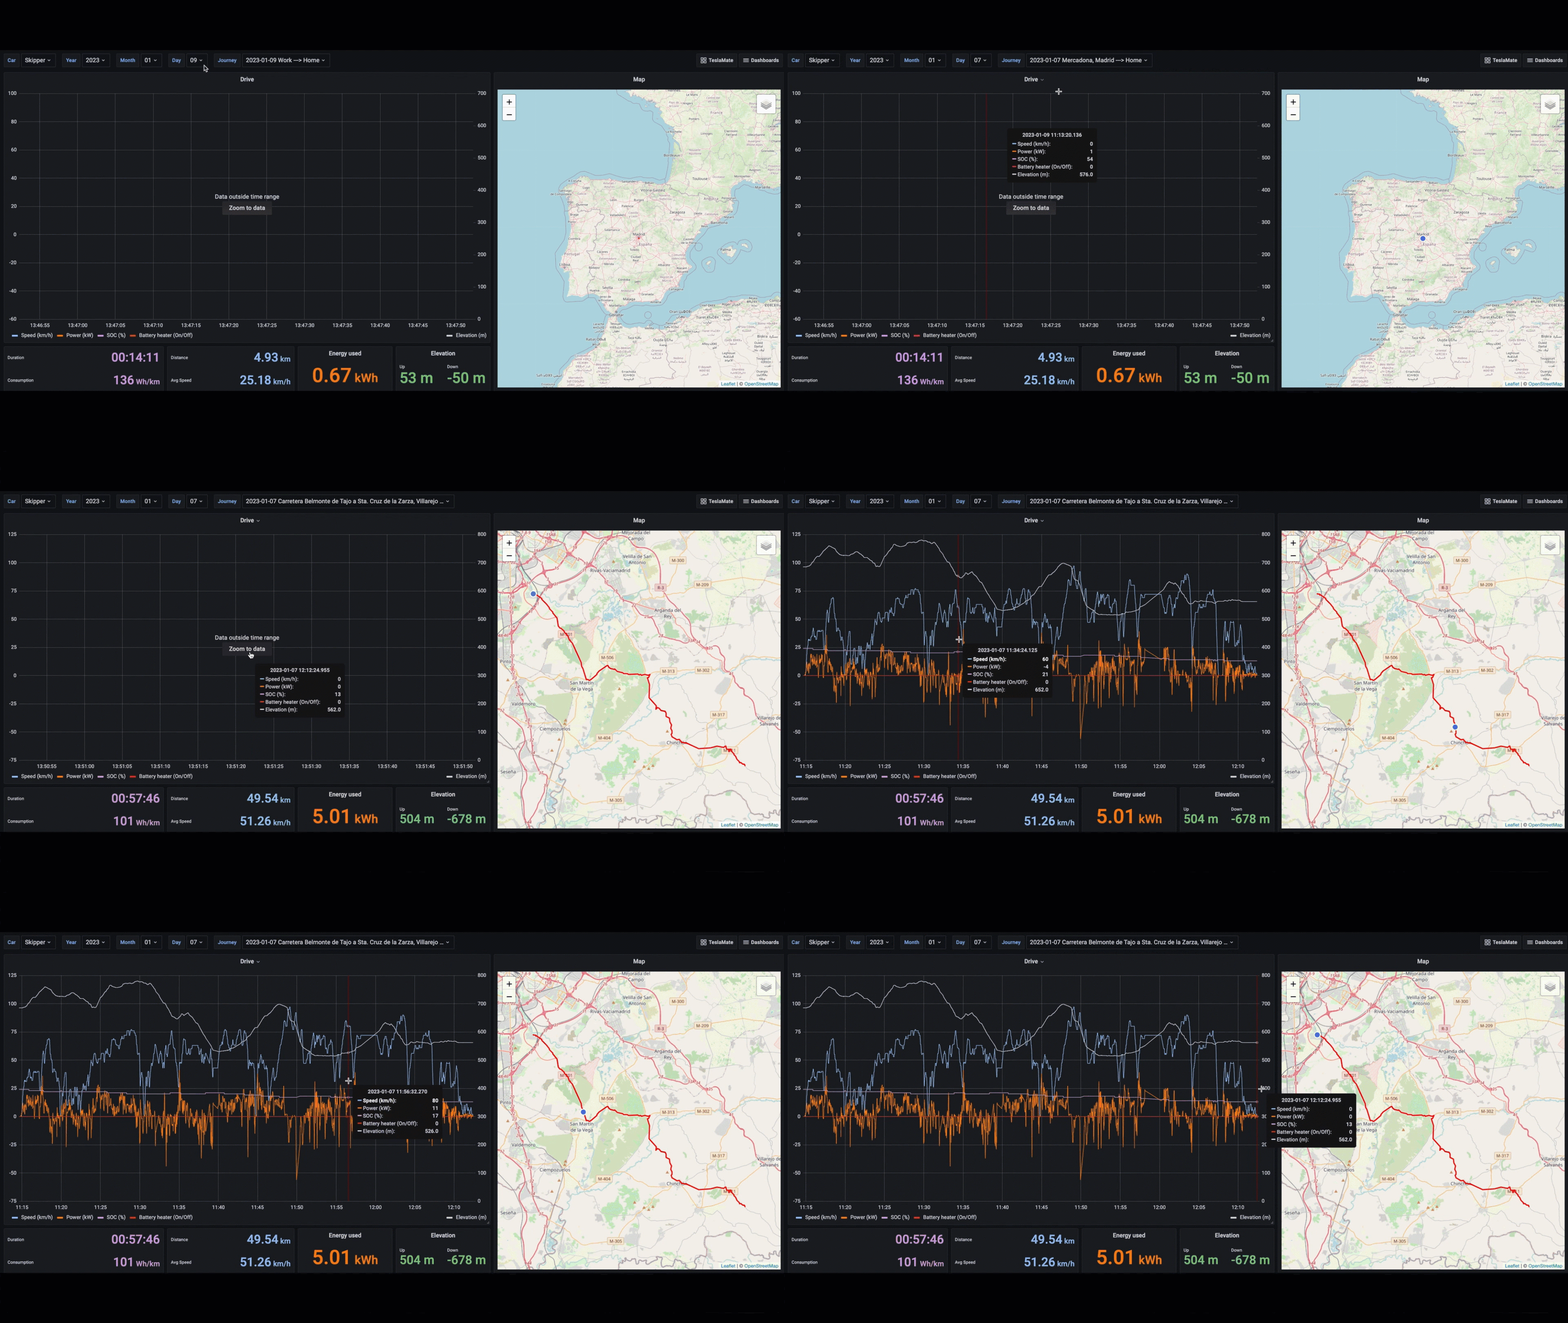
This dashboard is meant to analyze a drive based on a date you select, then you can pass the pointer over the lines in graph to see data details and a blue point in the map tranking the route. With this option you can analyze a specific point location in the map, to see the speed, power, SOC, elevation and if battery heater was on.
Be aware that the drive you select in the dropdown list from the top could be outside the time range of the Timeline graph, if its the case you have to click on the "Zoom to data" button on the graph in order to update it.
Tip: On Grafana you can press "h" to get a keyboard shortcuts if you want to change the current Zoom out time range or use the mouse to select/change the time range.
The following dashboards, queries and design are the result of many tests and hours of work. Feel free to take them for your own personal use.
Contributions are what make the open source community such an amazing place to learn, inspire, and create. Any contributions you make are greatly appreciated.
If you are able to contibute or improve this project, please fork the repository and create a pull request. I'll really apreciate any enhancement or suggestion. Don't forget to give the project a star! Thanks again!
git checkout develop)git checkout -b feature/NewFeature)git commit -m 'Add some NewFeature')git push origin feature/NewFeature)Do not take the dashboards much less upload or merge them to other repositories as if the original idea were yours, nor do you share it on social media without mentioning the author. Please, respect the ingenuity and work of others. Enjoy!
| If you like my work and want to support me, buying me a coffee would be greatly appreciated! Your support helps me to keep creating and improving these dashboards. Thank you! | |
| Other way to support me is to use my referral link to purchase a Tesla product and get Credits you can redeem for exclusive awards like Supercharging miles, merchandise, and accessories. |  |
Licensed under the MIT license.
more like this
Comprehensive analytics dashboard for AI coding agents — Cursor, Windsurf, Claude Code, VS Code Copilot, Zed, Antigravi…
YiMao · 云海求片助手 — 双核心 Telegram 影视求片机器人。订阅模式:TMDB 智能搜索一键订阅 / 趣味求片模式:AI 生成五层地狱闯关,通关解锁优先求片。深度集成 MoviePilot + Emby/Jellyfin。…
search projects, people, and tags