meine
meine 🌒 - A CLI file manager and system utility built with Textual. It combines intuitive command parsing with rich t…
Python★ 50
Interactive Mandelbrot set on GPU with Python
 jlesuffleur
git clone https://github.com/jlesuffleur/gpu_mandelbrot.gitjlesuffleur/gpu_mandelbrotfrom mandelbrot import Mandelbrot mand = Mandelbrot() # set `gpu = False` if no GPU is available
# Explore the set using interactive Matplotlib GUI
mand.explore()
# Draw an image and save it to file
mand.draw('mandelbrot.png')
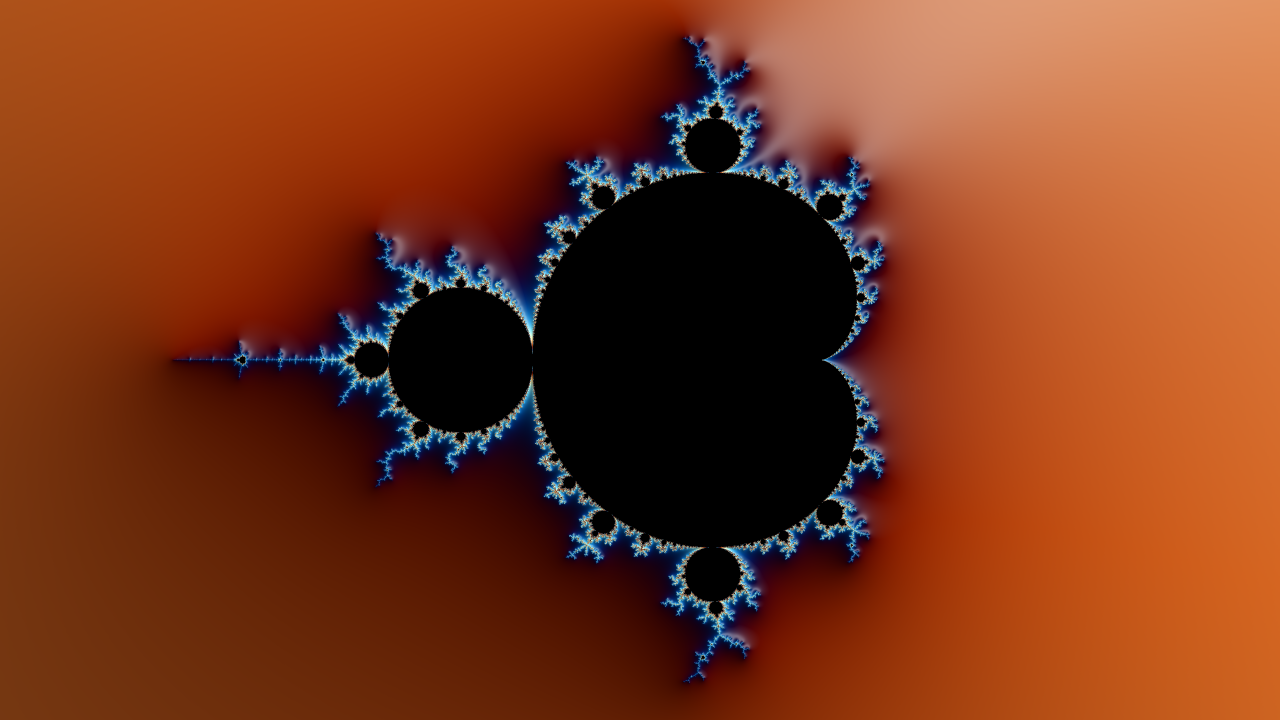
# We decrease the image size to avoid overloading git and the readme page
# We also increase the number of iterations, and add stripe coloring
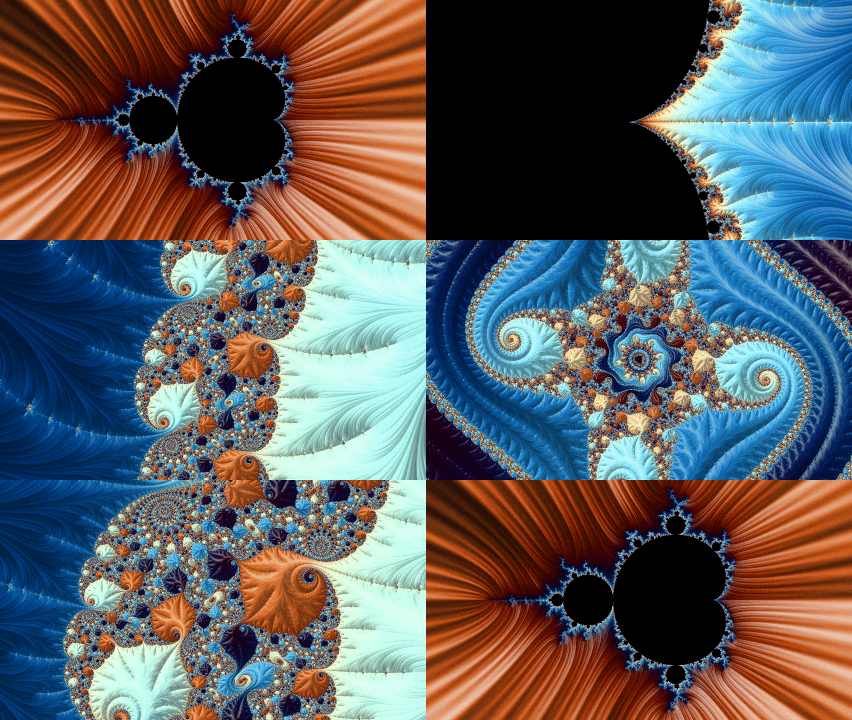
mand = Mandelbrot(maxiter = 5000, xpixels = 426, stripe_s = 5)
# Point to zoom at
x_real = -1.749705768080503
x_imag = -6.13369029080495e-05
mand.animate(x_real, x_imag, 'mandelbrot.gif')
Use the following command from terminal to launch a GUI with default parameters:
python ./mandelbrot.py
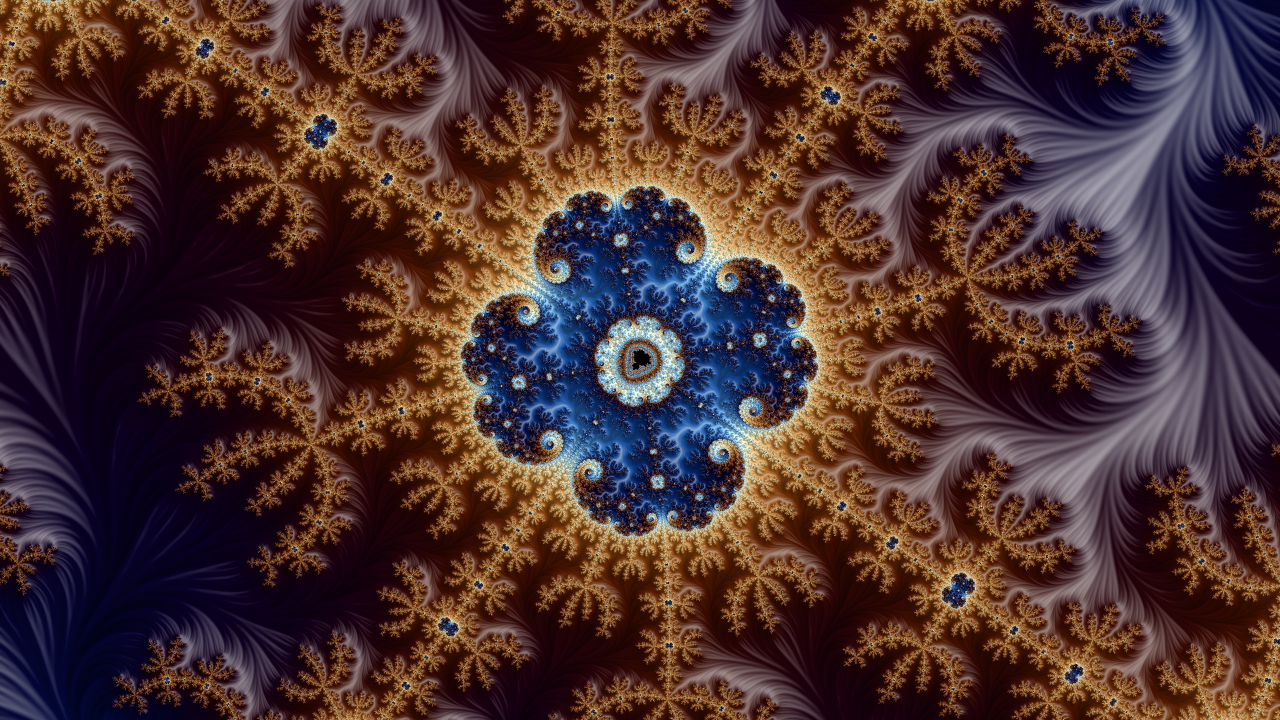
Some examples of HD images, and corresponding code:
mand = Mandelbrot(maxiter = 5000, rgb_thetas = [.11, .02, .92], stripe_s = 2,
                  coord = [-0.5503295086752807,
                           -0.5503293049351449,
                           -0.6259346555912755,
                           -0.625934541001796])
mand.draw('crown.png')
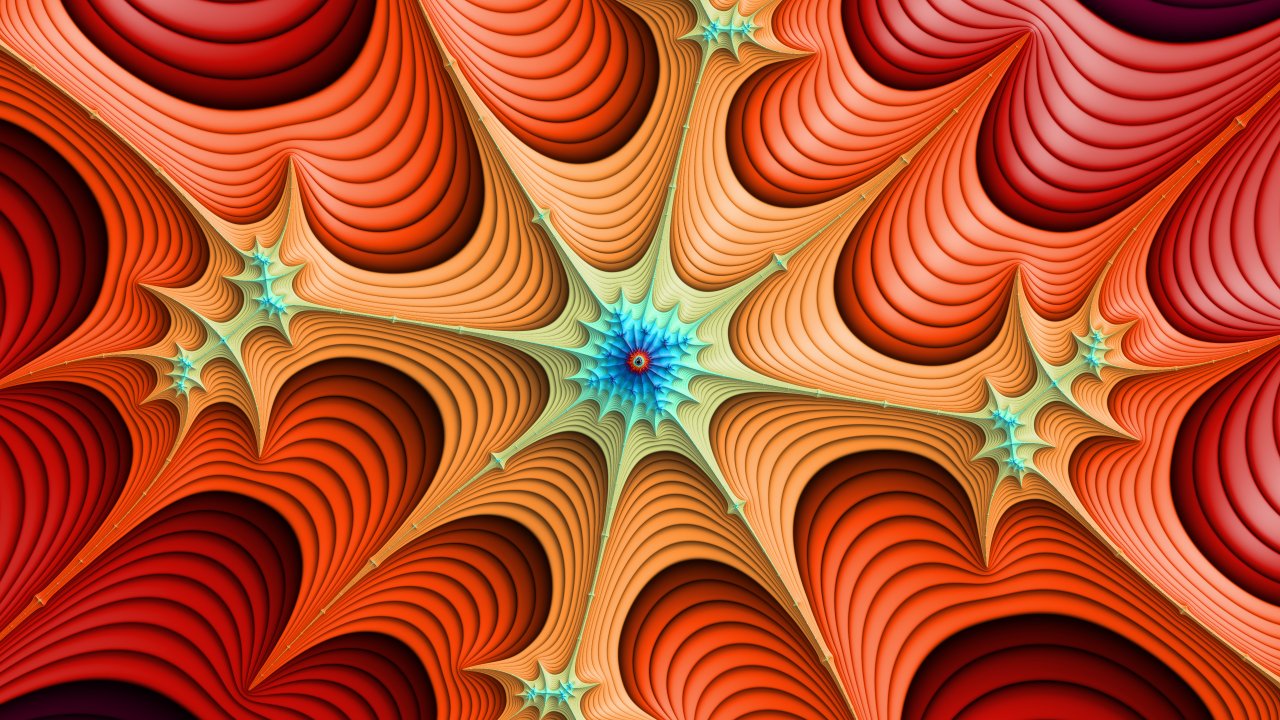
mand = Mandelbrot(maxiter = 5000, rgb_thetas = [.29, .02, 0.9], ncycle = 8,
                  step_s = 10,
                  coord = [-1.9854527029227764,
                           -1.9854527027615938,
                           0.00019009159314173224,
                           0.00019009168379912058])
mand.draw('pow.png')
mand = Mandelbrot(maxiter = 5000, rgb_thetas = [.83, .01, .99], stripe_s = 5,
                  coord = [-1.749289287806423,
                           -1.7492892878054118,
                           -1.8709586016347623e-06,
                           -1.8709580332005737e-06])
mand.draw('octogone.png')
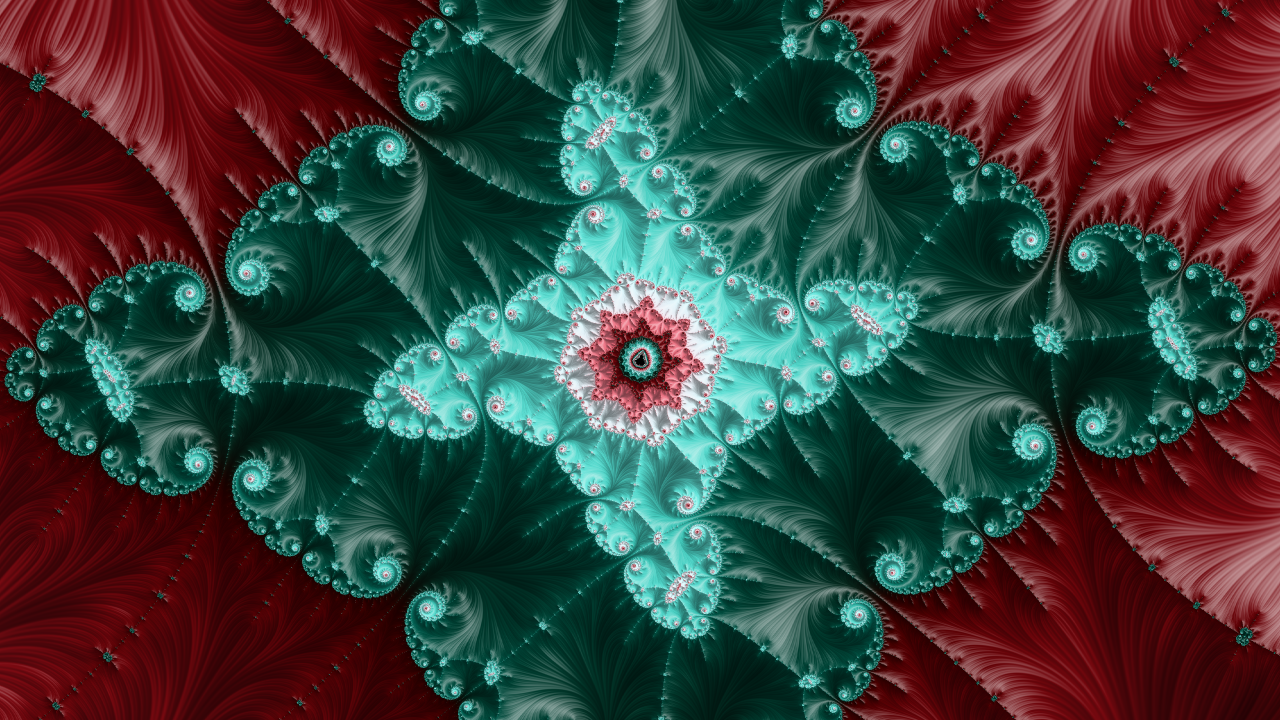
mand = Mandelbrot(maxiter = 5000, rgb_thetas = [.87, .83, .77],
                  coord = [-1.9415524417847085,
                           -1.9415524394561112,
                           0.00013385928801614168,
                           0.00013386059768851223])
mand.draw('julia.png')
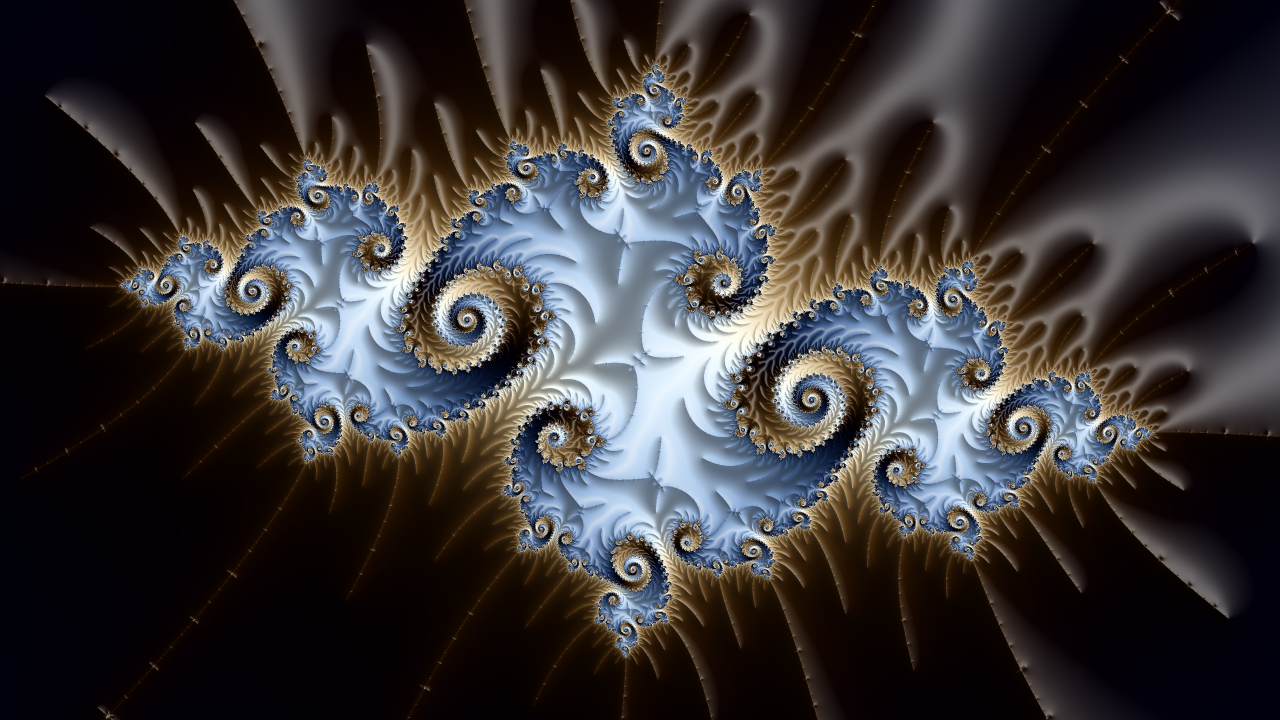
mand = Mandelbrot(maxiter = 5000, rgb_thetas = [.54, .38, .35], stripe_s = 8,
                  coord = [-0.19569582393630502,
                           -0.19569331188751315,
                           1.1000276413181806,
                           1.10002905416902])
mand.draw('lightning.png')
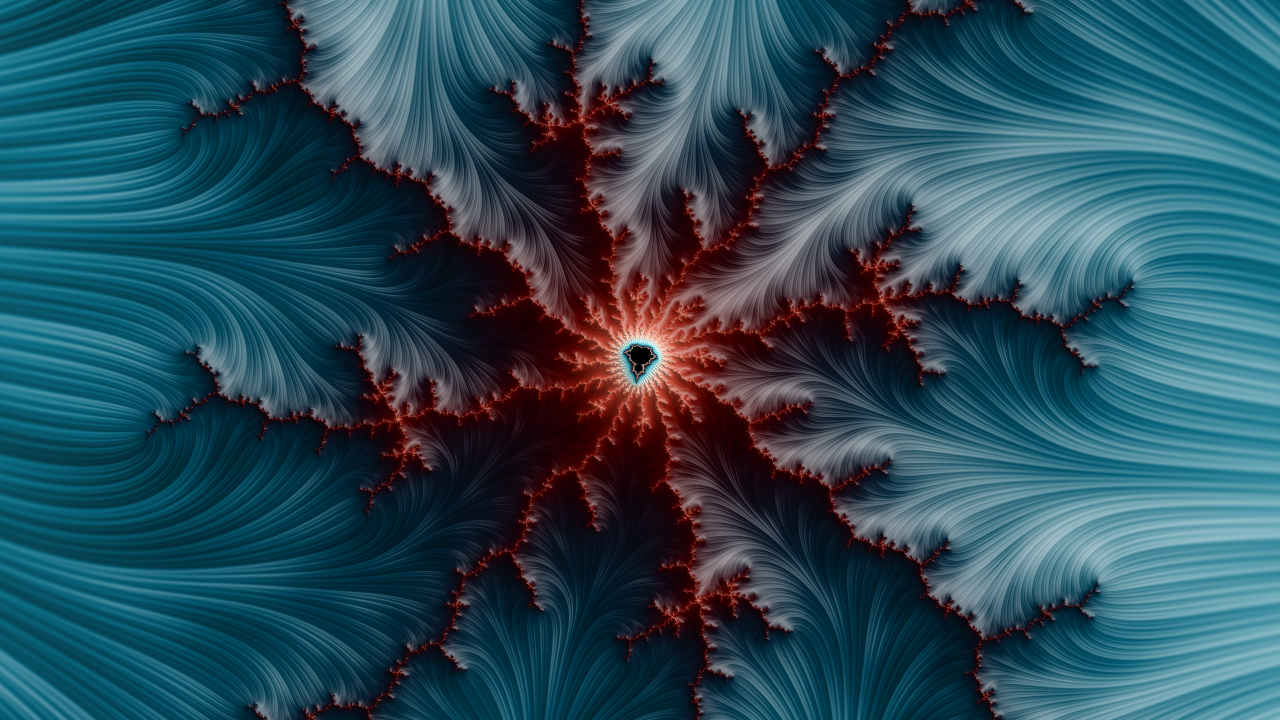
mand = Mandelbrot(maxiter = 5000, rgb_thetas = [.47, .51, .63], step_s = 20,
                  coord = [-1.7497082019887222,
                           -1.749708201971718,
                           -1.3693697170765535e-07,
                           -1.369274301311596e-07])
mand.draw('web.png')
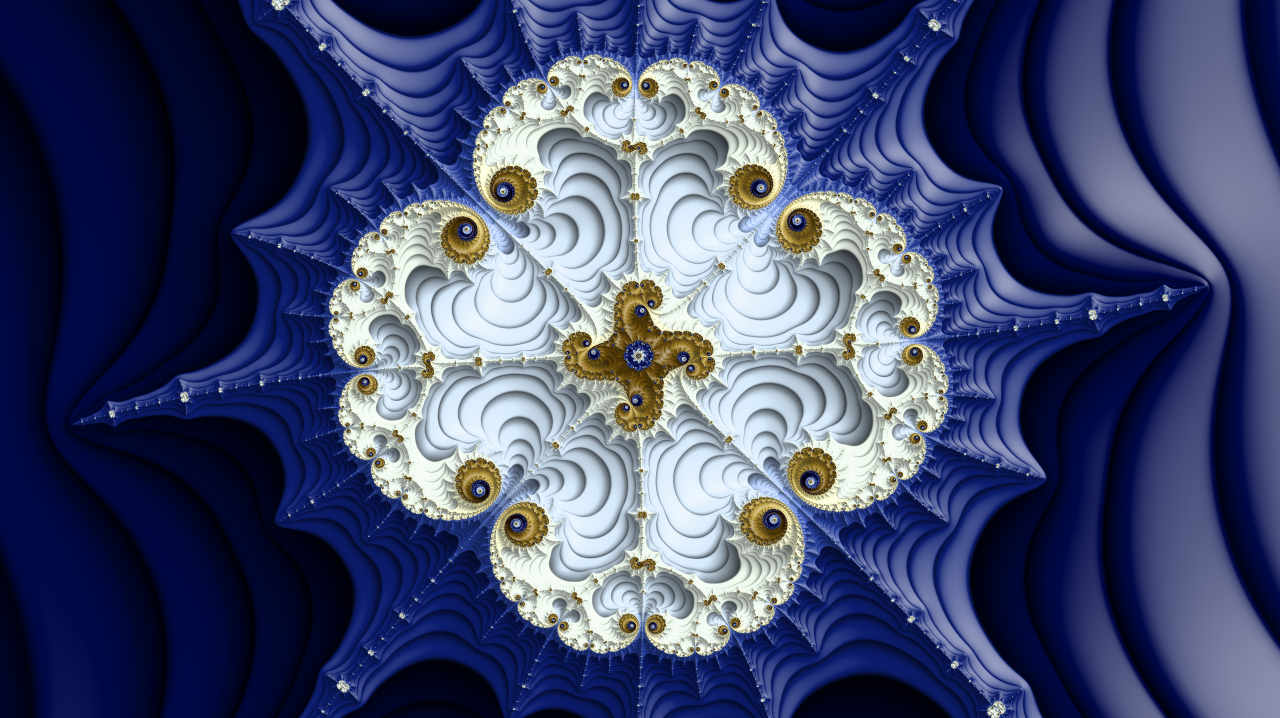
mand = Mandelbrot(maxiter = 5000, rgb_thetas = [.6, .57, .45], stripe_s = 12,
                  coord = [-1.8605721473418524,
                           -1.860572147340747,
                           -3.1800170324714687e-06,
                           -3.180016406837821e-06])
mand.draw('wave.png')
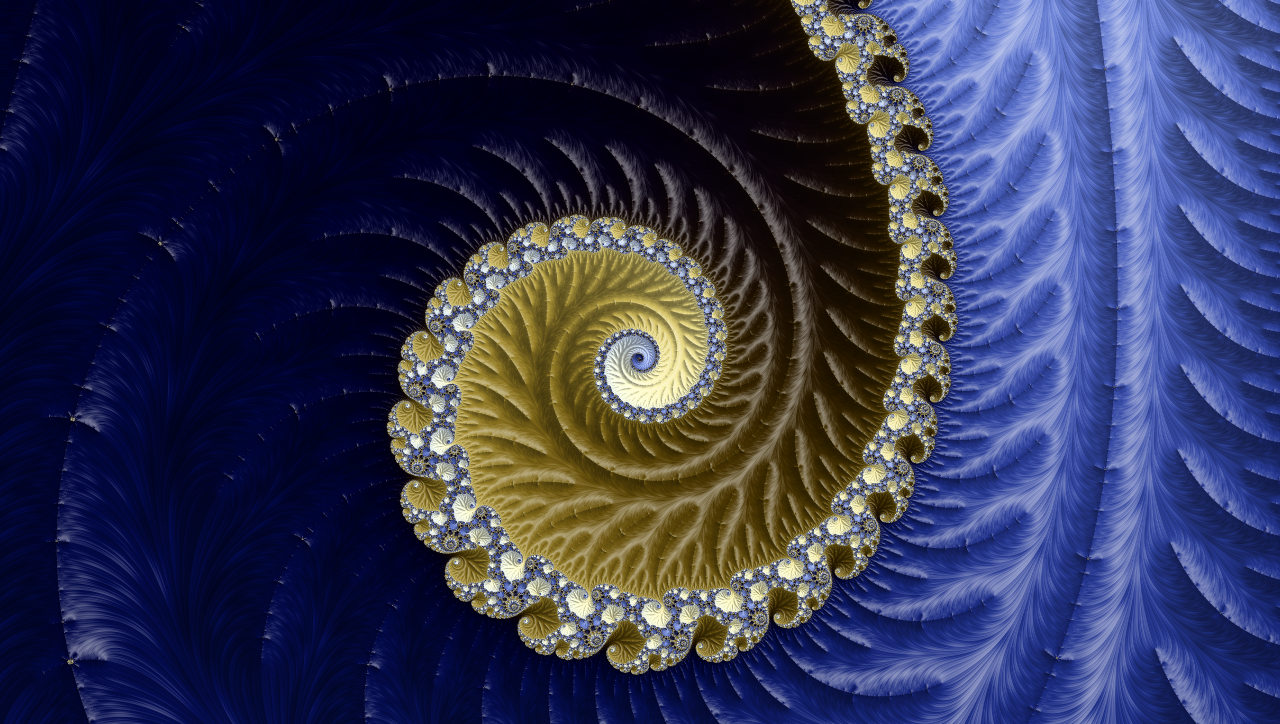
mand = Mandelbrot(maxiter = 5000, rgb_thetas = [.63, .83, .98],
                  coord = [-0.7545217835886875,
                           -0.7544770820676441,
                           0.05716740181493137,
                           0.05719254327783547])
mand.draw('tiles.png')
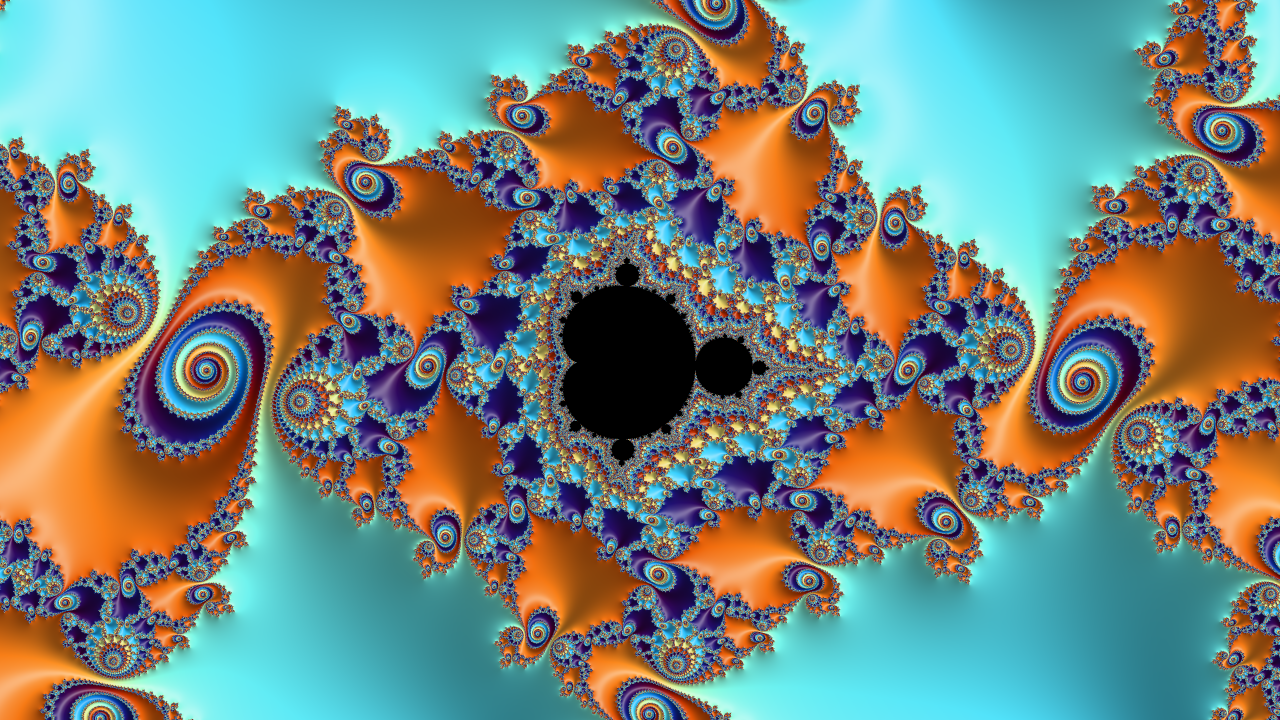
mand = Mandelbrot(maxiter = 5000, rgb_thetas = [.29, .52, .59], stripe_s = 5,
                  coord = [-1.6241199193994318,
                           -1.624119919281773,
                           -0.00013088931048083944,
                           -0.0001308892443058033])
mand.draw('velvet.png')
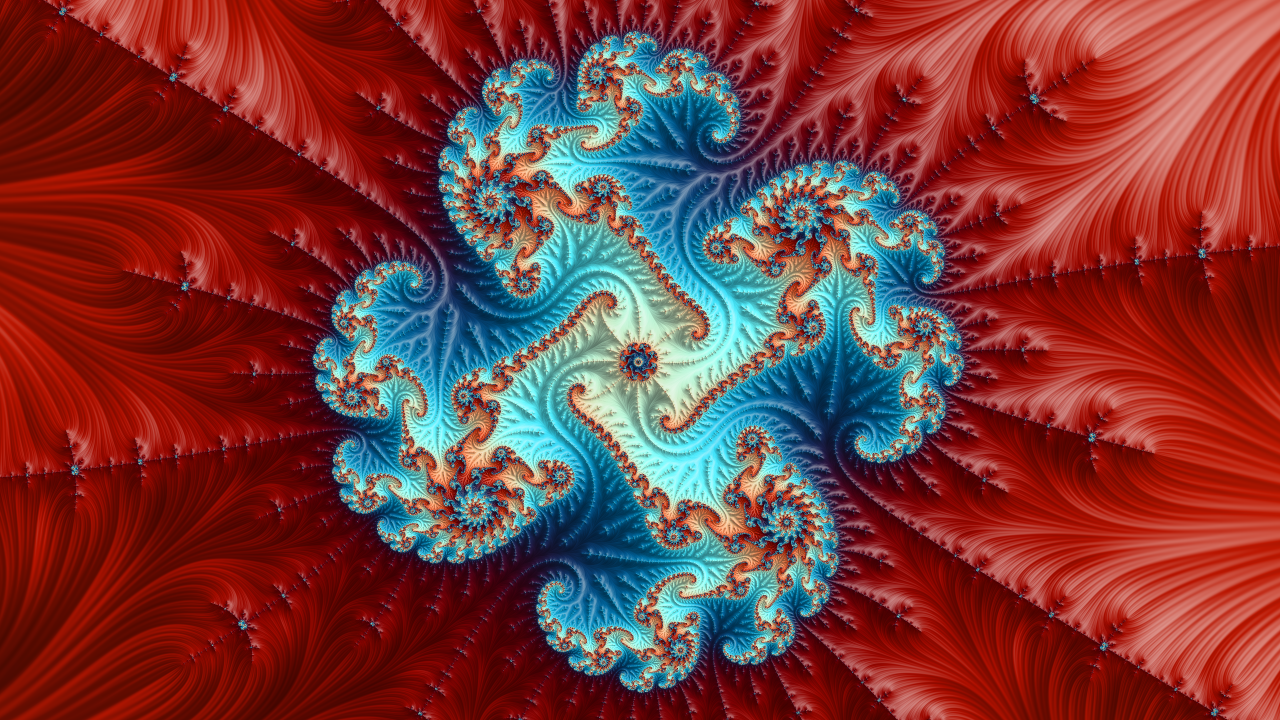
Computing a sequence of 100 frames of HD pictures (1280*720 pixels), with 2000 iterations takes approximately 1 second on a Tesla K80 GPU.
more like this
meine 🌒 - A CLI file manager and system utility built with Textual. It combines intuitive command parsing with rich t…
Launcher and management utility for running an Astroneer Dedicated Server on Linux using WINE
Iterated Dynamics is a fractal renderer with support for many fractal types and extensive context-sensitive help.
search projects, people, and tags