emby-watchparty
A synchronized watch party application for Emby media servers. Watch videos together with friends in real-time, no matt…
Python★ 51
Visualizer for pandas data structures
 man-group
git clone https://github.com/man-group/dtale.gitman-group/dtale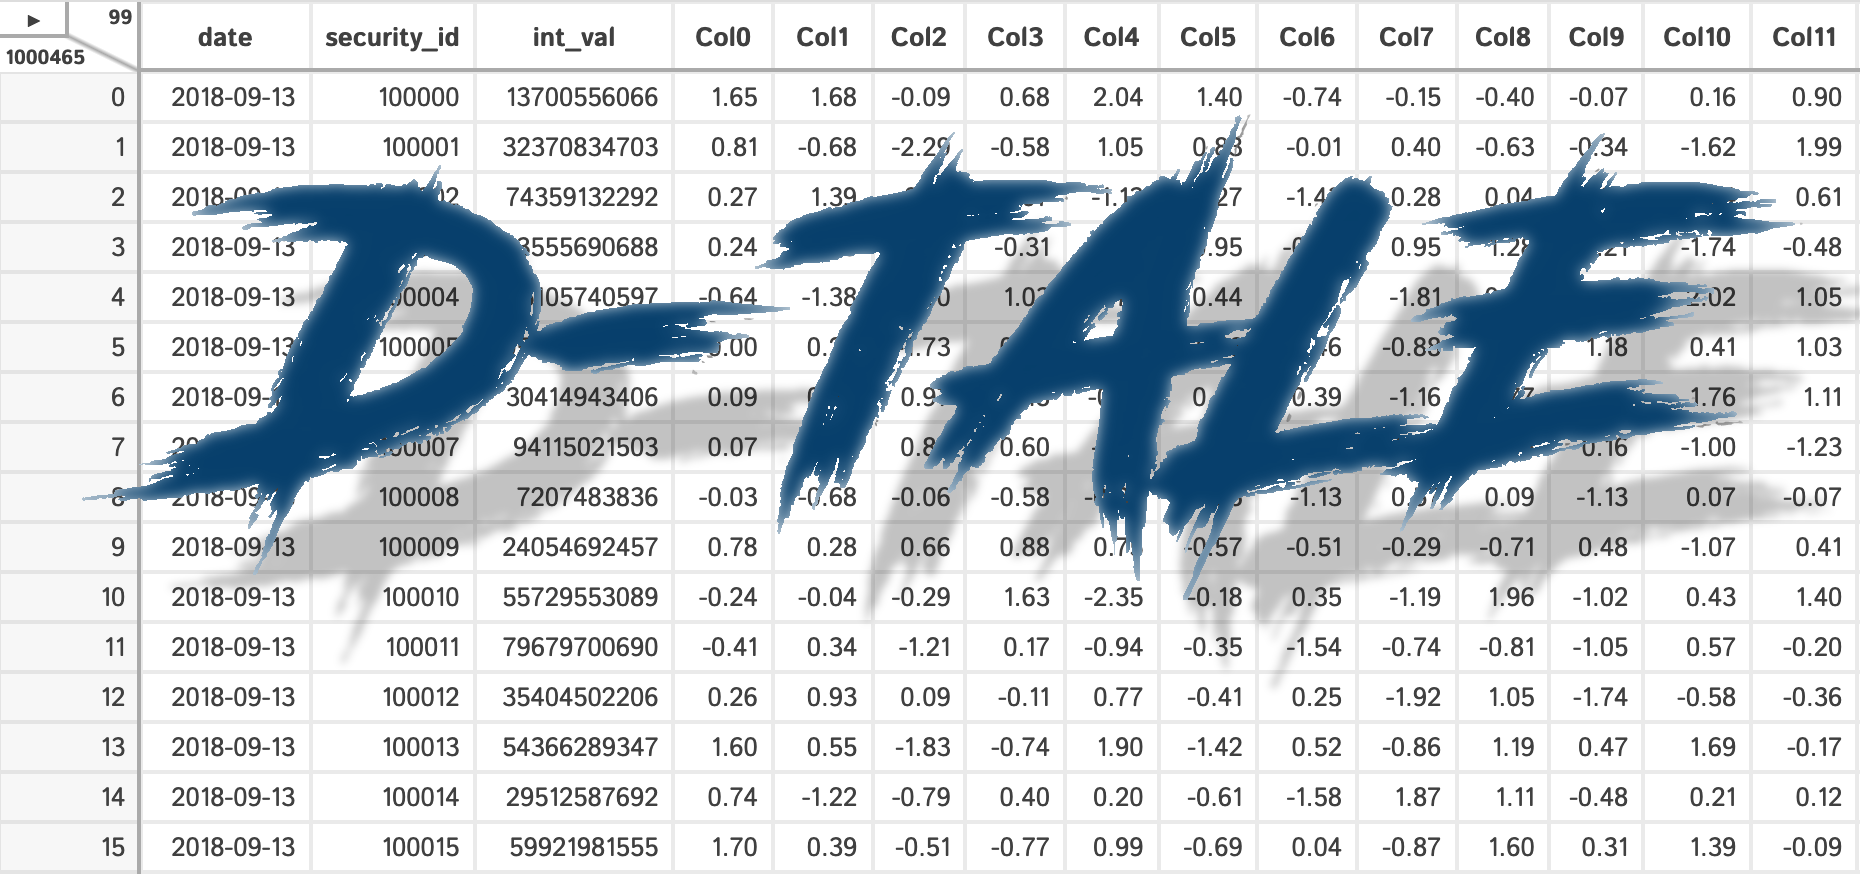
D-Tale is the combination of a Flask back-end and a React front-end to bring you an easy way to view & analyze Pandas data structures. It integrates seamlessly with ipython notebooks & python/ipython terminals. Currently this tool supports such Pandas objects as DataFrame, Series, MultiIndex, DatetimeIndex & RangeIndex.
D-Tale was the product of a SAS to Python conversion. What was originally a perl script wrapper on top of SAS's insight function is now a lightweight web client on top of Pandas data structures.
The source code is currently hosted on GitHub at: https://github.com/man-group/dtale
Binary installers for the latest released version are available at the Python package index and on conda using conda-forge.
# conda
conda install dtale -c conda-forge
# if you want to also use "Export to PNG" for charts
conda install -c plotly python-kaleido
# or PyPI
pip install dtale
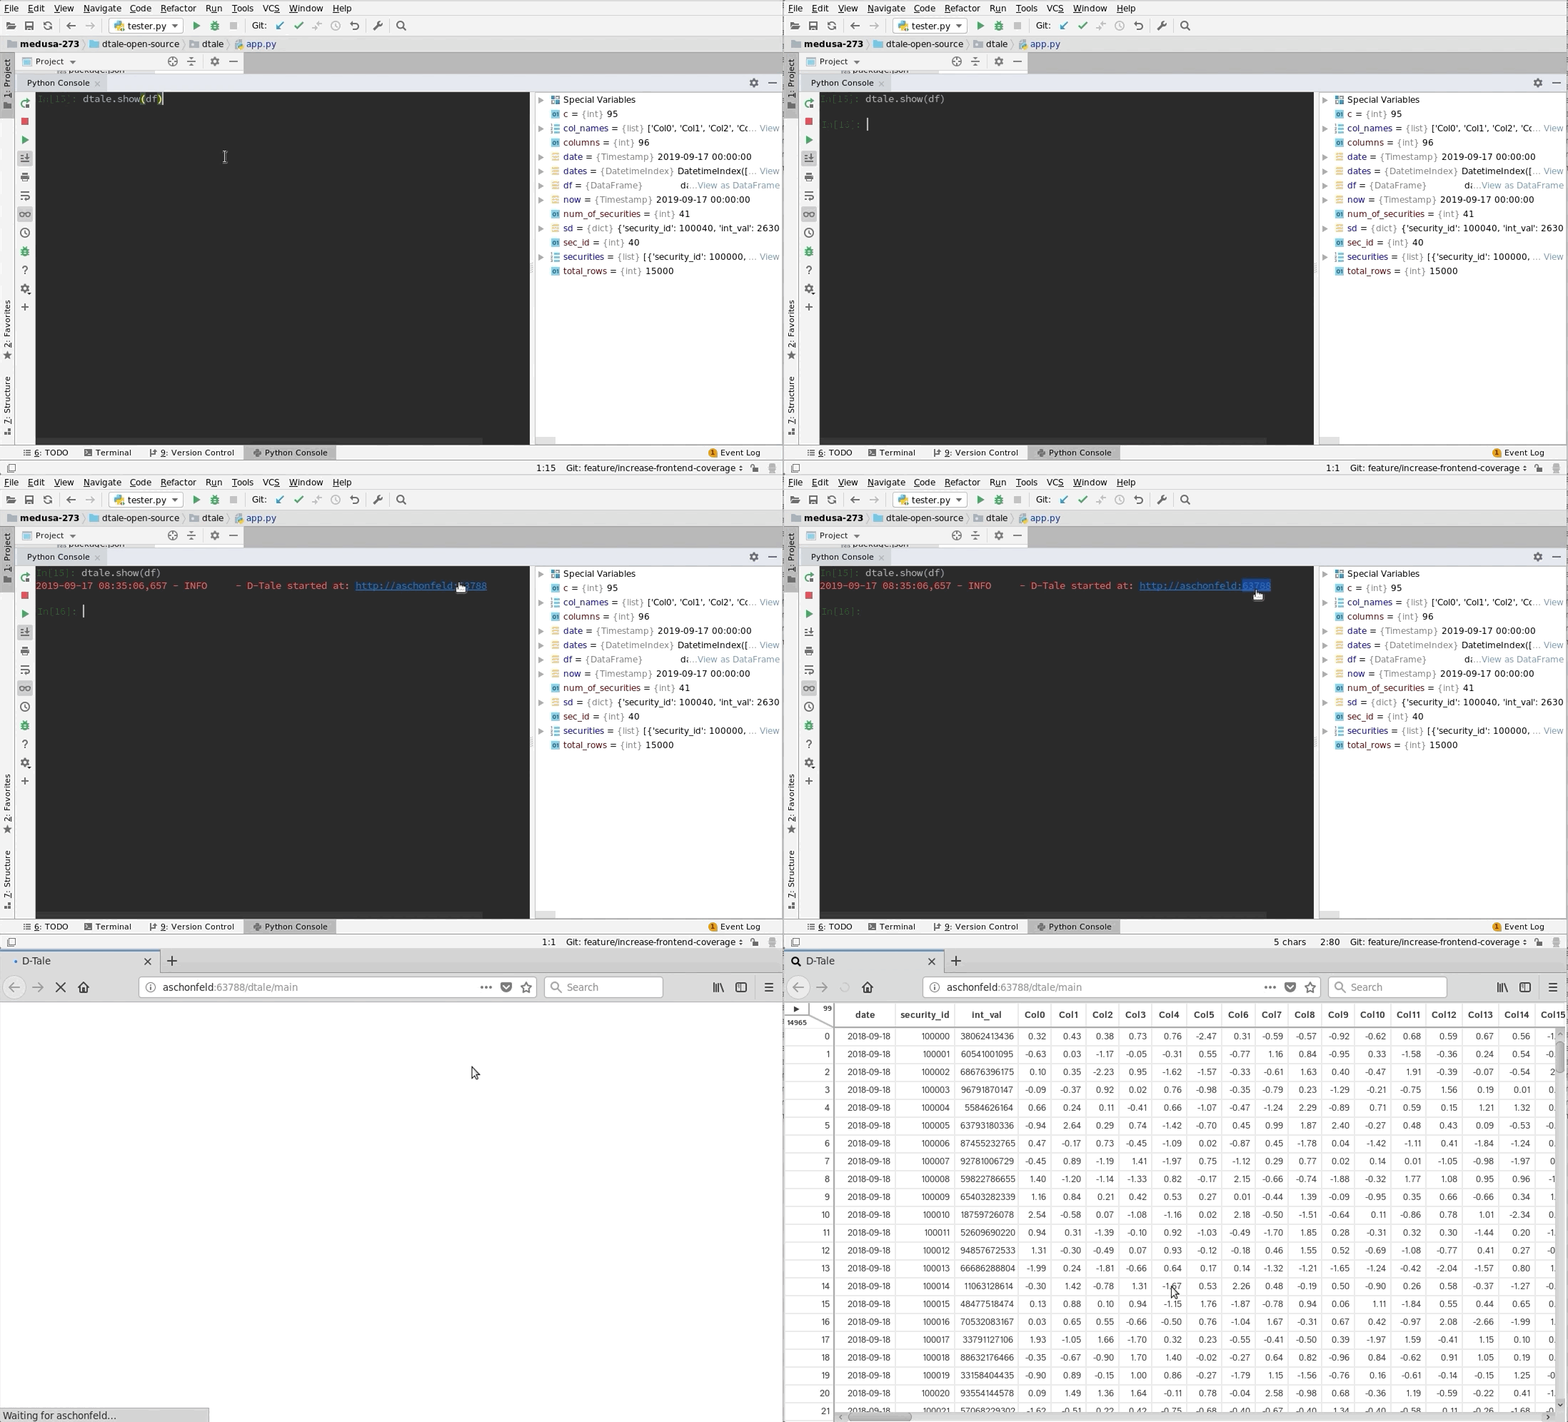
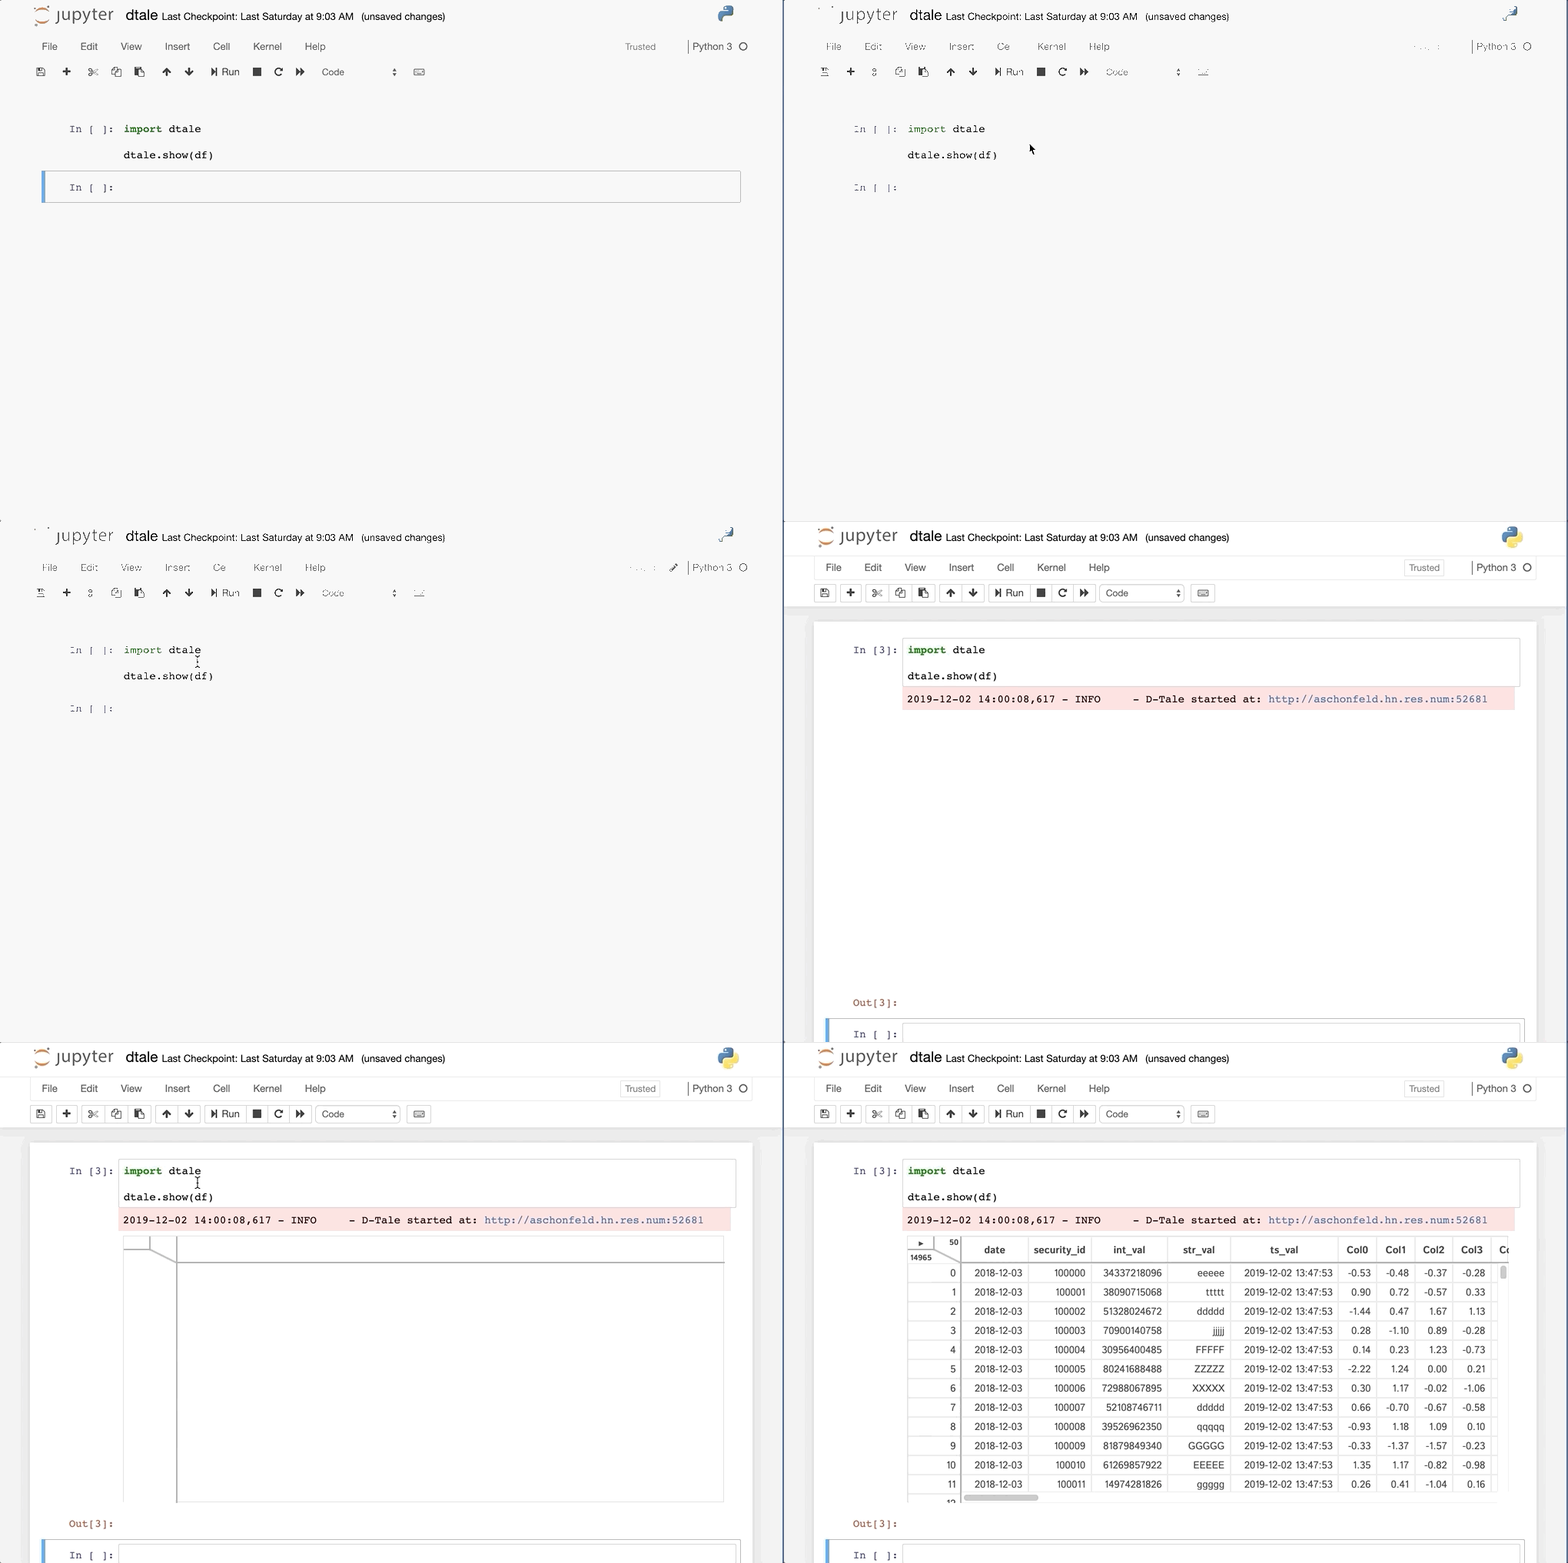
| PyCharm | jupyter |
|---|---|
 |
 |
This comes courtesy of PyCharm
 Feel free to invoke
 python or ipython directly and use the commands in the screenshot above and it should work
If you run into issues with viewing D-Tale in your browser on Windows please try making Python public under "Allowed Apps" in your Firewall configuration. Here is a nice article: How to Allow Apps to Communicate Through the Windows Firewall
import dtale
import pandas as pd

df = pd.DataFrame([dict(a=1,b=2,c=3)])

# Assigning a reference to a running D-Tale process.
d = dtale.show(df)

# Accessing data associated with D-Tale process.
tmp = d.data.copy()
tmp['d'] = 4

# Altering data associated with D-Tale process
# FYI: this will clear any front-end settings you have at the time for this process (filter, sorts, formatting)
d.data = tmp

# Get raw dataframe w/ any sorting or edits made through the UI
d.data

# Get raw dataframe similar to '.data' along with any filters applied using the UI
d.view_data

# Shutting down D-Tale process
d.kill()

# Using Python's `webbrowser` package it will try and open your server's default browser to this process.
d.open_browser()

# There is also some helpful metadata about the process.
d._data_id  # The process's data identifier.
d._url  # The url to access the process.

d2 = dtale.get_instance(d._data_id)  # Returns a new reference to the instance running at that data_id.

dtale.instances()  # Prints a list of all ids & urls of running D-Tale sessions.
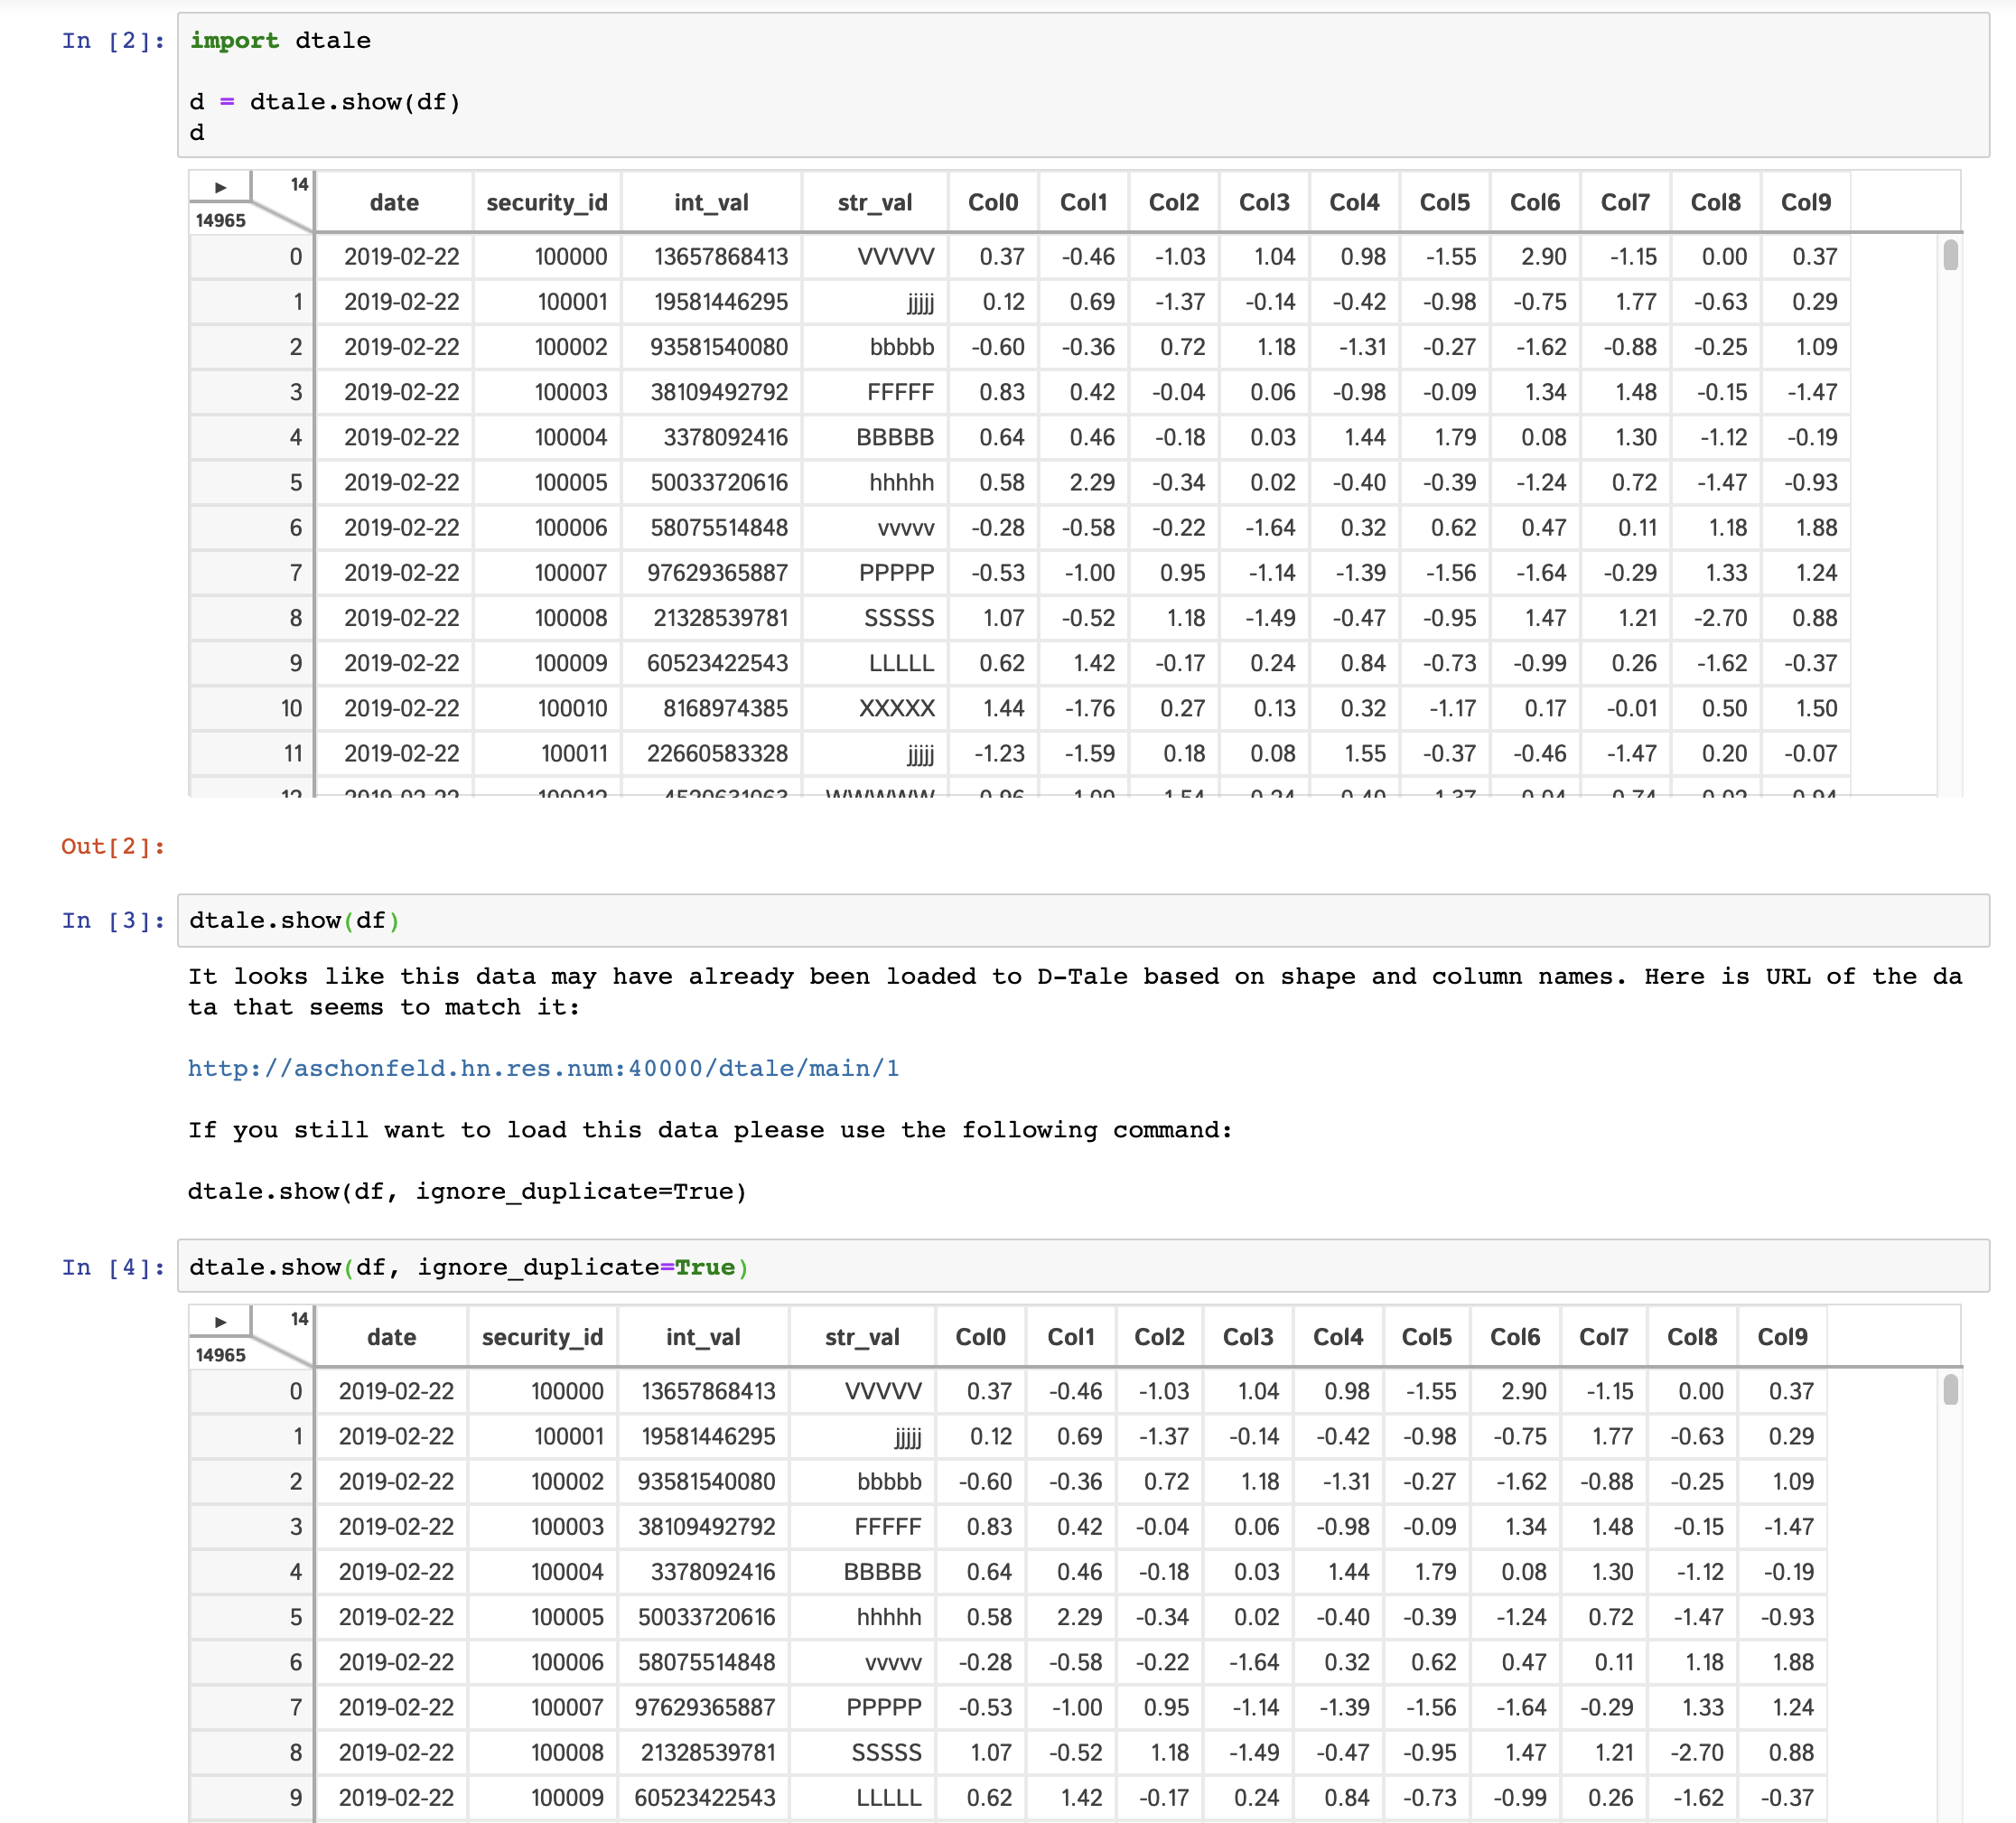
To help guard against users loading the same data to D-Tale multiple times and thus eating up precious memory, we have a loose check for duplicate input data. The check runs the following:
If both these conditions are true then you will be presented with an error and a link to the previously loaded data. Here is an example of how the interaction looks:
D-Tale can be run as script by adding subprocess=False to your dtale.show command. Here is an example script:
import dtale
import pandas as pd

if __name__ == '__main__':
      dtale.show(pd.DataFrame([1,2,3,4,5]), subprocess=False)
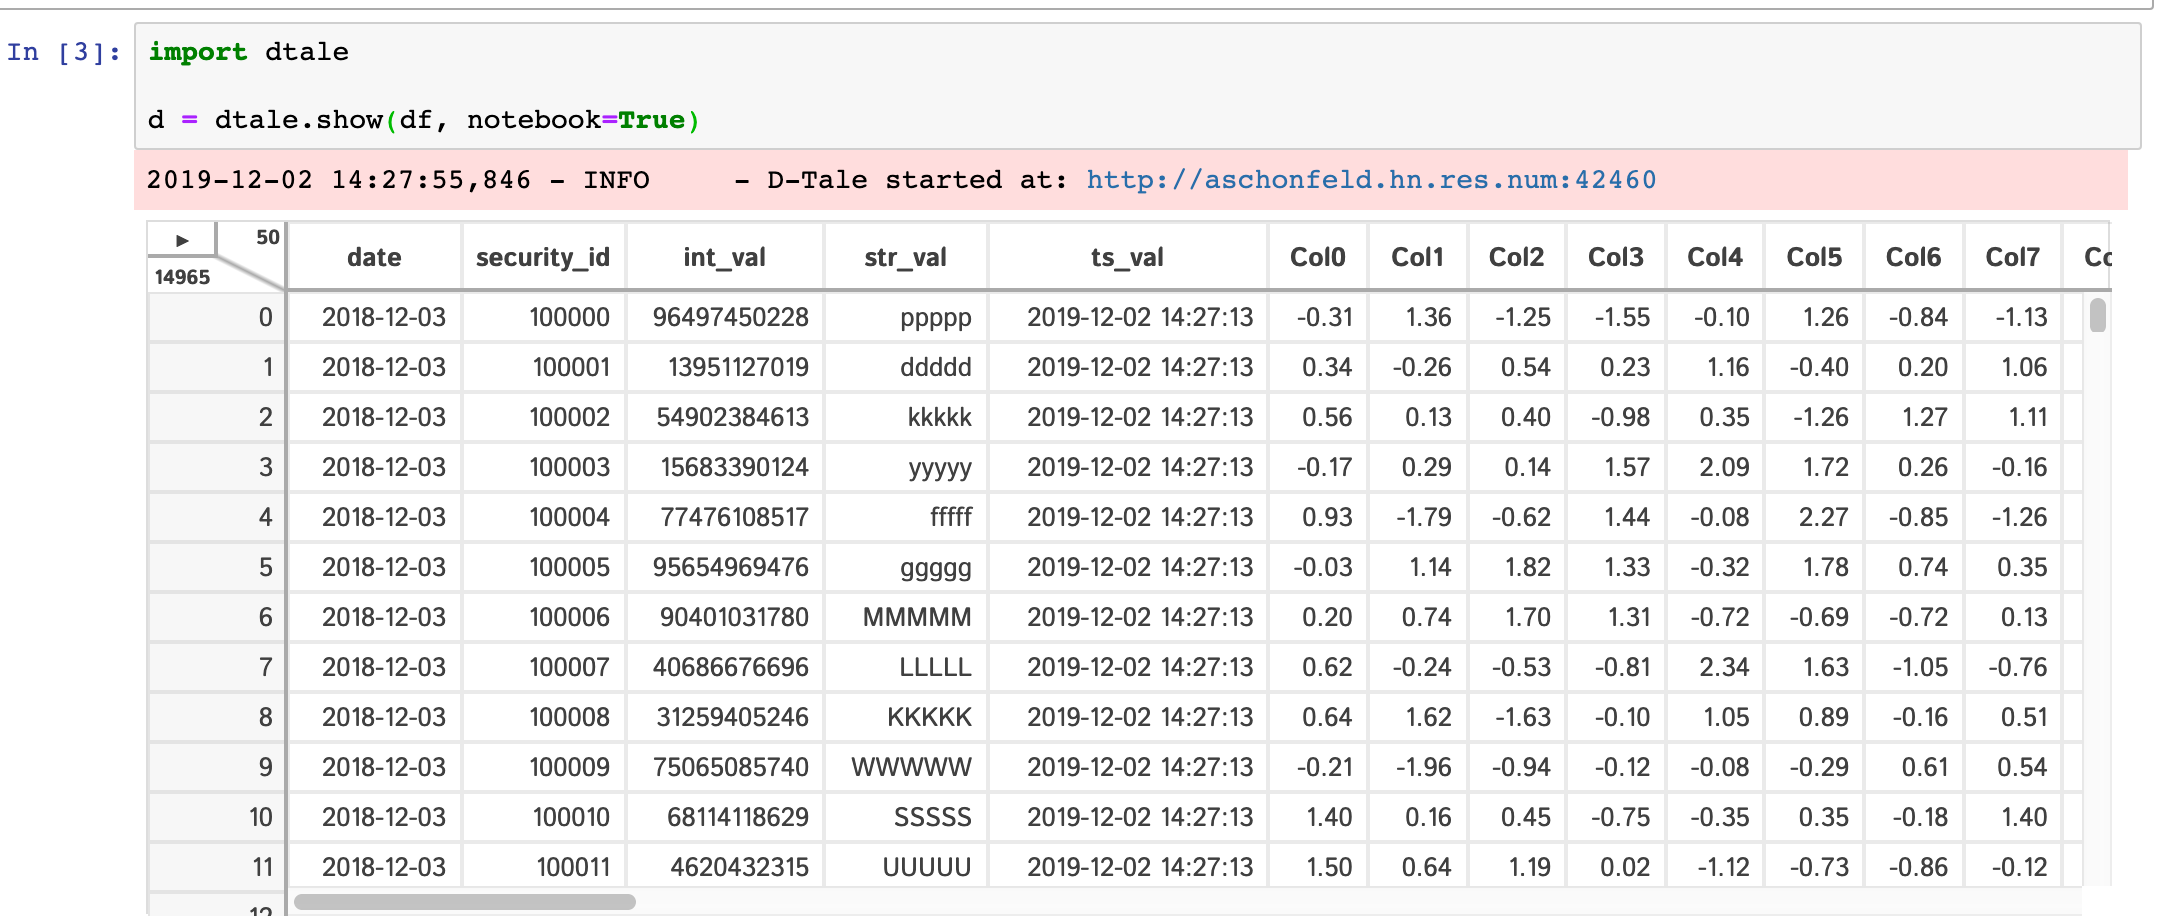
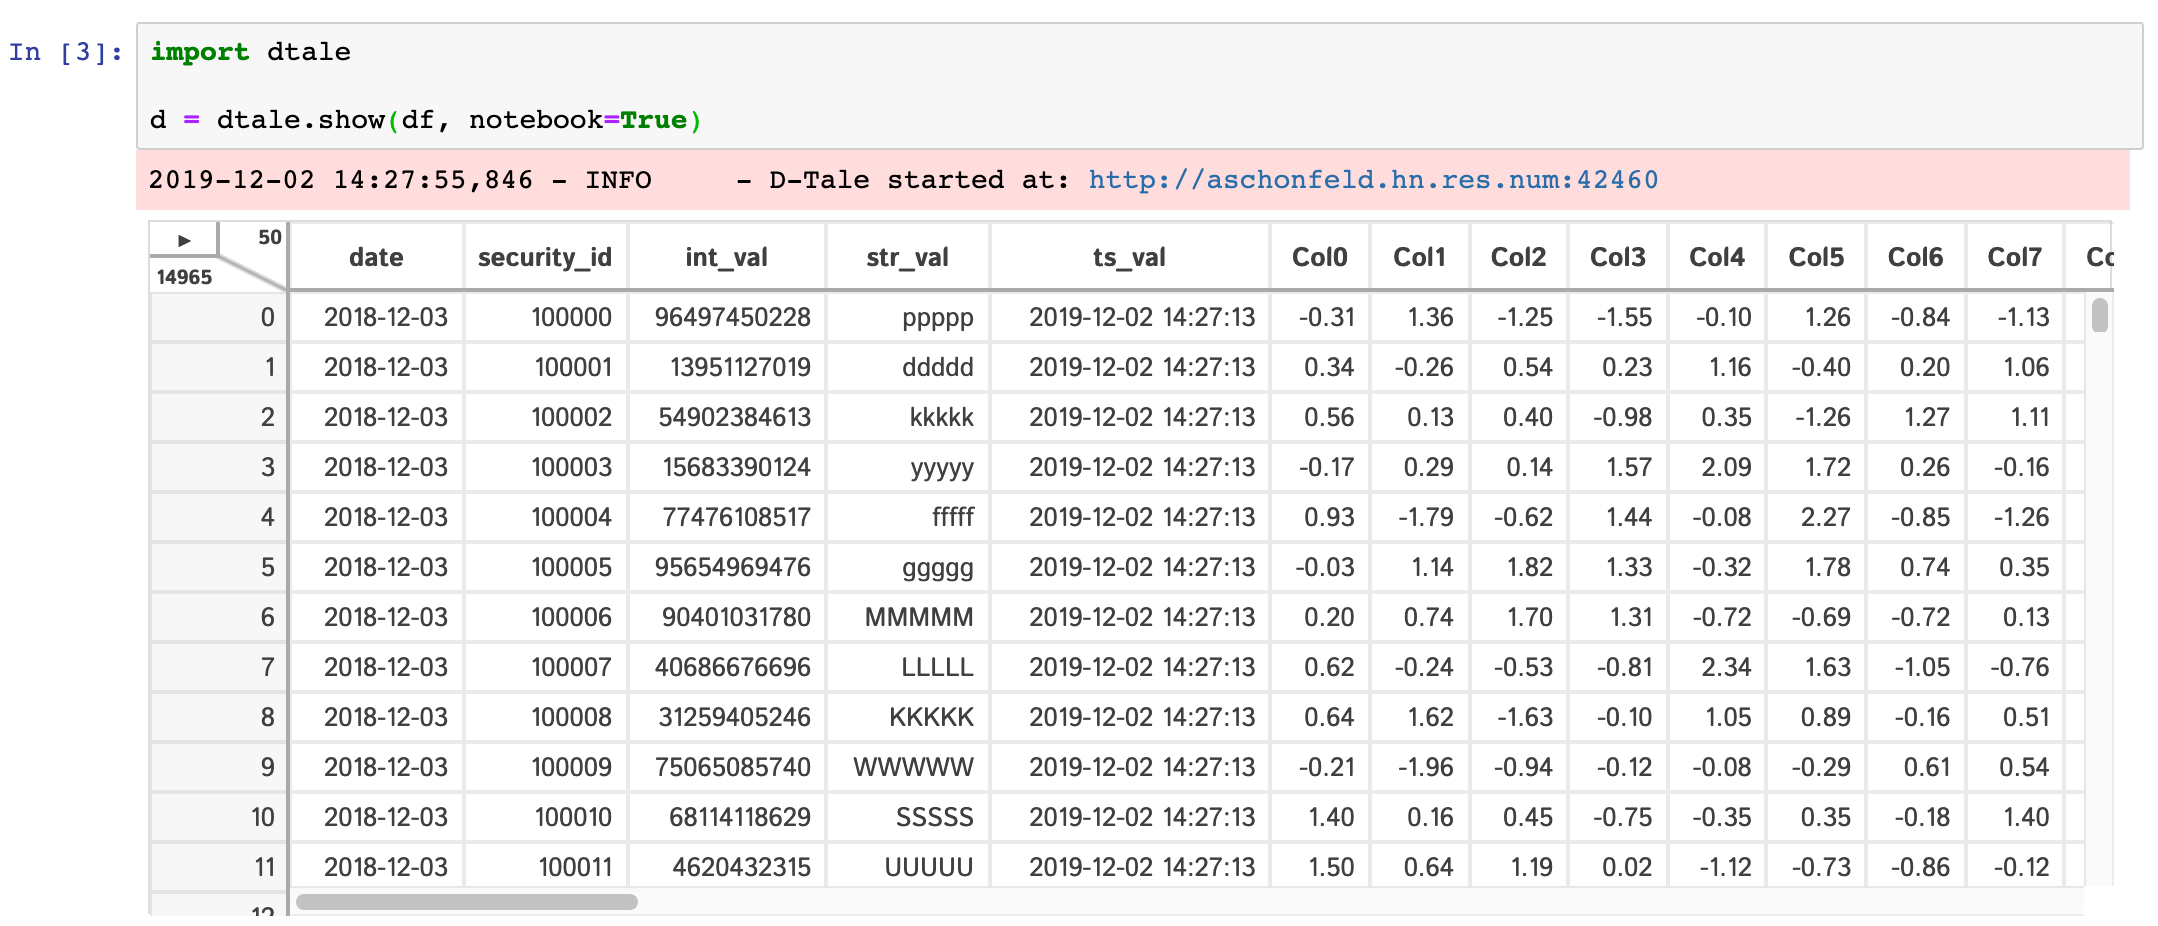
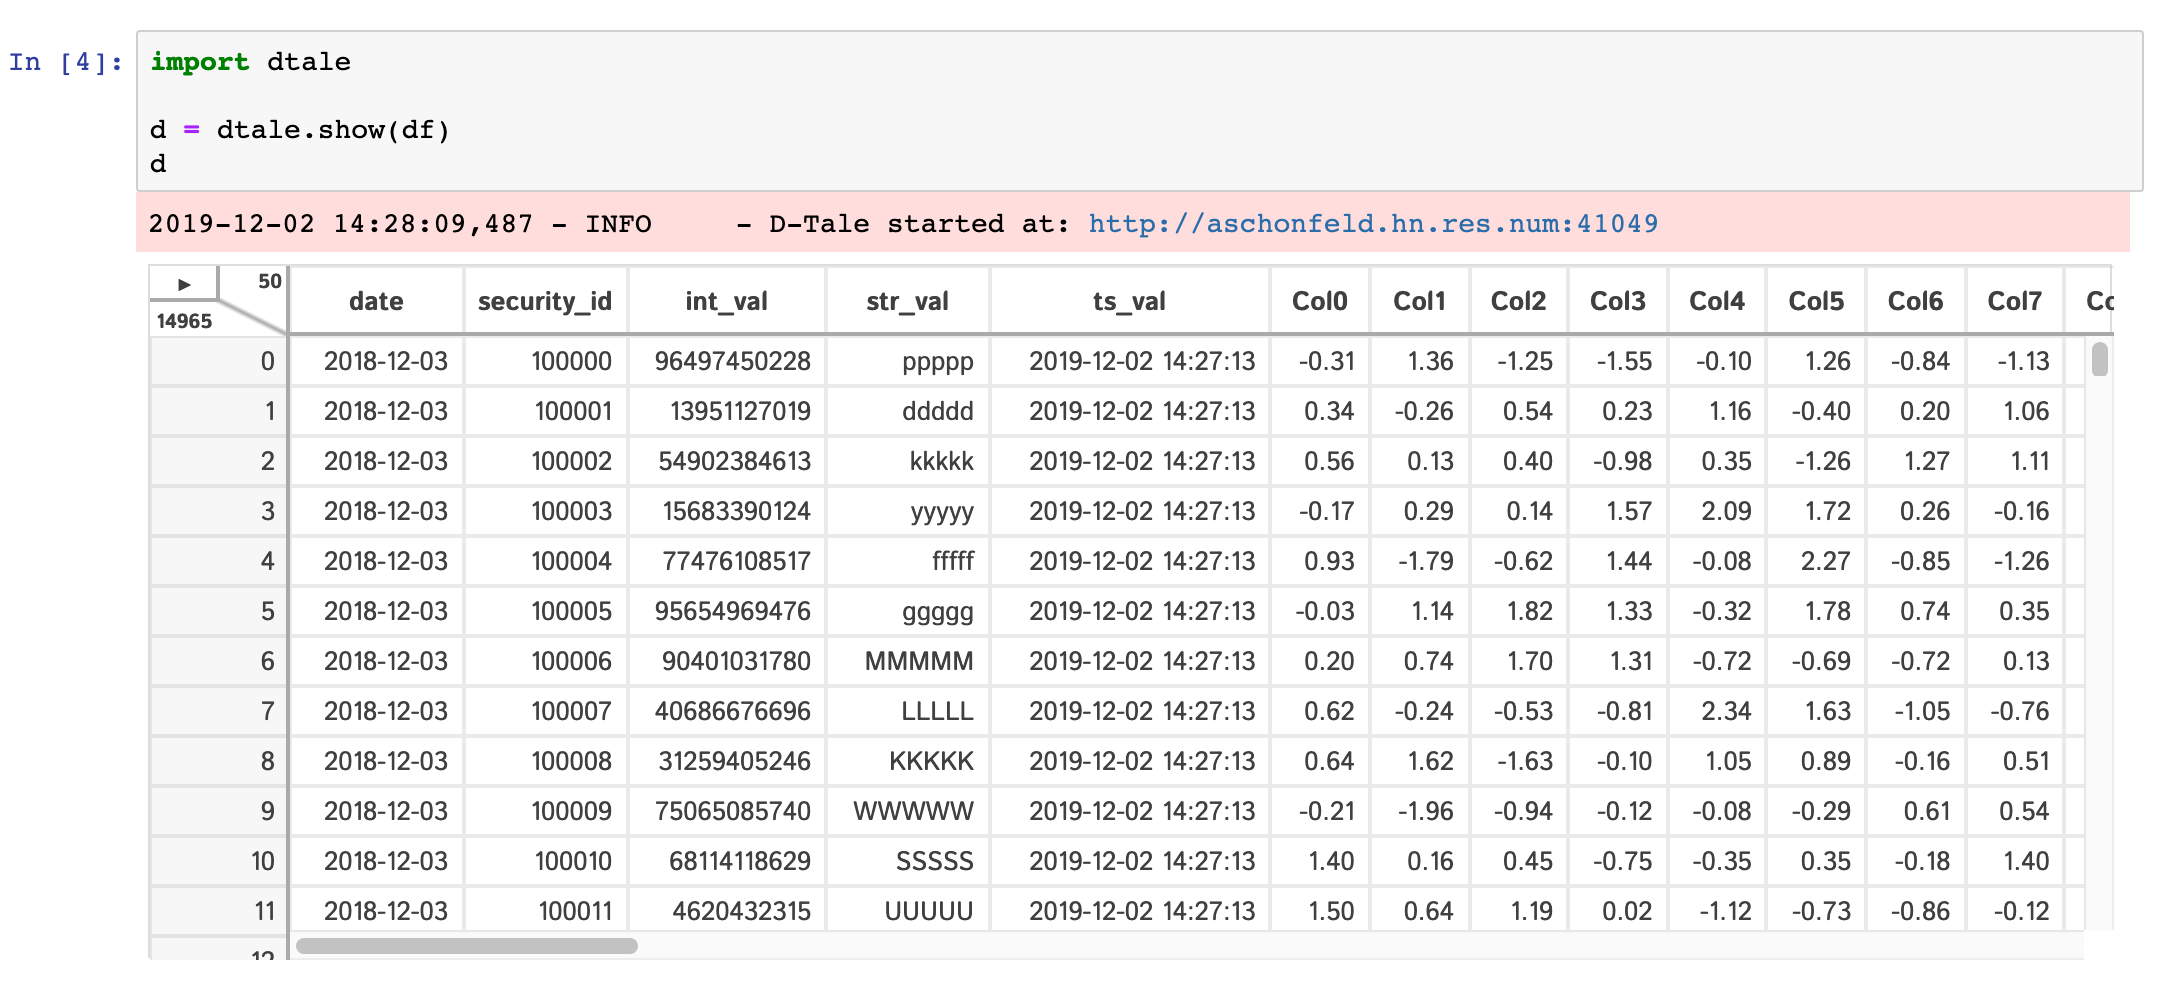
Within any jupyter (ipython) notebook executing a cell like this will display a small instance of D-Tale in the output cell. Here are some examples:
dtale.show |
assignment | instance |
|---|---|---|
 |
 |
 |
If you are running ipython<=5.0 then you also have the ability to adjust the size of your output cell for the most recent instance displayed:
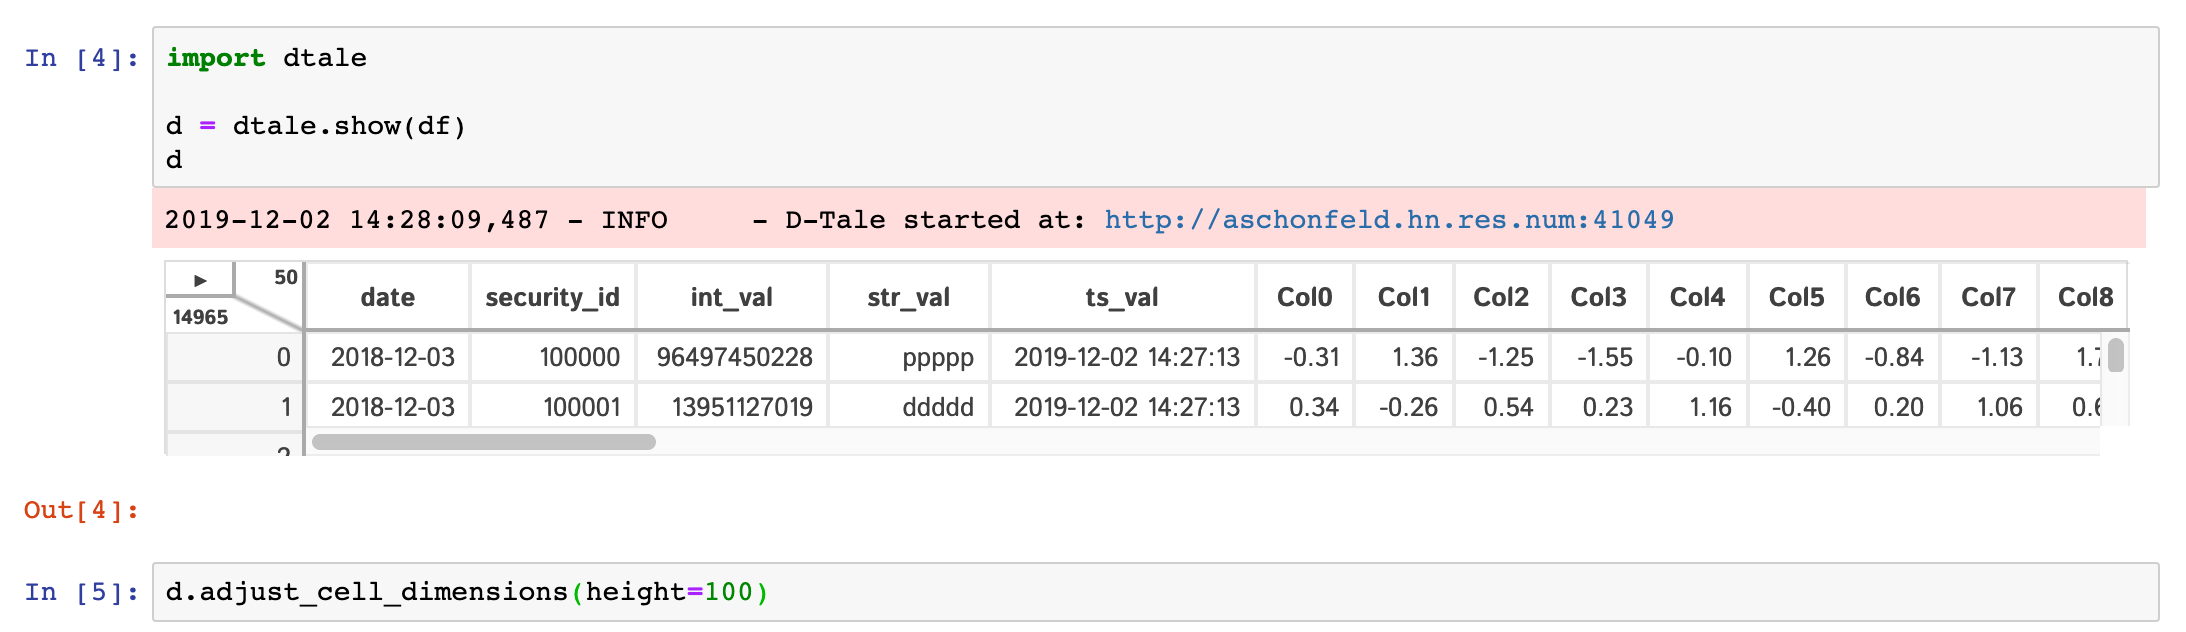
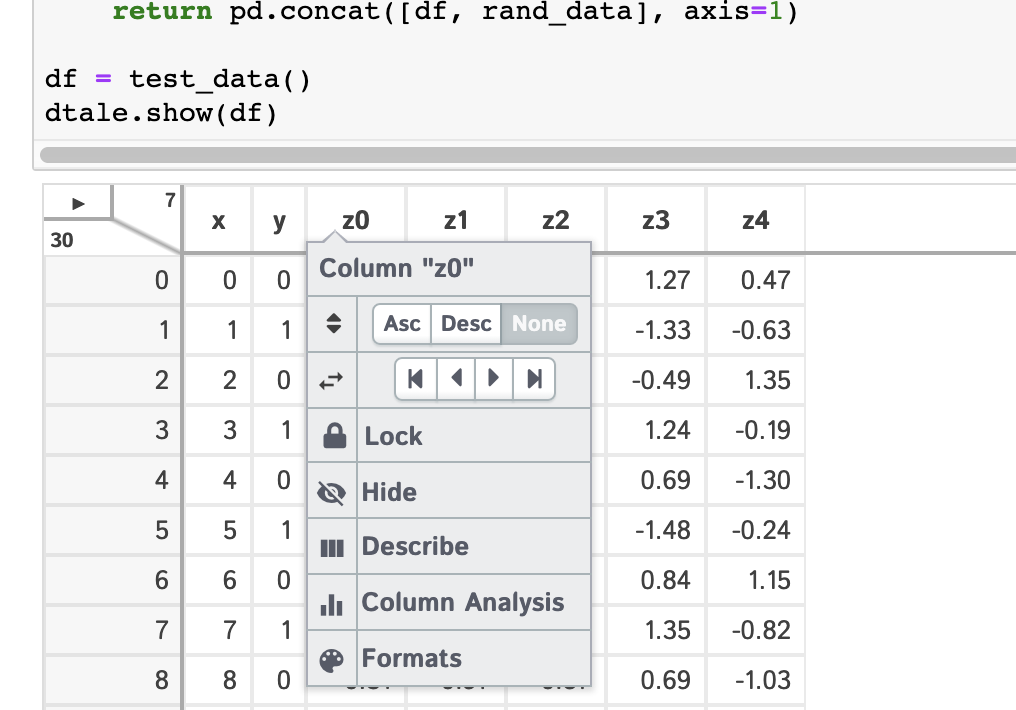
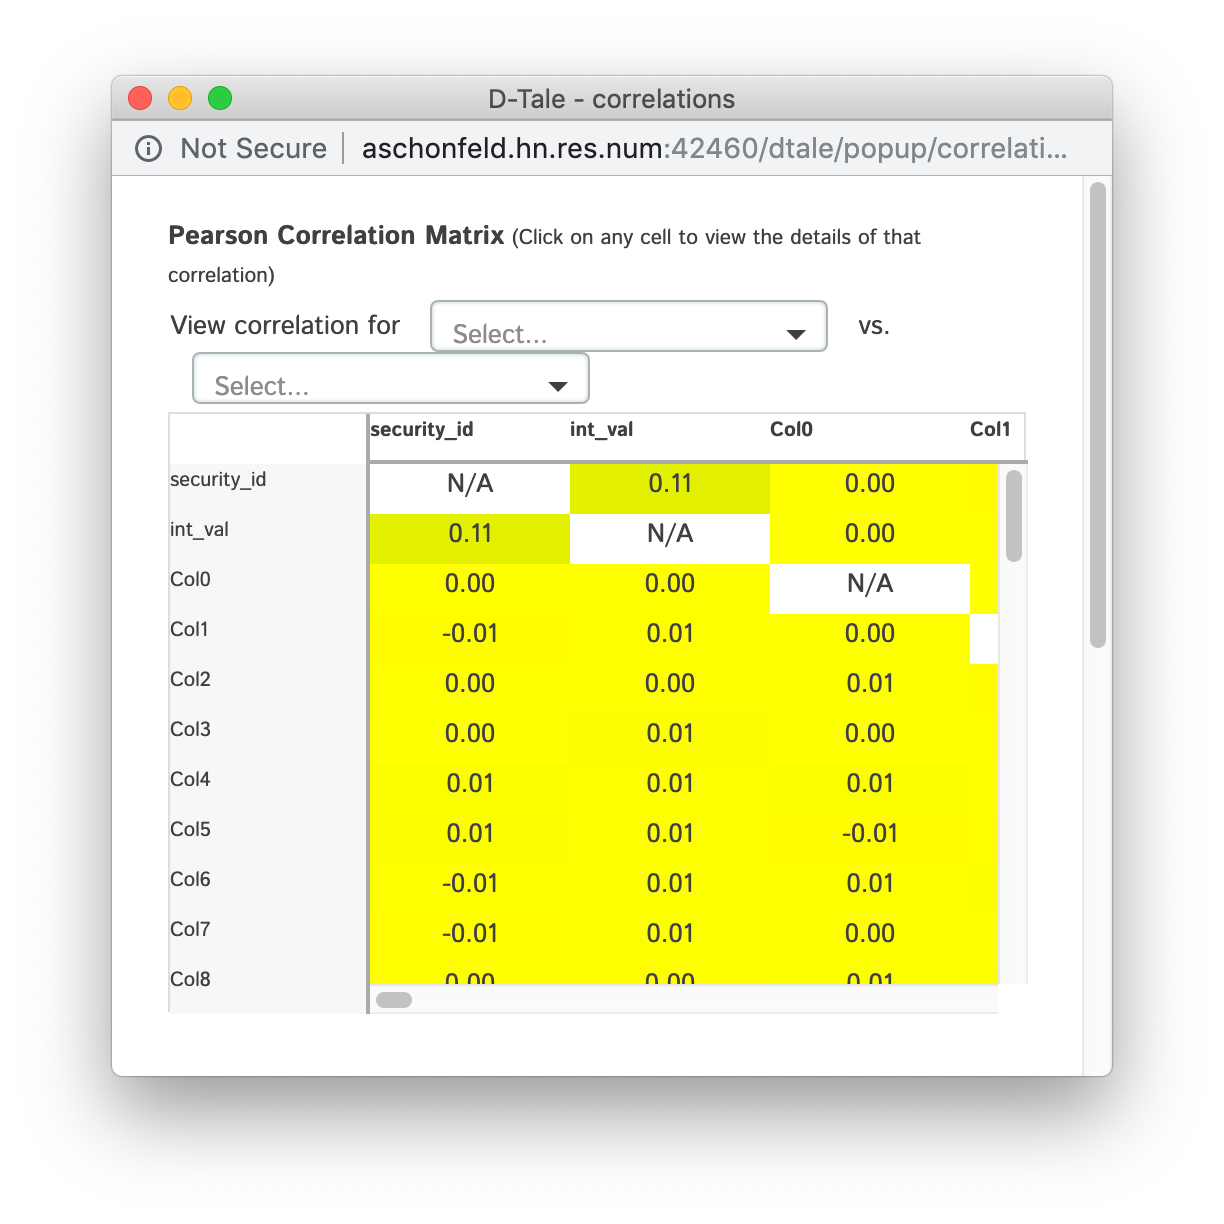
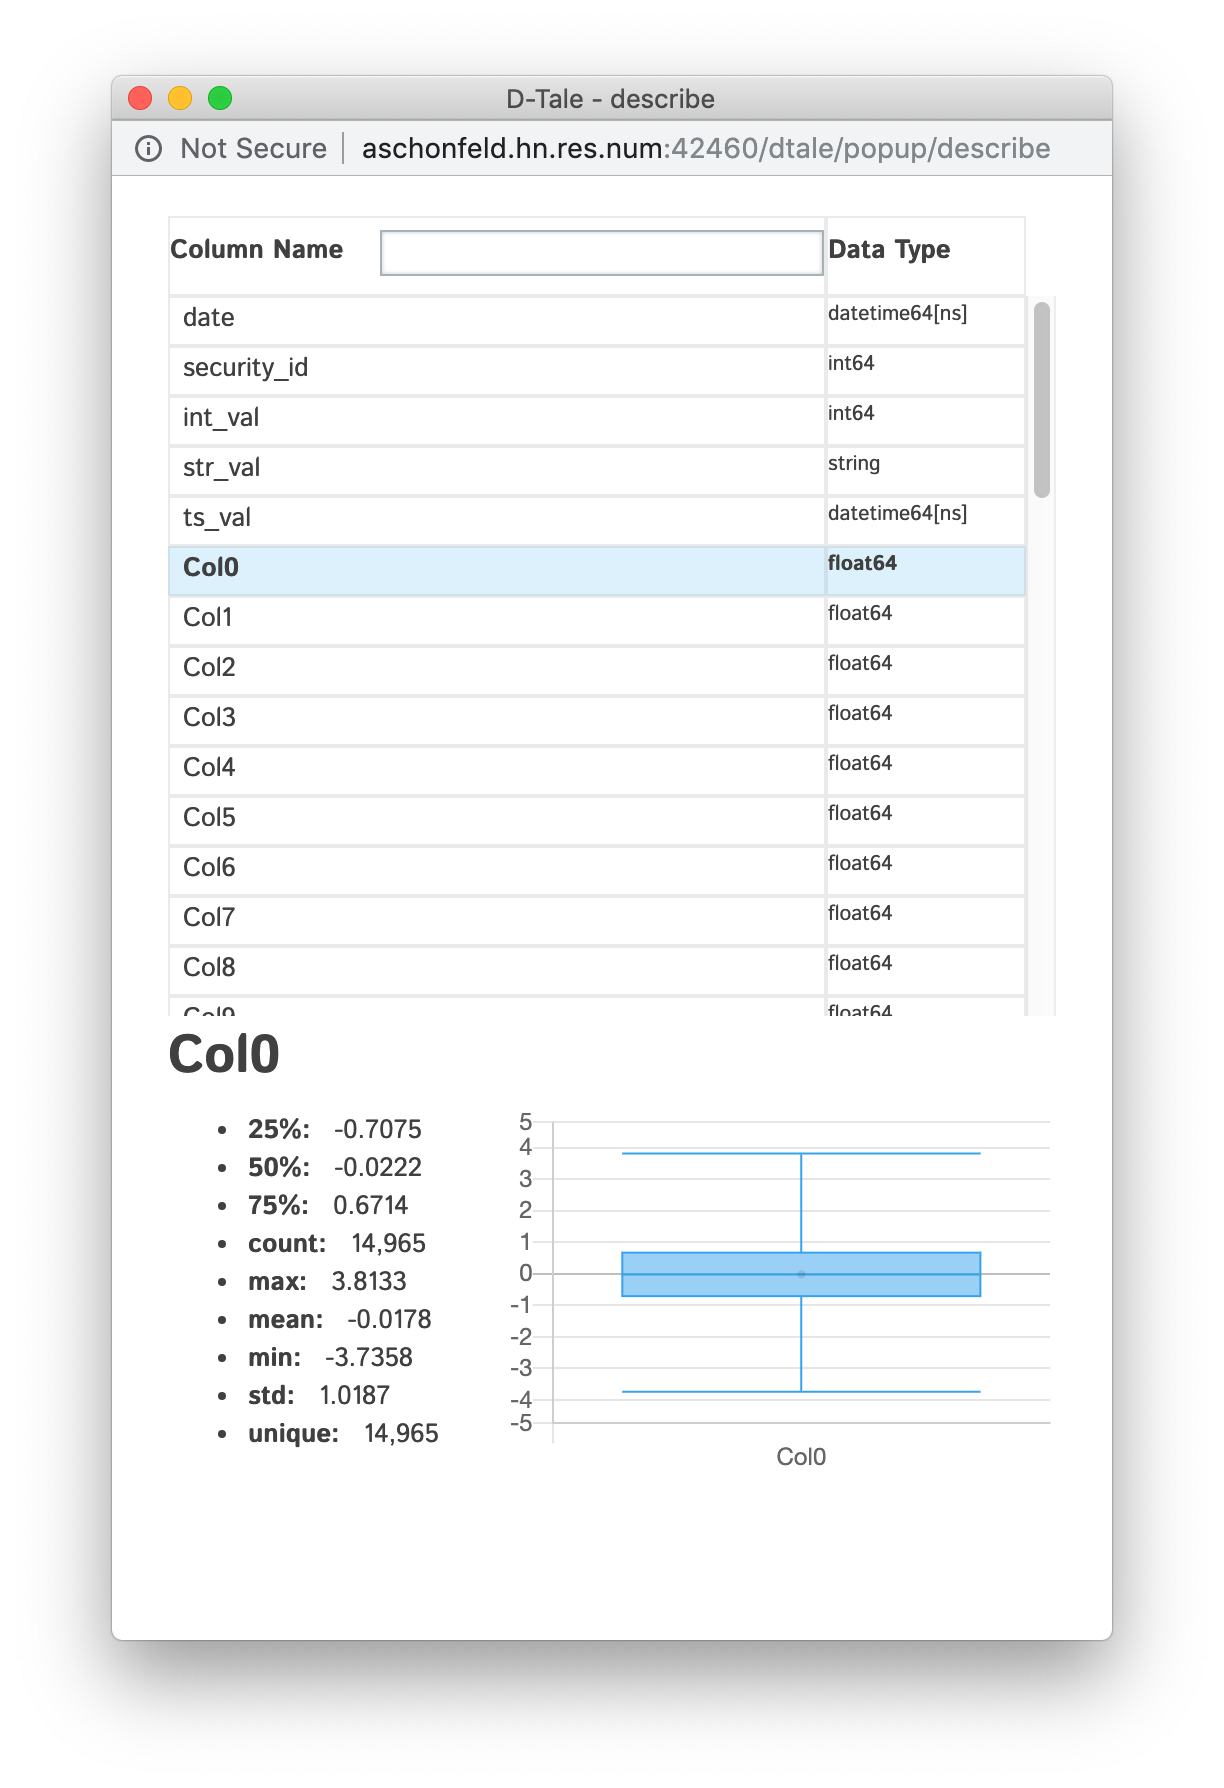
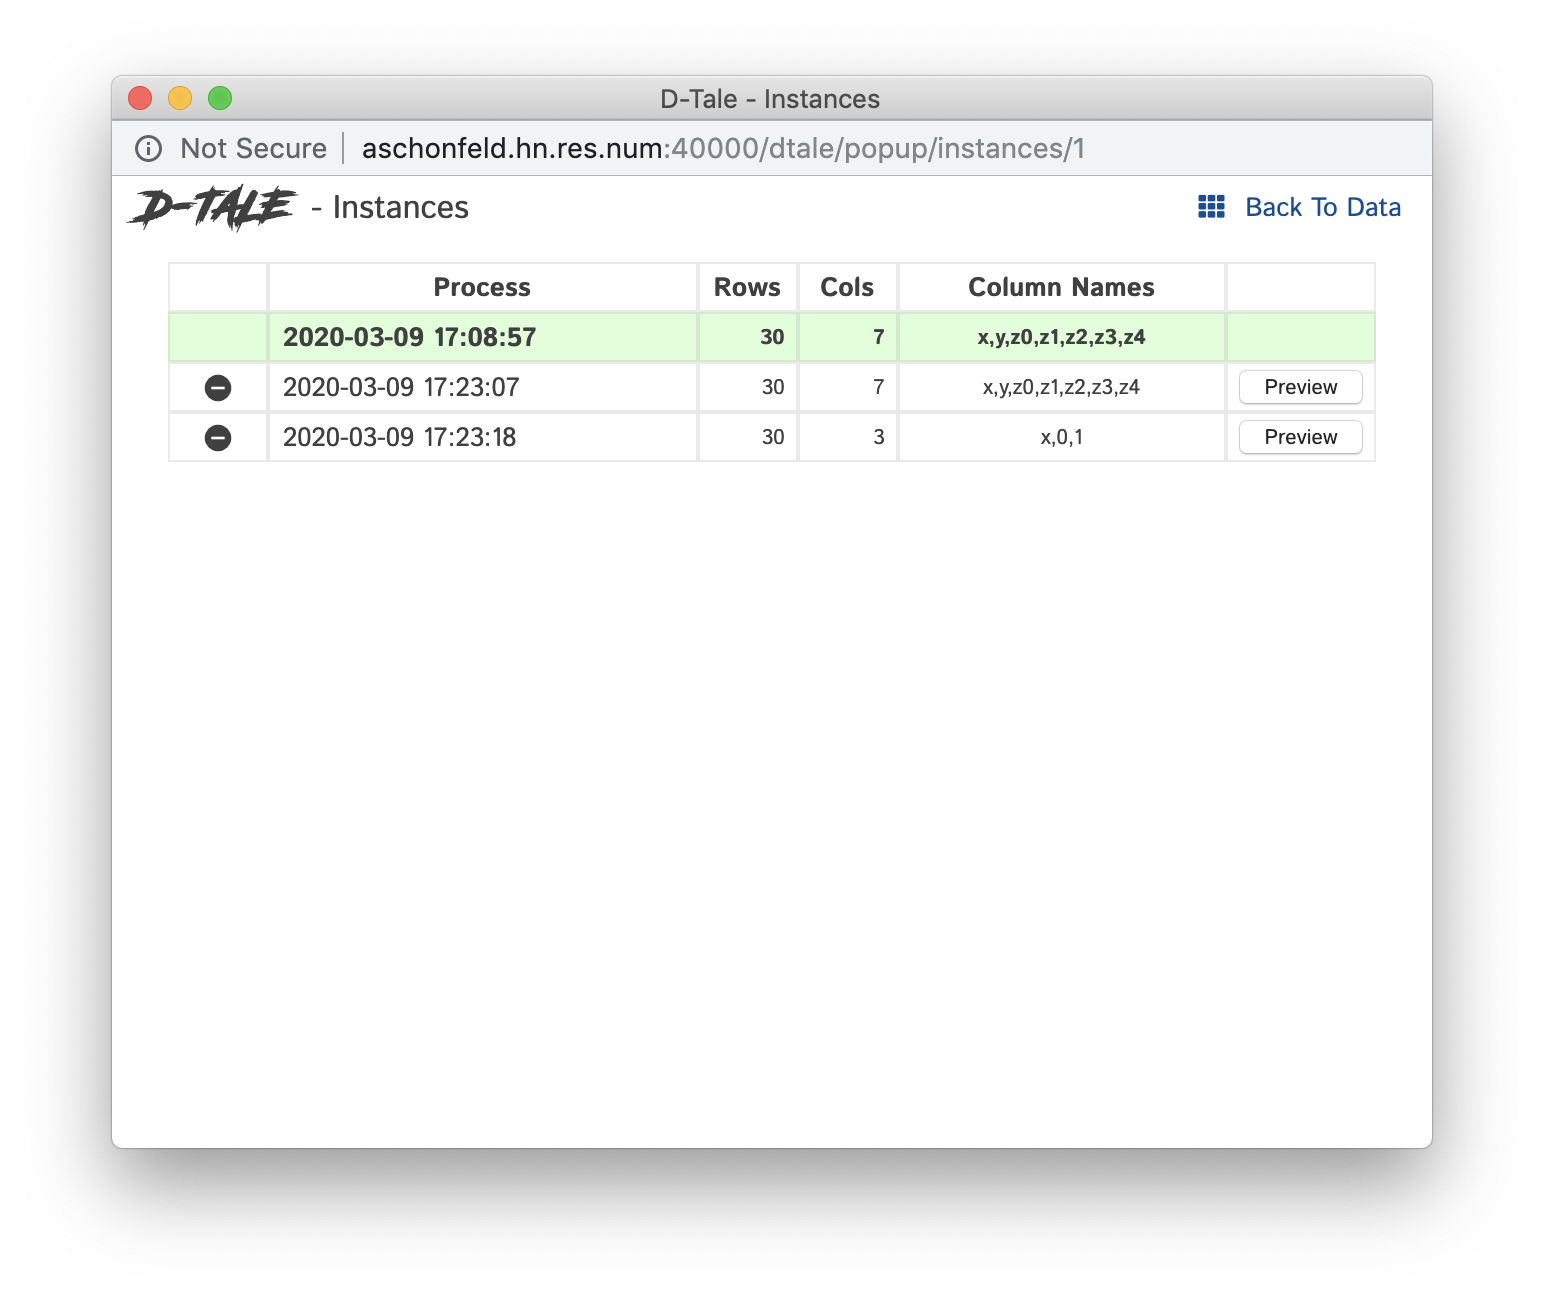
One thing of note is that a lot of the modal popups you see in the standard browser version will now open separate browser windows for spacial convienence:
| Column Menus | Correlations | Describe | Column Analysis | Instances |
|---|---|---|---|---|
 |
 |
 |
 |
 |
JupyterHub has an extension that allows to proxy port for user, JupyterHub Server Proxy
To me it seems like this extension might be the best solution to getting D-Tale running within kubernetes. Here's how to use it:
import pandas as pd

import dtale
import dtale.app as dtale_app

dtale_app.JUPYTER_SERVER_PROXY = True

dtale.show(pd.DataFrame([1,2,3]))
Notice the command dtale_app.JUPYTER_SERVER_PROXY = True this will make sure that any D-Tale instance will be served with the jupyter server proxy application root prefix:
/user/{jupyter username}/proxy/{dtale instance port}/
One thing to note is that if you try to look at the _main_url of your D-Tale instance in your notebook it will not include the hostname or port:
import pandas as pd

import dtale
import dtale.app as dtale_app

dtale_app.JUPYTER_SERVER_PROXY = True

d = dtale.show(pd.DataFrame([1,2,3]))
d._main_url # /user/johndoe/proxy/40000/dtale/main/1
This is because it's very hard to promgramatically figure out the host/port that your notebook is running on. So if you want to look at _main_url please be sure to preface it with:
http[s]://[jupyterhub host]:[jupyterhub port]
If for some reason jupyterhub changes their API so that the application root changes you can also override D-Tale's application root by using the app_root parameter to the show() function:
import pandas as pd

import dtale
import dtale.app as dtale_app

dtale.show(pd.DataFrame([1,2,3]), app_root='/user/johndoe/proxy/40000/`)
Using this parameter will only apply the application root to that specific instance so you would have to include it on every call to show().
Please read this post
If you have D-Tale installed within your docker container please add the following parameters to your docker run command.
On a Mac:
docker run -h `hostname` -p 40000:40000
-h this will allow the hostname (and not the PID of the docker container) to be available when building D-Tale URLs-p access to port 40000 which is the default port for running D-TaleOn Windows:
docker run -p 40000:40000
-p access to port 40000 which is the default port for running D-TaleEverything Else:
docker run -h `hostname` --network host
-h this will allow the hostname (and not the PID of the docker container) to be available when building D-Tale URLs--network host this will allow access to as many ports as needed for running D-Tale processesThis is a hosted notebook site and thanks to Colab's internal function google.colab.output.eval_js & the JS function google.colab.kernel.proexyPort users can run D-Tale within their notebooks.
DISCLAIMER: It is important that you set USE_COLAB to true when using D-Tale within this service. Here is an example:
import pandas as pd

import dtale
import dtale.app as dtale_app

dtale_app.USE_COLAB = True

dtale.show(pd.DataFrame([1,2,3]))
If this does not work for you try using USE_NGROK which is described in the next section.
This is yet another hosted notebook site and thanks to the work of flask_ngrok users can run D-Tale within their notebooks.
DISCLAIMER: It is import that you set USE_NGROK to true when using D-Tale within this service. Please make sure to run pip install flask-ngrok before running this example. Here is an example:
import pandas as pd

import dtale
import dtale.app as dtale_app

dtale_app.USE_NGROK = True

dtale.show(pd.DataFrame([1,2,3]))
Here are some video tutorials of each:
| Service | Tutorial | Addtl Notes |
|---|---|---|
| Google Colab | ||
| Kaggle | make sure you switch the "Internet" toggle to "On" under settings of your notebook so you can install the egg from pip |
It is important to note that using NGROK will limit you to 20 connections per mintue so if you see this error:
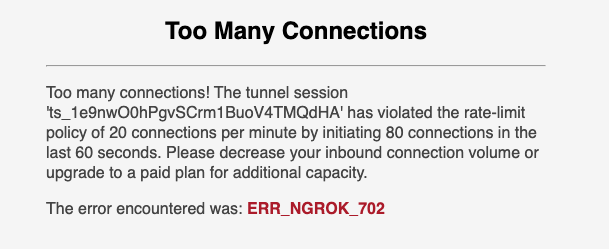
Wait a little while and it should allow you to do work again. I am actively working on finding a more sustainable solution similar to what I did for google colab. 🙏
I have built a repo which shows an example of how to run D-Tale within Binder here.
The important take-aways are:
jupyter-server-proxy installedenvironment.yml file to see how to add it to your environmentpostBuild file for how to activate it on startupI was able to get D-Tale running in R using reticulate. Here is an example:
library('reticulate')
dtale <- import('dtale')
df <- read.csv('https://vincentarelbundock.github.io/Rdatasets/csv/boot/acme.csv')
dtale$show(df, subprocess=FALSE, open_browser=TRUE)
Now the problem with doing this is that D-Tale is not running as a subprocess so it will block your R console and you'll lose out the following functions:
open_browser=TRUE isn't required and won't work if you don't have a default browser installed on your machine. If you don't use that parameter simply copy & paste the URL that gets printed to your console in the browser of your choice.
I'm going to do some more digging on why R doesn't seem to like using python subprocesses (not sure if it something with how reticulate manages the state of python) and post any findings to this thread.
Here's some helpful links for getting setup:
reticulate
installing python packages
It is now possible to run D-Tale with no data loaded up front. So simply call dtale.show() and this will start the application for you and when you go to view it you will be presented with a screen where you can upload either a CSV or TSV file for data.
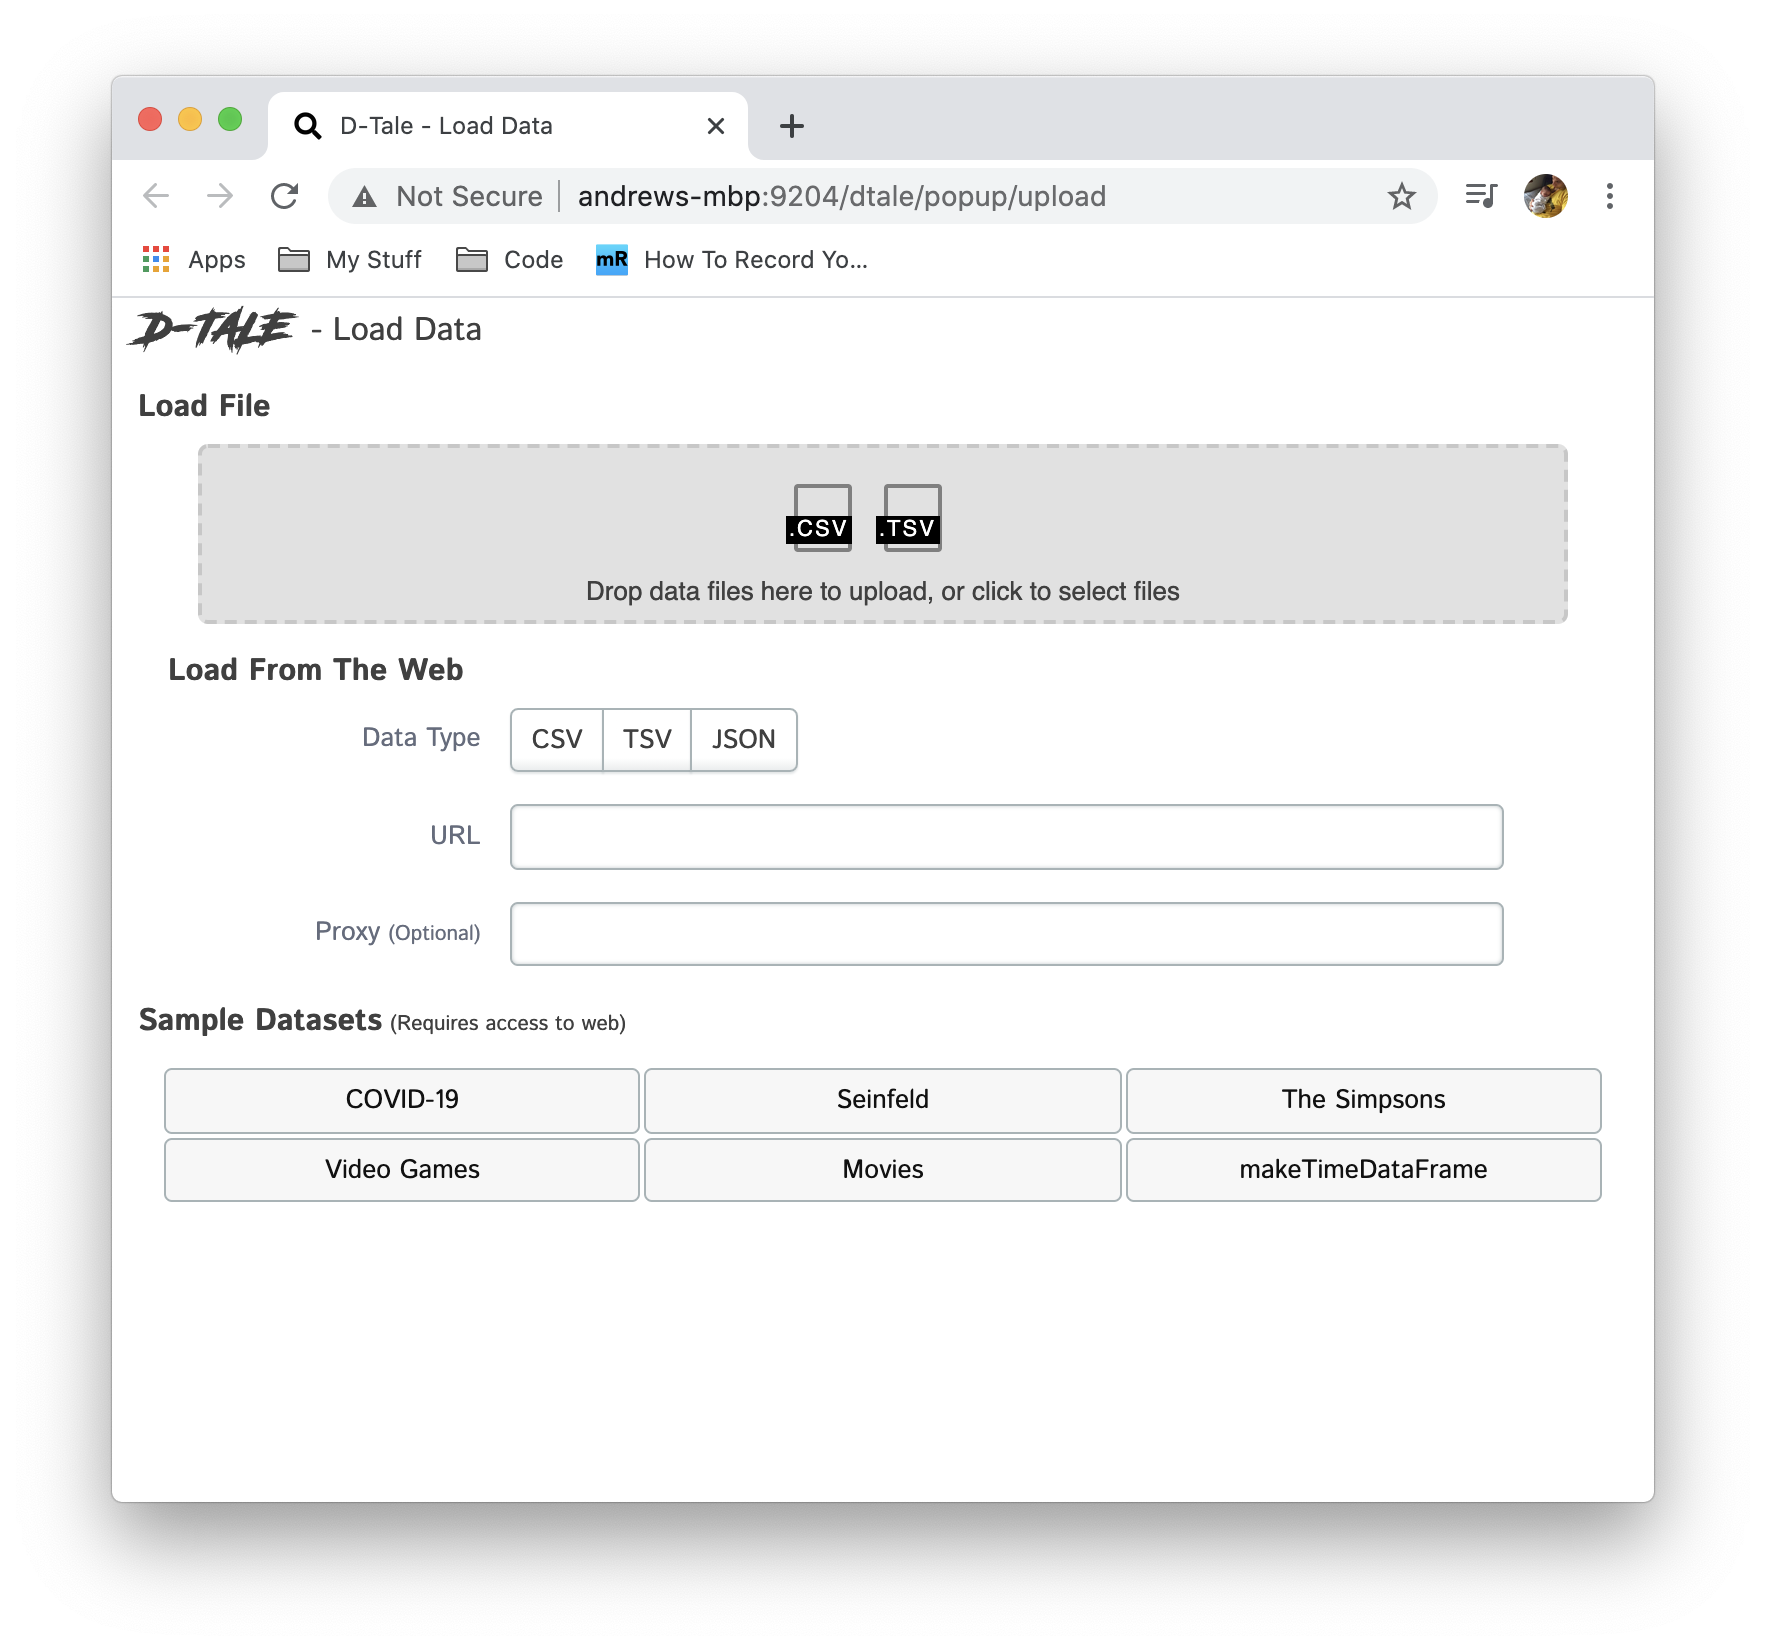
Once you've loaded a file it will take you directly to the standard data grid comprised of the data from the file you loaded. This might make it easier to use this as an on demand application within a container management system like kubernetes. You start and stop these on demand and you'll be presented with a new instance to load any CSV or TSV file to!
Base CLI options (run dtale --help to see all options available)
| Prop | Description |
|---|---|
--host |
the name of the host you would like to use (most likely not needed since socket.gethostname() should figure this out) |
--port |
the port you would like to assign to your D-Tale instance |
--name |
an optional name you can assign to your D-Tale instance (this will be displayed in the <title> & Instances popup) |
--debug |
turn on Flask's "debug" mode for your D-Tale instance |
--no-reaper |
flag to turn off auto-reaping subprocess (kill D-Tale instances after an hour of inactivity), good for long-running displays |
--open-browser |
flag to automatically open up your server's default browser to your D-Tale instance |
--force |
flag to force D-Tale to try an kill any pre-existing process at the port you've specified so it can use it |
Loading data from ArcticDB(high performance, serverless DataFrame database) (this requires either installing arcticdb or dtale[arcticdb])
dtale --arcticdb-uri lmdb:///<path> --arcticdb-library jdoe.my_lib --arcticdb-symbol my_symbol
If you would like to change your storage mechanism to ArcticDB then add the --arcticdb-use_store flag
dtale --arcticdb-uri lmdb:///<path> --arcticdb-library my_lib --arcticdb-symbol my_symbol --arcticdb-use_store
Loading data from arctic(high performance datastore for pandas dataframes) (this requires either installing arctic or dtale[arctic])
dtale --arctic-uri mongodb://localhost:27027 --arctic-library my_lib --arctic-symbol my_symbol --arctic-start 20130101 --arctic-end 20161231
Loading data from CSV
dtale --csv-path /home/jdoe/my_csv.csv --csv-parse_dates date
Loading data from EXCEL
dtale --excel-path /home/jdoe/my_csv.xlsx --excel-parse_dates date
dtale --excel-path /home/jdoe/my_csv.xls --excel-parse_dates date
Loading data from JSON
dtale --json-path /home/jdoe/my_json.json --json-parse_dates date
or
dtale --json-path http://json-endpoint --json-parse_dates date
Loading data from R Datasets
dtale --r-path /home/jdoe/my_dataset.rda
Loading data from SQLite DB Files
dtale --sqlite-path /home/jdoe/test.sqlite3 --sqlite-table test_table
Loading data from a Custom loader
--arctic (this wouldn't work well in arctic's case since it depends on all those properties)def find_loader(kwargs) which returns a function that returns a dataframe or Nonefrom dtale.cli.clickutils import get_loader_options
'''
IMPORTANT!!! This global variable is required for building any customized CLI loader.
When find loaders on startup it will search for any modules containing the global variable LOADER_KEY.
'''
LOADER_KEY = 'testdata'
LOADER_PROPS = ['rows', 'columns']
def test_data(rows, columns):
import pandas as pd
import numpy as np
import random
from past.utils import old_div
from pandas.tseries.offsets import Day
from dtale.utils import dict_merge
import string
now = pd.Timestamp(pd.Timestamp('now').date())
dates = pd.date_range(now - Day(364), now)
num_of_securities = max(old_div(rows, len(dates)), 1) # always have at least one security
securities = [
dict(security_id=100000 + sec_id, int_val=random.randint(1, 100000000000),
str_val=random.choice(string.ascii_letters) * 5)
for sec_id in range(num_of_securities)
]
data = pd.concat([
pd.DataFrame([dict_merge(dict(date=date), sd) for sd in securities])
for date in dates
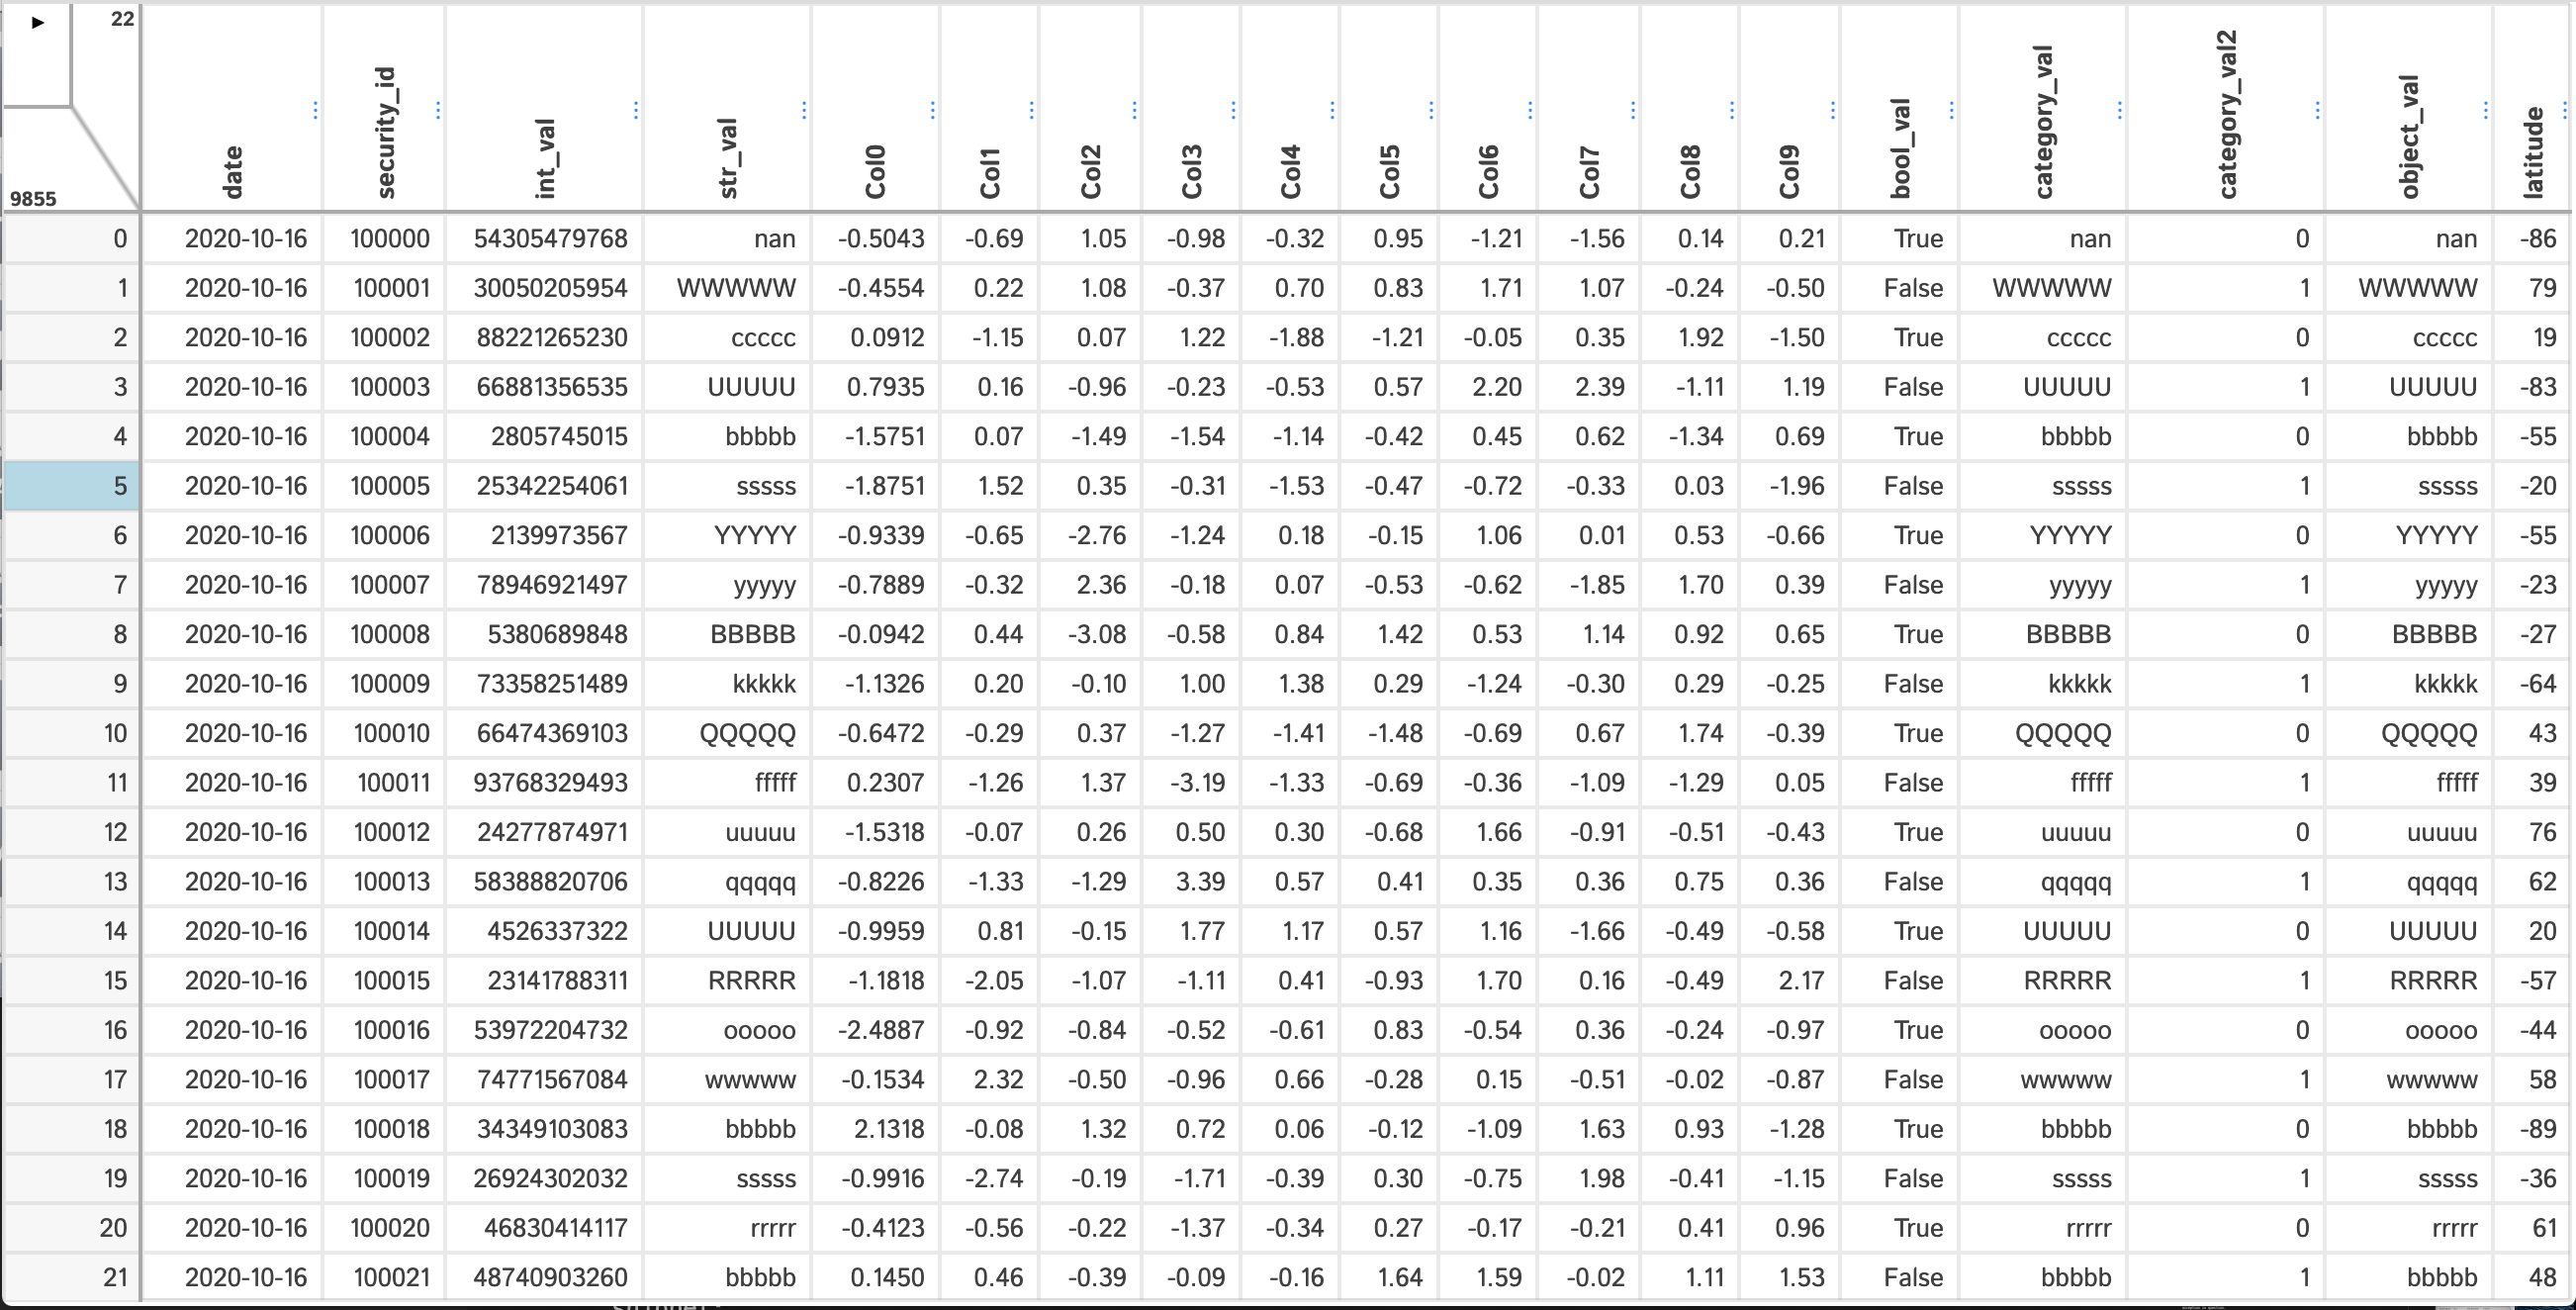
], ignore_index=True)[['date', 'security_id', 'int_val', 'str_val']]
col_names = ['Col{}'.format(c) for c in range(columns)]
return pd.concat([data, pd.DataFrame(np.random.randn(len(data), columns), columns=col_names)], axis=1)
# IMPORTANT!!! This function is required for building any customized CLI loader.
def find_loader(kwargs):
test_data_opts = get_loader_options(LOADER_KEY, LOADER_PROPS, kwargs)
if len([f for f in test_data_opts.values() if f]):
def _testdata_loader():
return test_data(int(test_data_opts.get('rows', 1000500)), int(test_data_opts.get('columns', 96)))
return _testdata_loader
return None
In this example we simplying building a dataframe with some dummy data based on dimensions specified on the command-line:
--testdata-rows--testdata-columnsHere's how you would use this loader:
DTALE_CLI_LOADERS=./path_to_loaders bash -c 'dtale --testdata-rows 10 --testdata-columns 5'
You can choose to use optional authentication by adding the following to your D-Tale .ini file (directions here):
[auth]
active = True
username = johndoe
password = 1337h4xOr
Or you can call the following:
import dtale.global_state as global_state

global_state.set_auth_settings({'active': True, 'username': 'johndoe', 'password': '1337h4x0r'})
If you have done this before initially starting D-Tale it will have authentication applied. If you are adding this after starting D-Tale you will have to kill your service and start it over.
When opening your D-Tale session you will be presented with a screen like this:
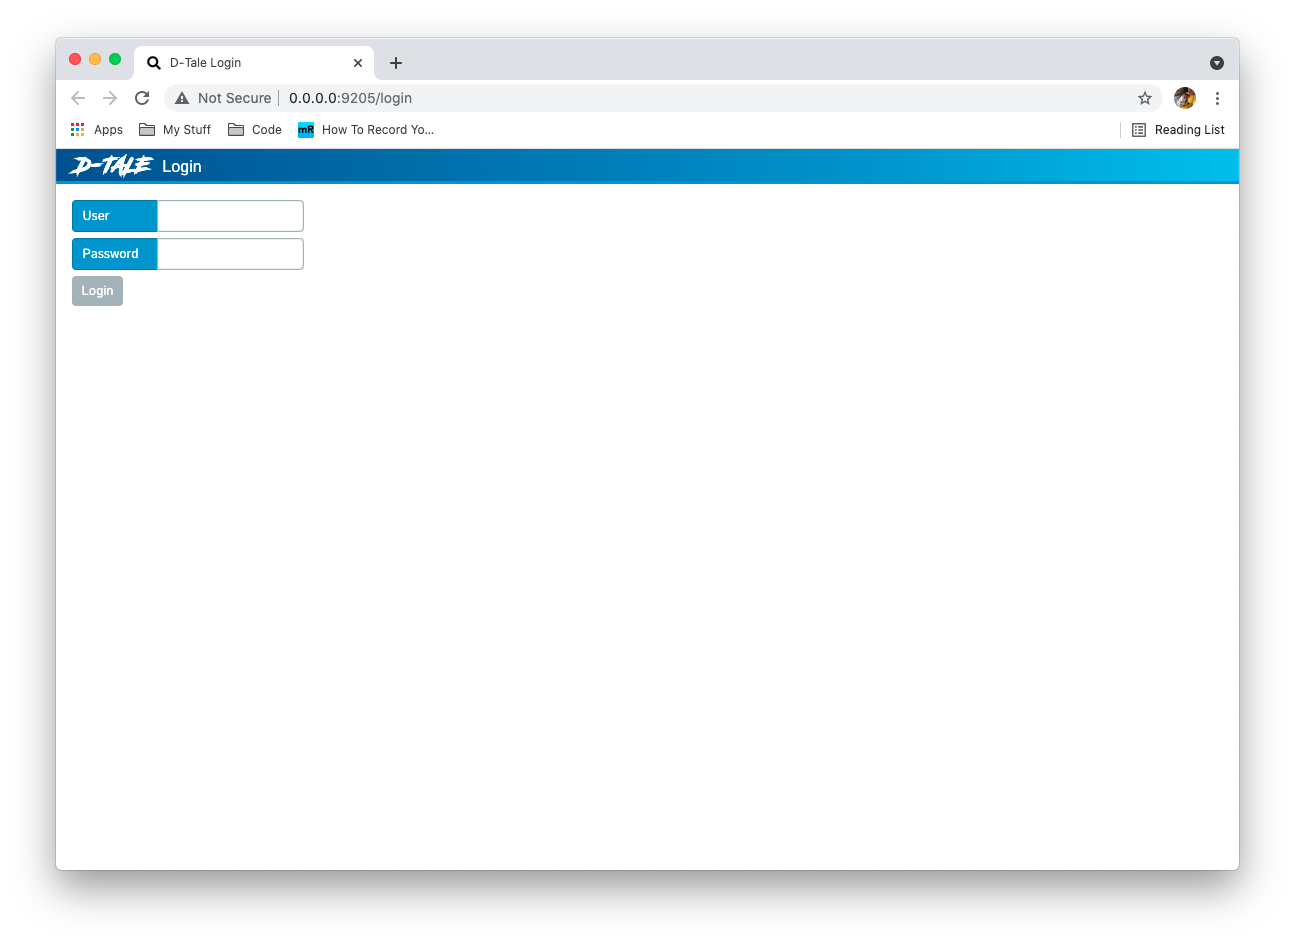
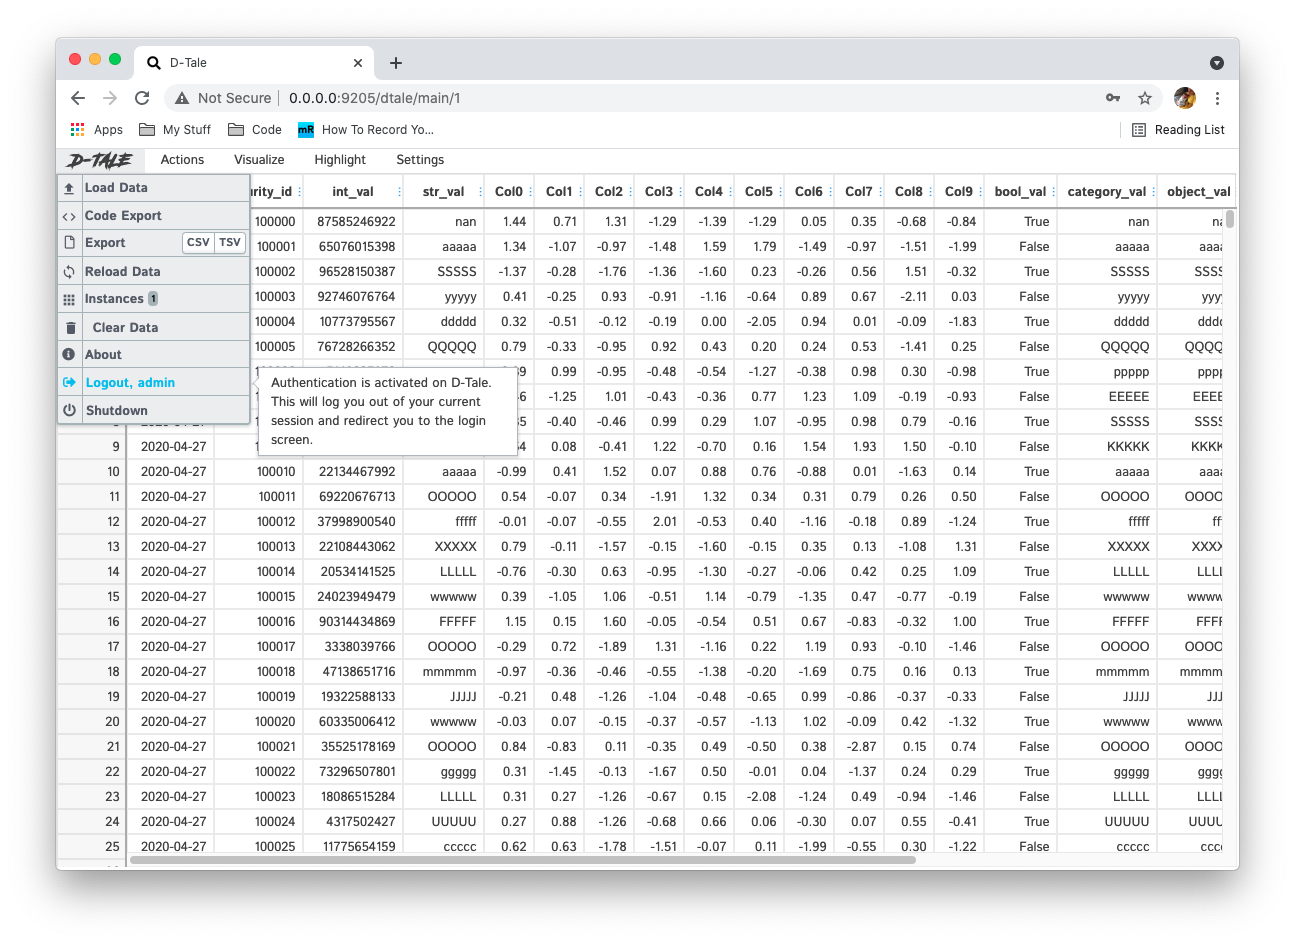
From there you can enter the credentials you either set in your .ini file or in your call to dtale.global_state.set_auth_settings and you will be brought to the main grid as normal. You will now have an additional option in your main menu to logout:
Users can set front-end properties on their instances programmatically in the dtale.show function or by calling the update_settings function on their instance. For example:
import dtale
import pandas as pd

df = pd.DataFrame(dict(
  a=[1,2,3,4,5],
  b=[6,7,8,9,10],
  c=['a','b','c','d','e']
))
dtale.show(
  df,
  locked=['c'],
  column_formats={'a': {'fmt': '0.0000'}},
  nan_display='...',
  background_mode='heatmap-col',
  sort=[('a','DESC')],
  vertical_headers=True,
)
or
import dtale
import pandas as pd

df = pd.DataFrame(dict(
  a=[1,2,3,4,5],
  b=[6,7,8,9,10],
  c=['a','b','c','d','e']
))
d = dtale.show(
  df
)
d.update_settings(
  locked=['c'],
  column_formats={'a': {'fmt': '0.0000'}},
  nan_display='...',
  background_mode='heatmap-col',
  sort=[('a','DESC')],
  vertical_headers=True,
)
d
Here's a short description of each instance setting available:
| Option | Type | Default | Description |
|---|---|---|---|
show_columns |
list | None |
A list of column names you would like displayed in your grid. Anything else will be hidden. |
hide_columns |
list | None |
A list of column names you would like initially hidden from the grid display. |
column_formats |
dict | None |
A dictionary of column name keys and their front-end display configuration. See column_formats below. |
nan_display |
str | None |
Converts any nan values in your dataframe to this when sent to the browser (doesn't change the dataframe). |
sort |
list | None |
List of tuples which sort your dataframe. See sort below. |
locked |
list | None |
List of column names which will be locked to the right side of your grid while you scroll to the left. |
background_mode |
str | None |
A string denoting one of the background display modes. See background_mode below. |
range_highlights |
dict | None |
Dictionary of column name keys and range configurations for conditional highlighting. See range_highlights below. |
vertical_headers |
bool | False |
If True, headers in your grid will be rotated 90 degrees vertically to conserve width. See vertical_headers below. |
precision |
int | 2 |
The default decimal precision for float values. |
theme |
str | "light" |
Display theme for the app. Options are "light" and "dark". |
main_title |
str | None |
Custom title to display in the header and browser tab (replaces "D-Tale"). |
main_title_font |
str | None |
Custom font family to use for the main title (e.g., "Arial", "Helvetica"). |
auto_hide_empty_columns |
bool | False |
If True, auto-hide any columns comprised entirely of NaN values. |
highlight_filter |
bool | False |
If True, highlight rows that match a filter rather than hiding them. |
hide_shutdown |
bool | None |
If True, hide the "Shutdown" button from users. |
hide_header_editor |
bool | None |
If True, hide the header editor when editing cells. |
lock_header_menu |
bool | None |
If True, always display the header menu (normally only shows on hover). |
hide_header_menu |
bool | None |
If True, hide the header menu from the screen. |
hide_main_menu |
bool | None |
If True, hide the main menu from the screen. |
hide_column_menus |
bool | None |
If True, hide the column menus from the screen. |
hide_row_expanders |
bool | None |
If True, hide the row expanders from the screen. |
column_edit_options |
dict | None |
Options to allow on the front-end when editing a cell for specific columns. See column_edit_options below. |
enable_custom_filters |
bool | None |
If True, enable users to create custom filters from the UI. |
enable_web_uploads |
bool | None |
If True, enable users to upload files using URLs from the UI. |
A dictionary of column name keys and their front-end display configuration. Here are examples of the different format configurations:
| Data Type | Format | Description |
|---|---|---|
| Numeric | {'fmt': '0.00000'} |
Format number with 5 decimal places |
| String | {'fmt': {'truncate': 10}} |
Truncate string values to no more than 10 characters followed by an ellipsis |
| String | {'fmt': {'link': True}} |
If your strings are URLs, convert them to clickable links |
| String | {'fmt': {'html': True}} |
If your strings are HTML fragments, render them as HTML |
| Date | {'fmt': 'MMMM Do YYYY, h:mm:ss a'} |
Uses Moment.js formatting |
Example:
column_formats={
    'price': {'fmt': '0.00'},
    'url': {'fmt': {'link': True}},
    'description': {'fmt': {'truncate': 50}},
    'created_date': {'fmt': 'YYYY-MM-DD'}
}
List of tuples which sort your dataframe. Each tuple contains the column name and sort direction ('ASC' or 'DESC').
Example:
sort=[('date', 'DESC'), ('name', 'ASC')]
A string denoting one of the many background displays available in D-Tale.
| Value | Description |
|---|---|
heatmap-all |
Turn on heatmap for all numeric columns where colors are determined by the range of values over all numeric columns combined. |
heatmap-col |
Turn on heatmap for all numeric columns where colors are determined by the range of values in each column. |
heatmap-col-[column name] |
Turn on heatmap highlighting for a specific column (e.g., heatmap-col-price). |
dtypes |
Highlight columns based on their data type. |
missing |
Highlight any missing values (np.nan, empty strings, strings of all spaces). |
outliers |
Highlight any outliers. |
range |
Highlight values for any matchers entered in the range_highlights option. |
lowVariance |
Highlight values with a low variance. |
Dictionary of column name keys and range configurations. If the value for that column matches a condition, it will be shaded with the specified color.
Example:
range_highlights={
    'a': {
        'active': True,
        'equals': {'active': True, 'value': 3, 'color': {'r': 255, 'g': 245, 'b': 157, 'a': 1}},      # light yellow
        'greaterThan': {'active': True, 'value': 3, 'color': {'r': 80, 'g': 227, 'b': 194, 'a': 1}},  # mint green
        'lessThan': {'active': True, 'value': 3, 'color': {'r': 245, 'g': 166, 'b': 35, 'a': 1}},     # orange
    }
}
Each column can have the following range conditions:
| Condition | Description |
|---|---|
equals |
Highlight cells where the value equals the specified value |
greaterThan |
Highlight cells where the value is greater than the specified value |
lessThan |
Highlight cells where the value is less than the specified value |
Each condition has these properties:
active: Whether this condition is enabled (True/False)value: The value to compare againstcolor: RGBA color object with keys r, g, b, a (values 0-255 for RGB, 0-1 for alpha)If set to True then the headers in your grid will be rotated 90 degrees vertically to conserve width.
Dictionary of column name keys and lists of allowed values. When editing a cell in the specified column, users will be presented with a dropdown of the allowed values instead of free-form text input.
Example:
column_edit_options={
    'status': ['pending', 'approved', 'rejected'],
    'priority': ['low', 'medium', 'high', 'critical']
}
Users can build their own custom filters which can be used from the front-end using the following code snippet:
import pandas as pd
import dtale
import dtale.predefined_filters as predefined_filters
import dtale.global_state as global_state

global_state.set_app_settings(dict(open_predefined_filters_on_startup=True))

predefined_filters.set_filters([
    {
        "name": "A and B > 2",
        "column": "A",
        "description": "Filter A with B greater than 2",
        "handler": lambda df, val: df[(df["A"] == val) & (df["B"] > 2)],
        "input_type": "input",
        "default": 1,
        "active": False,
    },
    {
        "name": "A and (B % 2) == 0",
        "column": "A",
        "description": "Filter A with B mod 2 equals zero (is even)",
        "handler": lambda df, val: df[(df["A"] == val) & (df["B"] % 2 == 0)],
        "input_type": "select",
        "default": 1,
        "active": False,
    },
    {
        "name": "A in values and (B % 2) == 0",
        "column": "A",
        "description": "A is within a group of values and B mod 2 equals zero (is even)",
        "handler": lambda df, val: df[df["A"].isin(val) & (df["B"] % 2 == 0)],
        "input_type": "multiselect",
        "default": [1],
        "active": True,
    }
])

df = pd.DataFrame(
    ([[1, 2, 3, 4, 5, 6], [7, 8, 9, 10, 11, 12], [13, 14, 15, 16, 17, 18]]),
    columns=['A', 'B', 'C', 'D', 'E', 'F']
)
dtale.show(df)
This code illustrates the types of inputs you can have on the front end:
"column" is an int or float it will try to convert the string to that data type) and it will be passed to the handler"column" (an asynchronous dropdown if the column has a large amount of unique values)isin operation in your filter)Here is a demo of the functionality:
If there are any new types of inputs you would like available please don't hesitate to submit a request on the "Issues" page of the repo.
Swifter is a package which will increase performance on any apply() function on a pandas series or dataframe. If install the package in your virtual environment
pip install swifter
# or
pip install dtale[swifter]
It will be used for the following operations:
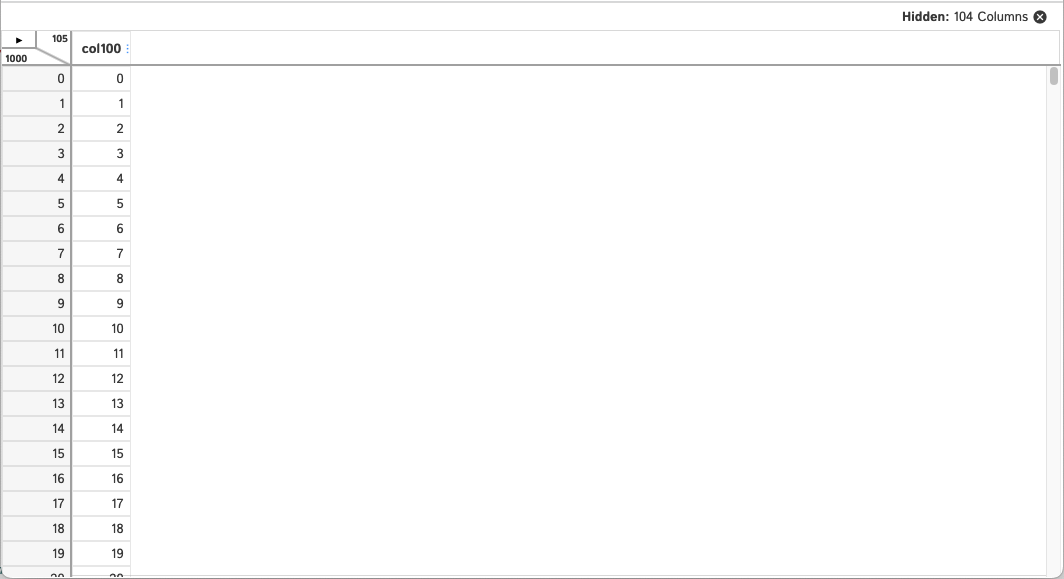
There is currently a performance bottleneck on the front-end when loading "wide dataframes" (dataframes with many columns). The current solution to this problem is that upon initial load of these dataframes to D-Tale any column with an index greater than 100 (going from left to right) will be hidden on the front-end. You can still unhide these columns the same way you would any other and you still have the option to show all columns using the "Describe" popup. Here's a sample of this behavior:
Say you loaded this dataframe into D-Tale.
import pandas as pd
import dtale

dtale.show(pd.DataFrame(
    {'col{}'.format(i): list(range(1000)) for i in range(105)}
))
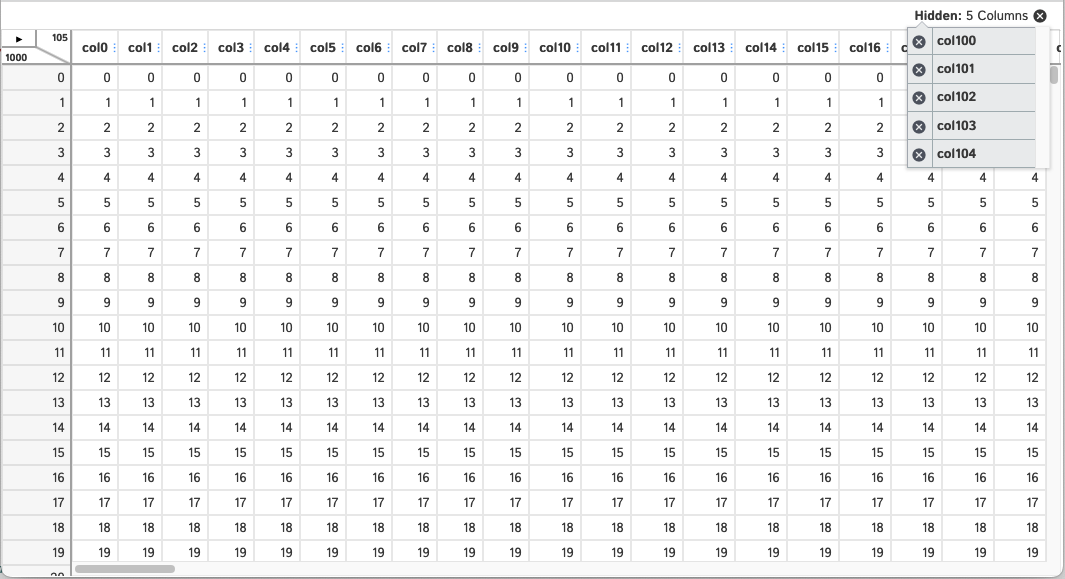
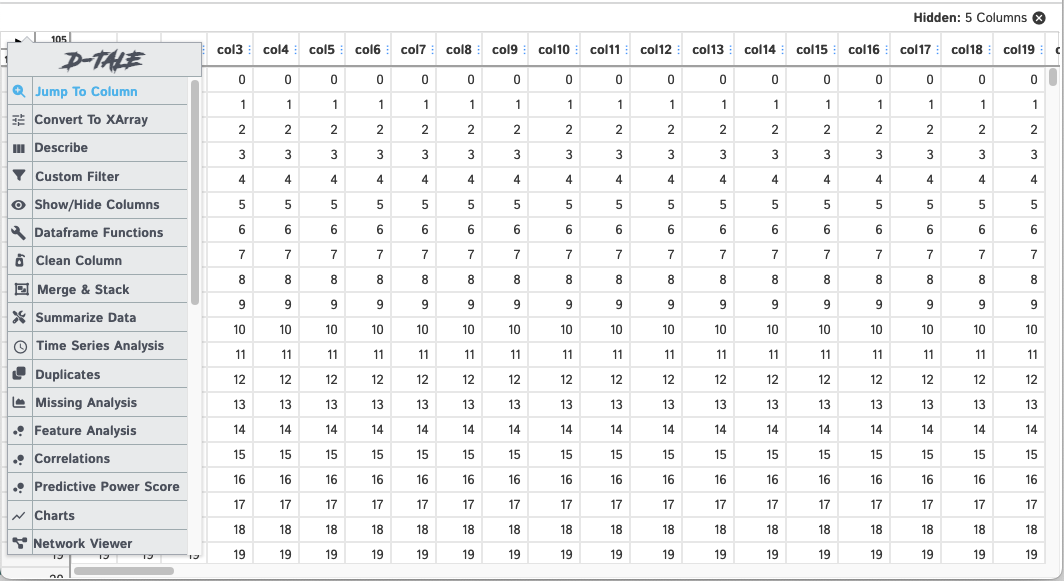
You will now have access to a new "Jump To Column" menu item.
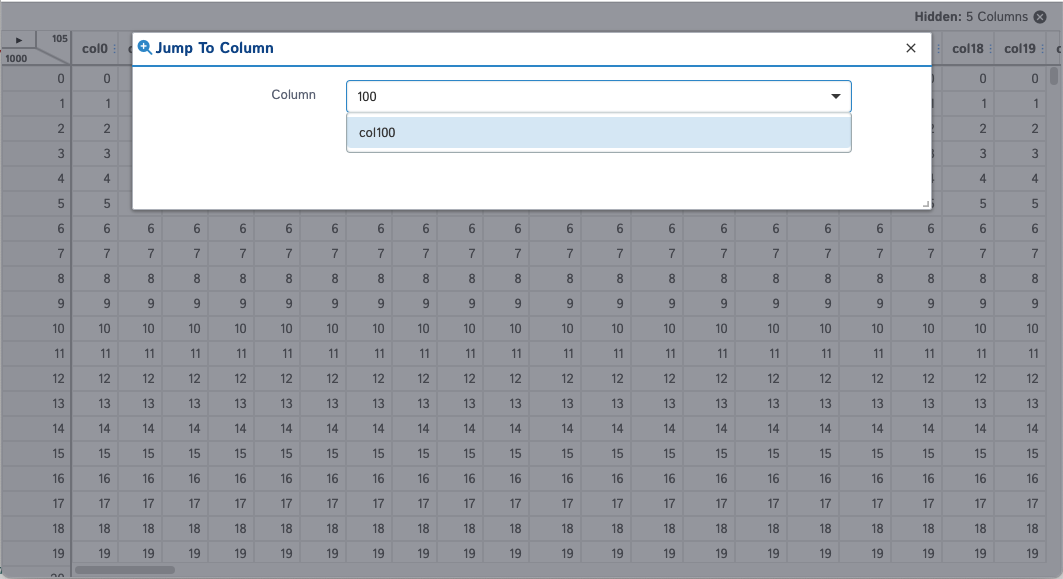
It would be too hard to scroll to the column you're looking for. So now you'll be able to type in the name of the column you're looking for and select it.
And now you'll see only the columns you've had locked (we've locked no columns in this example) and the column you chose to jump to.
I am pleased to announce that all CLI loaders will be available within notebooks & consoles. Here are some examples (the last working if you've installed dtale[arctic]):
dtale.show_csv(path='test.csv', parse_dates=['date'])dtale.show_csv(path='http://csv-endpoint', index_col=0)dtale.show_excel(path='test.xlsx', parse_dates=['date'])dtale.show_excel(path='test.xls', sheet=)dtale.show_excel(path='http://excel-endpoint', index_col=0)dtale.show_json(path='http://json-endpoint', parse_dates=['date'])dtale.show_json(path='test.json', parse_dates=['date'])dtale.show_r(path='text.rda')dtale.show_arctic(uri='uri', library='library', symbol='symbol', start='20200101', end='20200101')dtale.show_arcticdb(uri='uri', library='library', symbol='symbol', start='20200101', end='20200101', use_store=True)So one of the major drawbacks of using D-Tale is that it stores a copy of your dataframe in memory (unless you specify the inplace=True when calling dtale.show). One way around this is to switch your storage mechanism to ArcticDB. This will use ArcticDB's QueryBuilder to perform all data loading and filtering. This will significantly drop your memory footprint, but it will remove a lot of the original D-Tale functionality:
If the symbol you're loading from ArcticDB contains more than 1,000,000 rows then you will also lose the following:
In order to update your storage mechanism there are a few options, the first being use_arcticdb_store:
import dtale.global_state as global_state
import dtale

global_state.use_arcticdb_store(uri='lmdb:///<path>')
dtale.show_arcticdb(library='my_lib', symbol='my_symbol')
Or you can set your library ahead of time so you can use dtale.show:
import dtale.global_state as global_state
import dtale

global_state.use_arcticdb_store(uri='lmdb:///<path>', library='my_lib')
dtale.show('my_symbol')
Or you can set your library using dtale.show with a pipe-delimited identifier:
import dtale.global_state as global_state
import dtale

global_state.use_arcticdb_store(uri='lmdb:///<path>')
dtale.show('my_lib|my_symbol')
You can also do everything using dtale.show_arcticdb:
import dtale

dtale.show_arcticdb(uri='lmdb:///<path>', library='my_lib', symbol='my_symbol', use_store=True)
When starting D-Tale with no data
import dtale.global_state as global_state
import dtale

global_state.use_arcticdb_store(uri='lmdb:///<path>')
dtale.show()
you'll be presented with this screen on startup
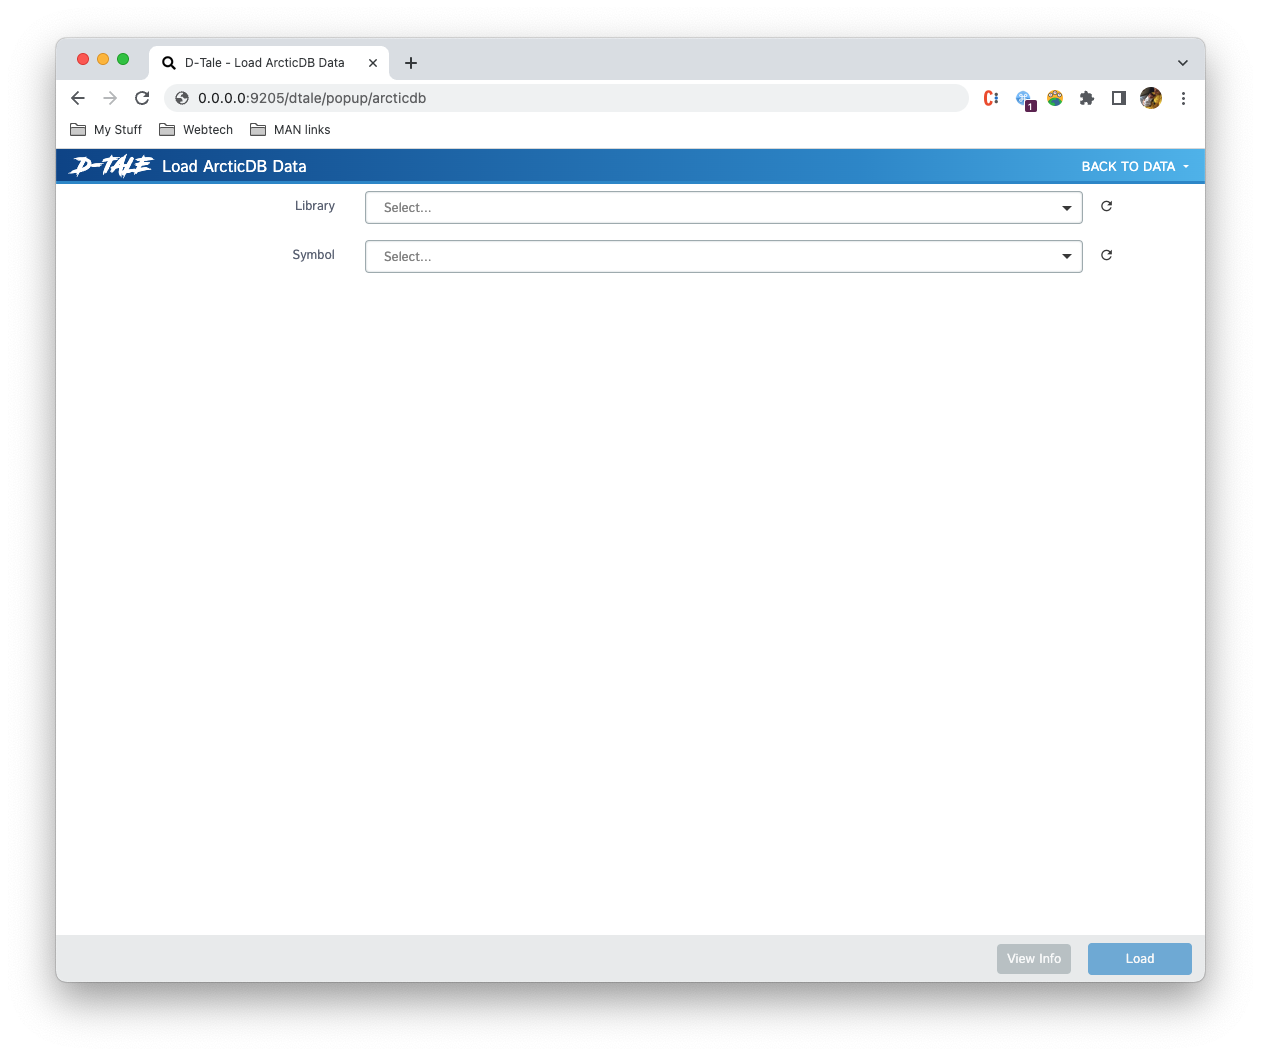
Once you choose a library and a symbol you can click "Load" and it will bring you to the main grid comprised of the data for that symbol.
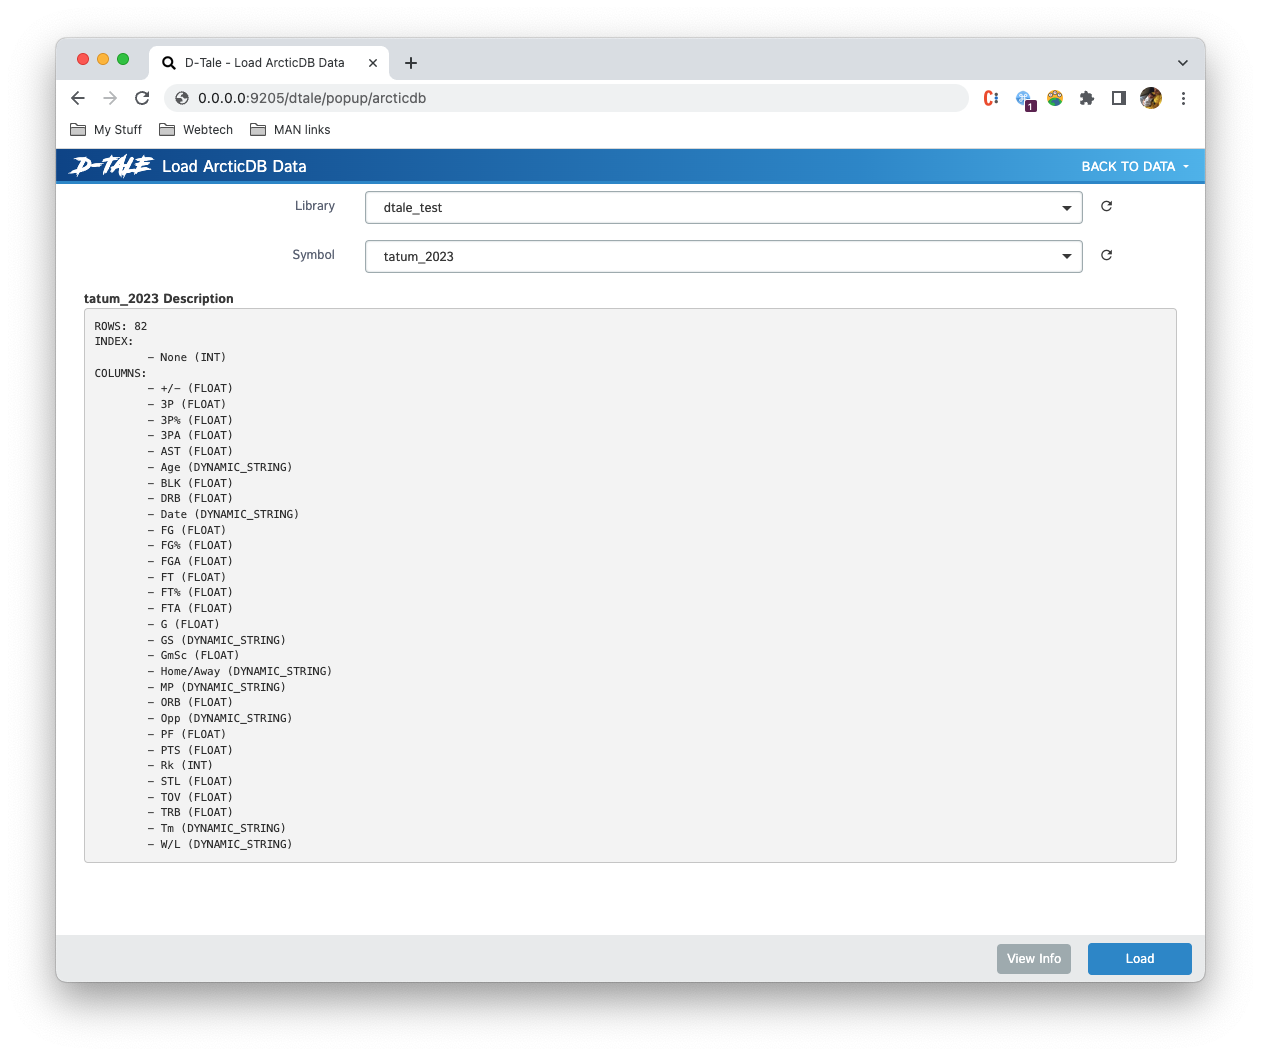
You can also view information about the symbol you've selected before loading it by clicking the "Info" button
Once you have kicked off your D-Tale session please copy & paste the link on the last line of output in your browser
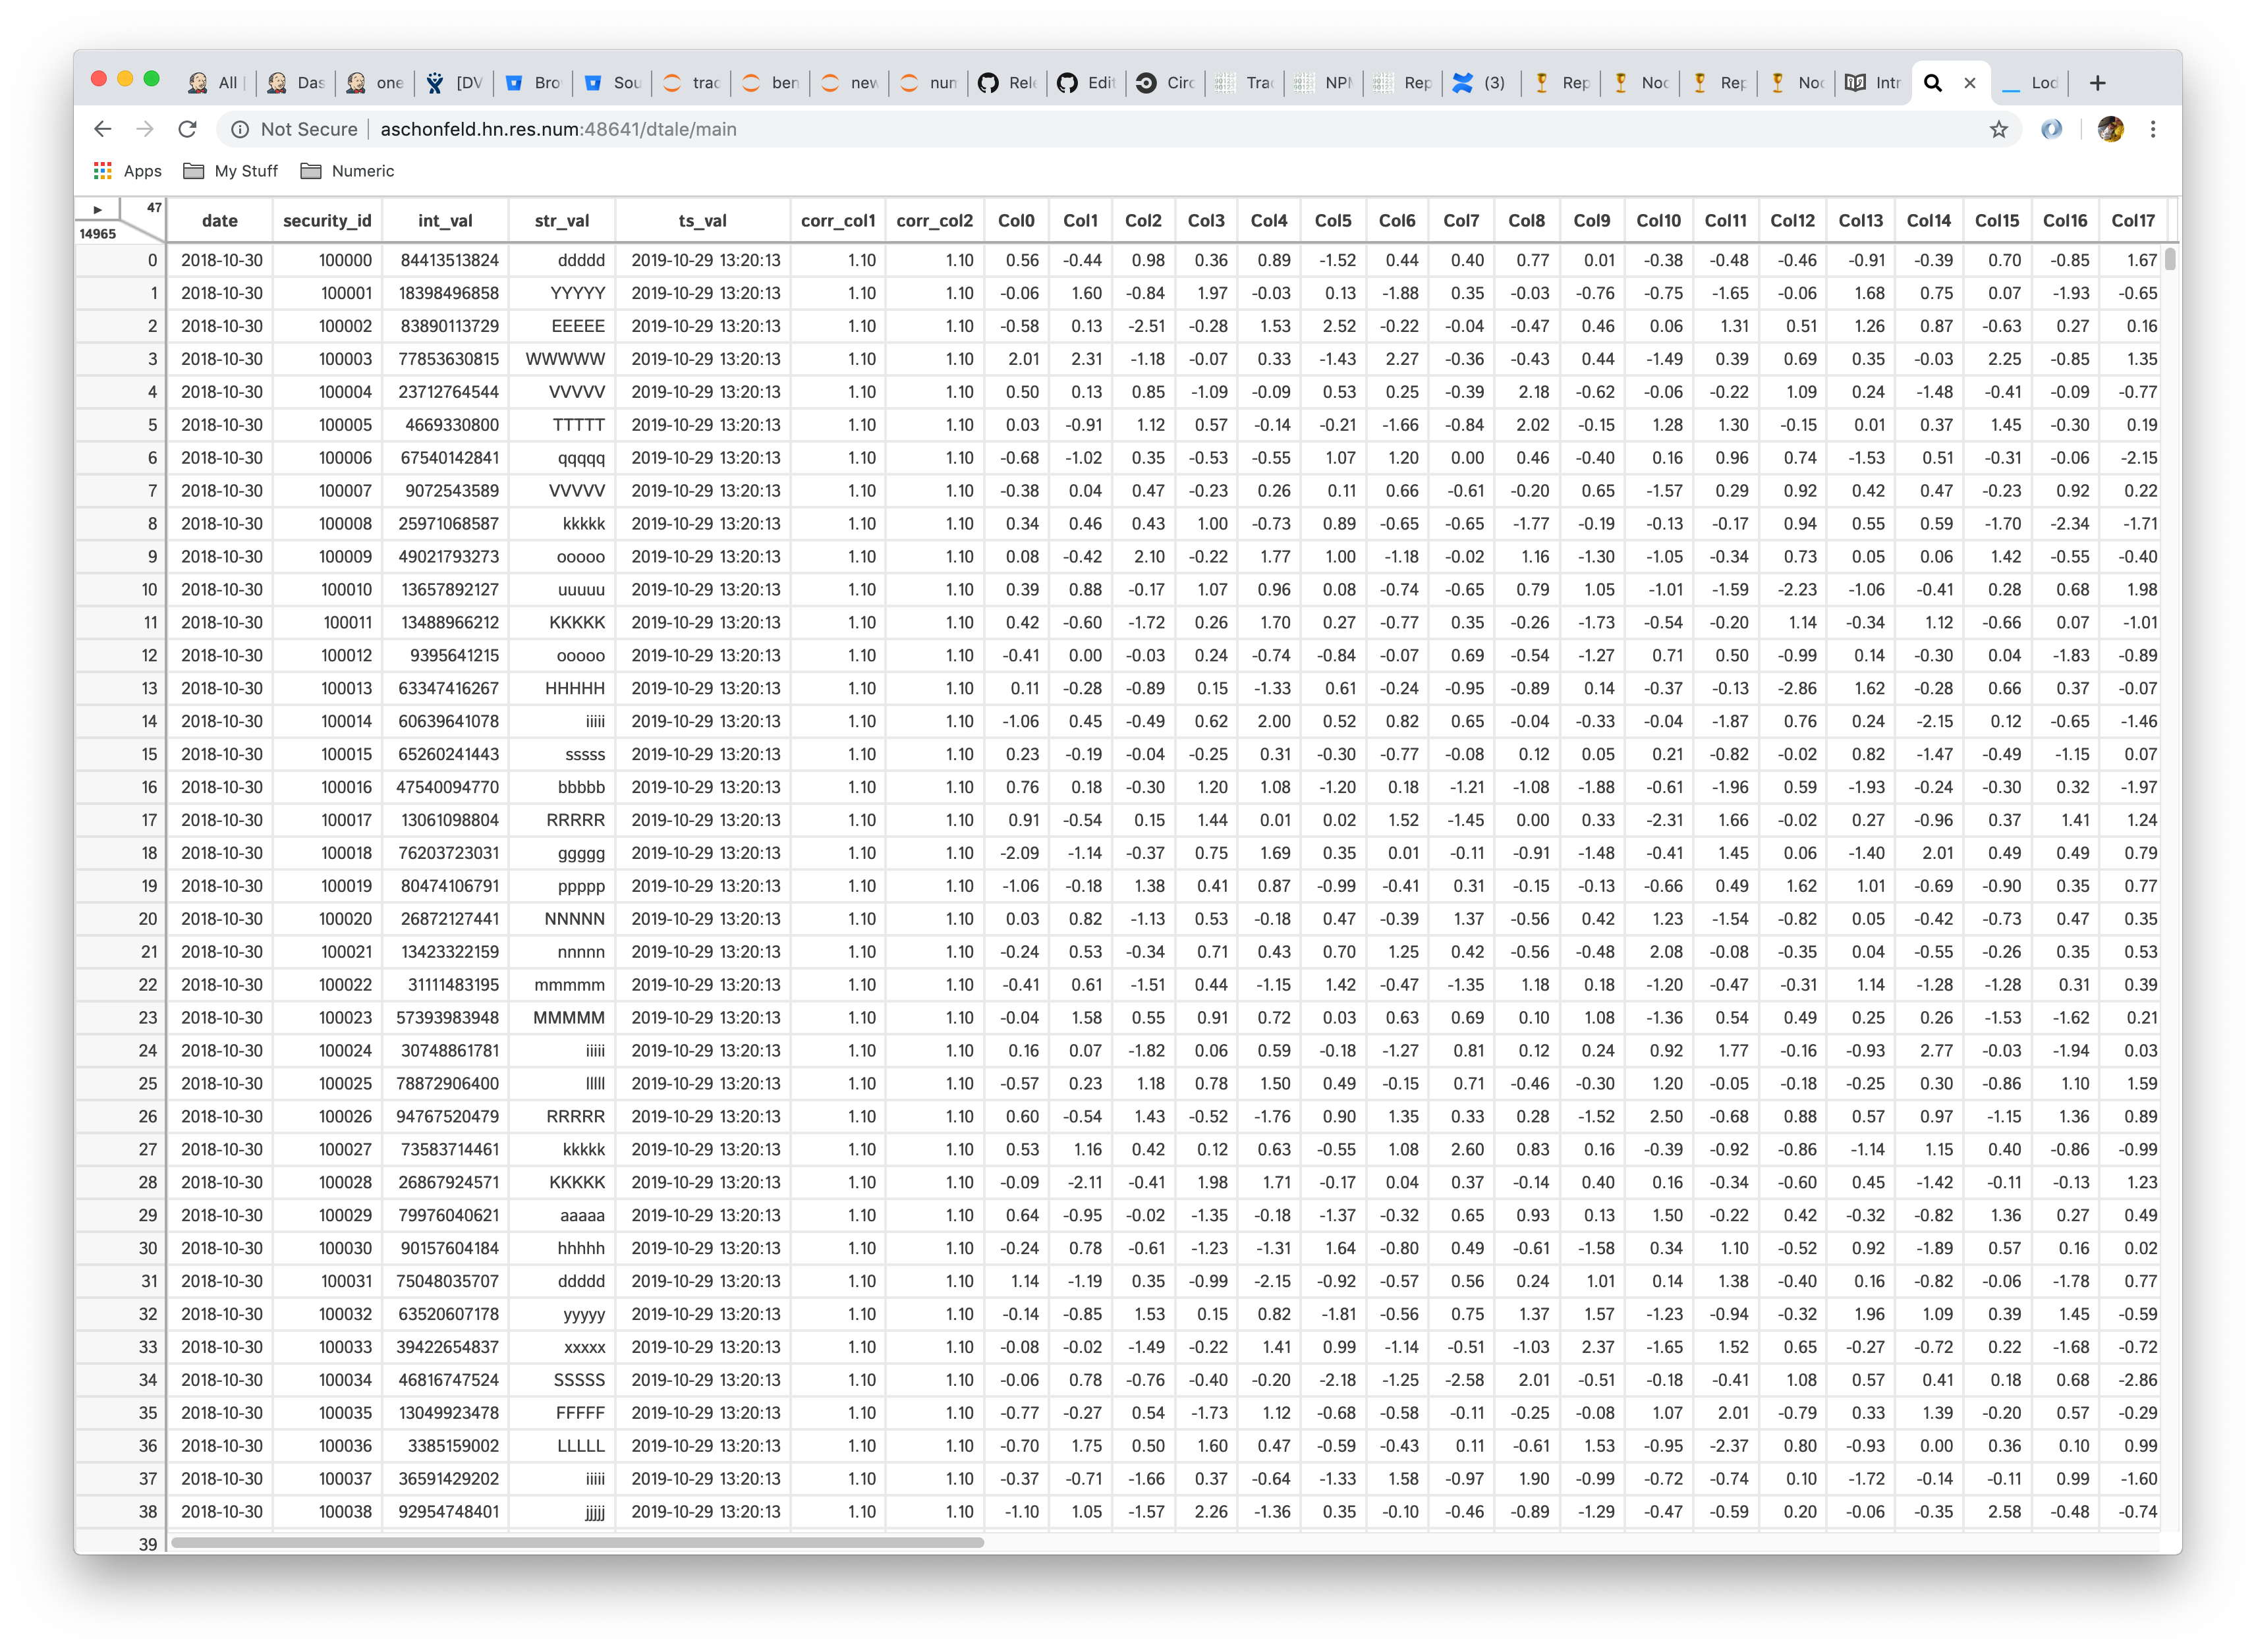
The information in the upper right-hand corner gives grid dimensions 
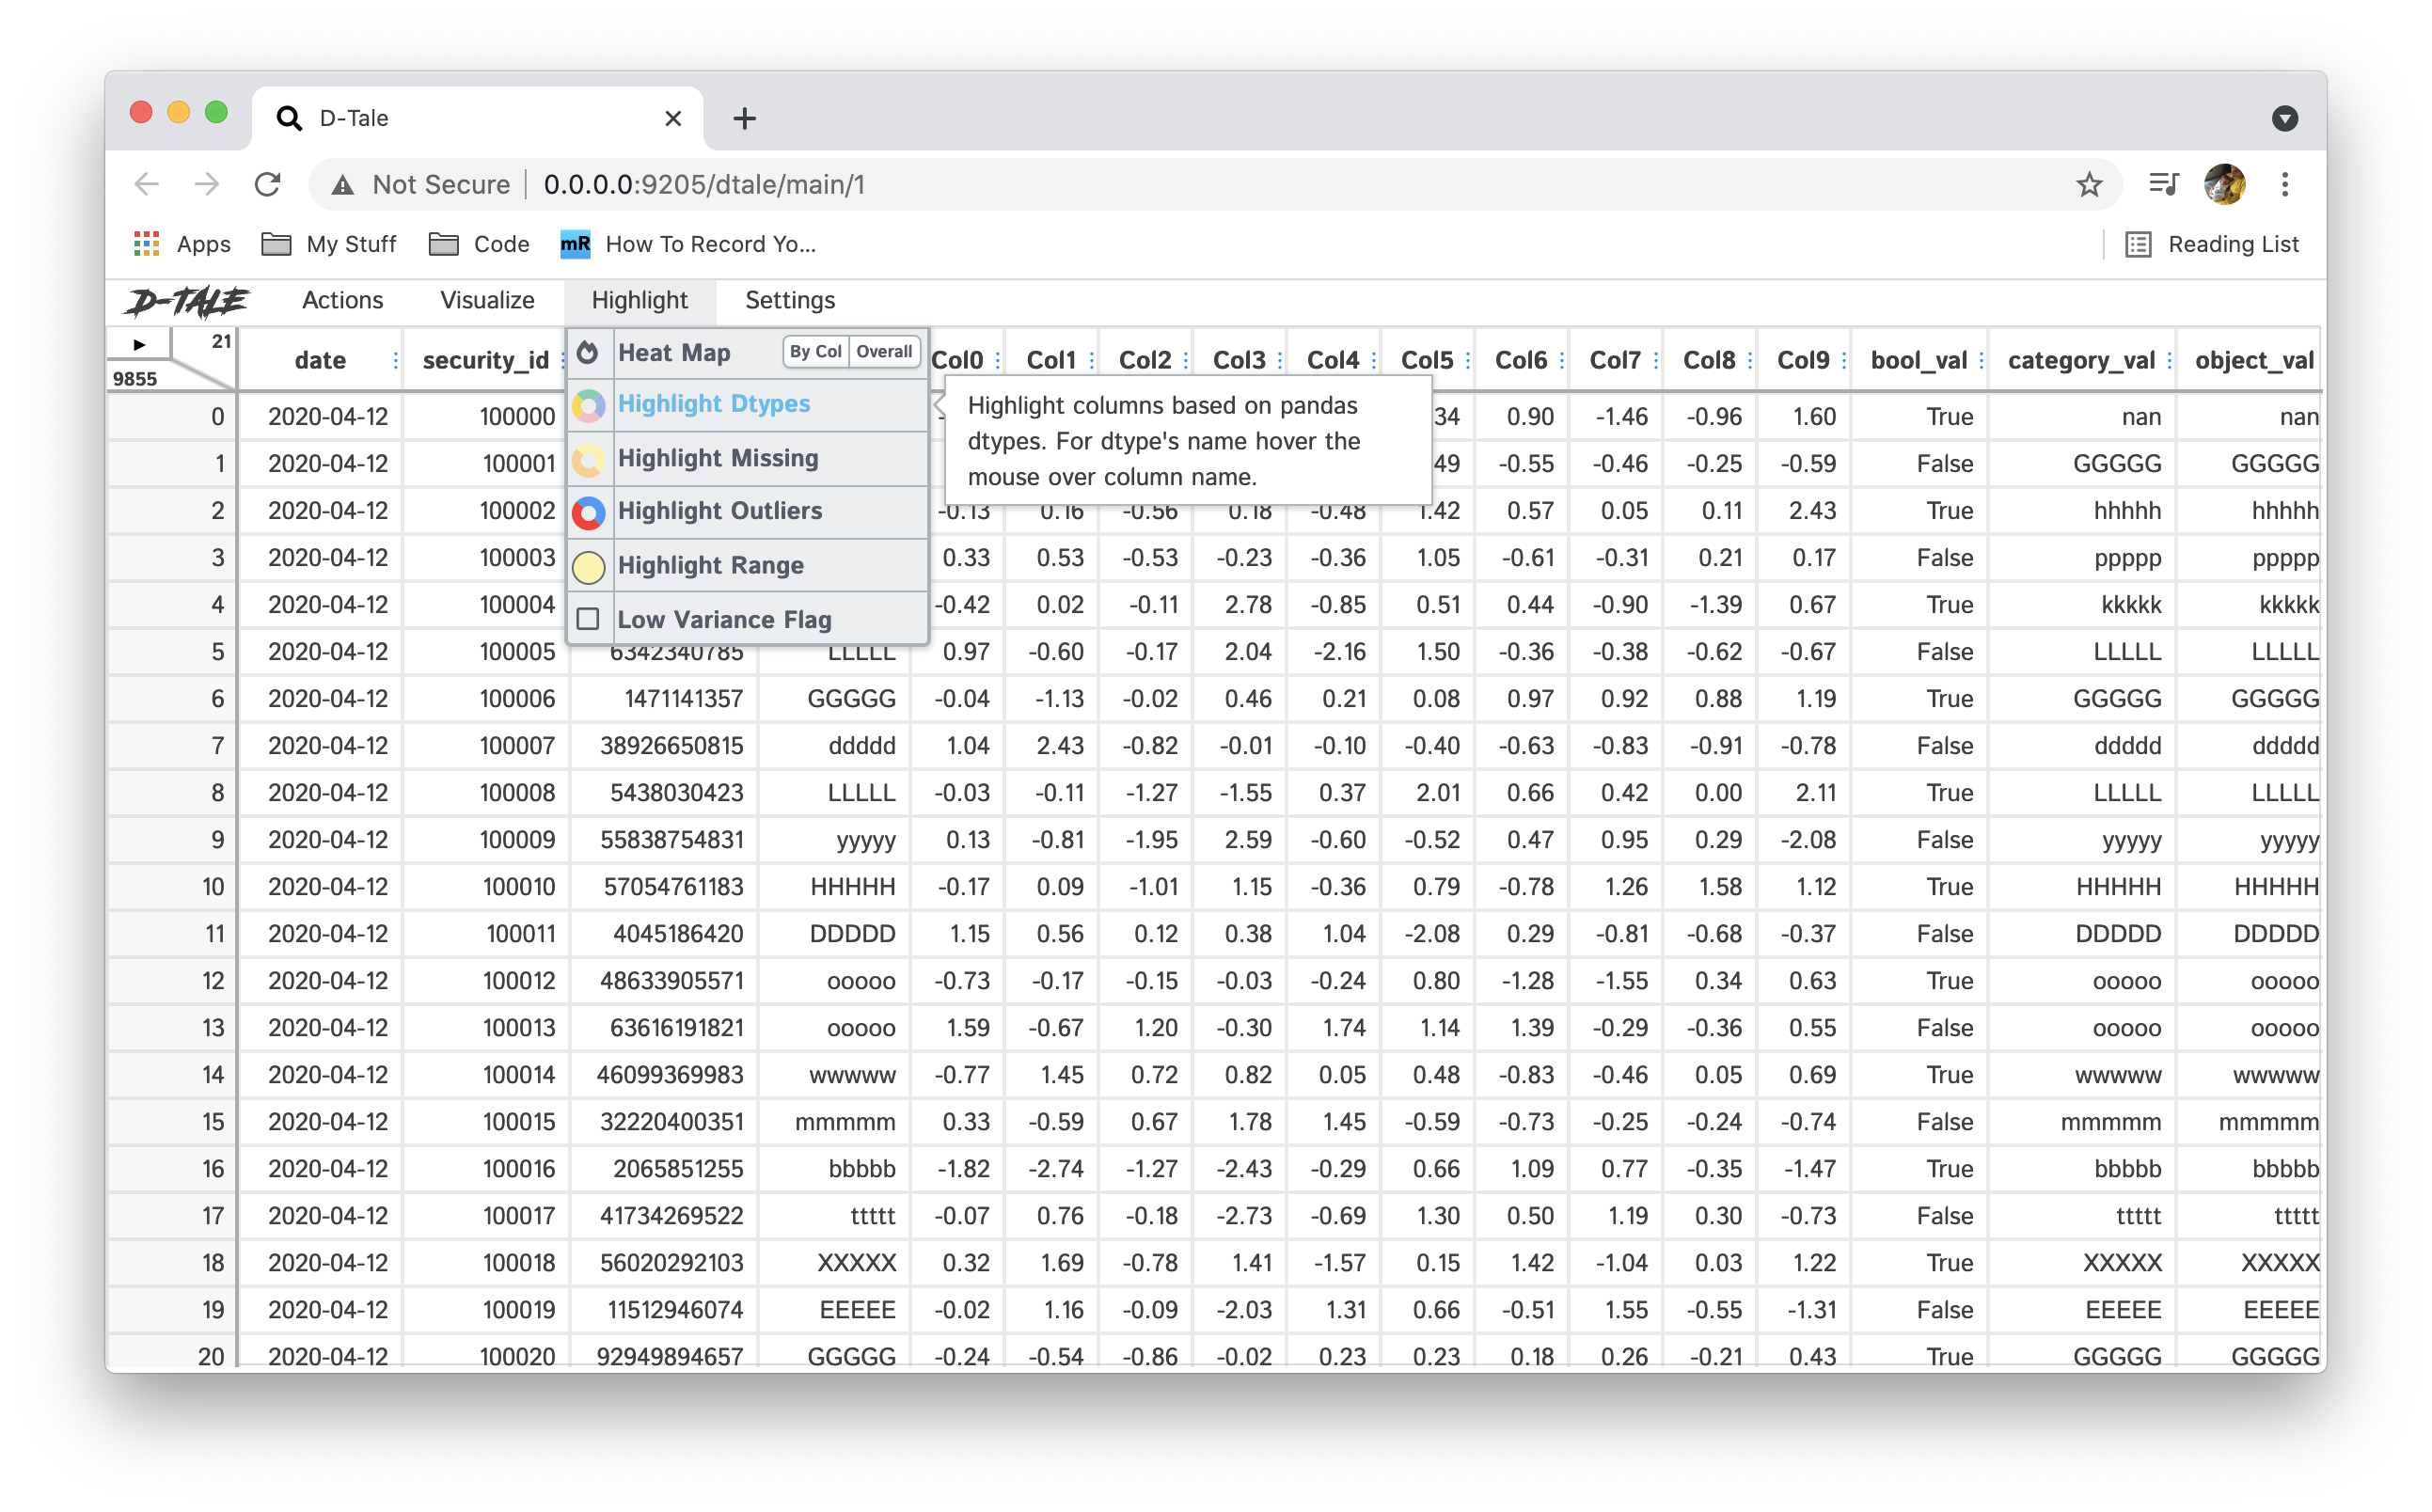
Ribbon Menu
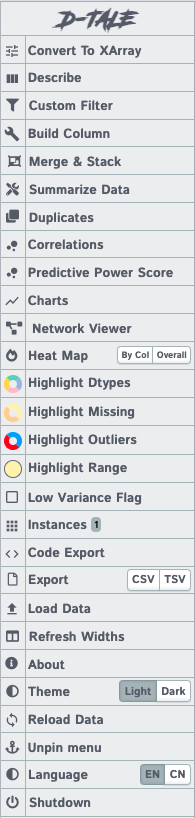
Main Menu
The header gives users an idea of what operations have taken place on your data (sorts, filters, hidden columns). These values will be persisted across broswer instances. So if you perform one of these operations and then send a link to one of your colleagues they will see the same thing :)
Notice the "X" icon on the right of each display. Clicking this will remove those operations.
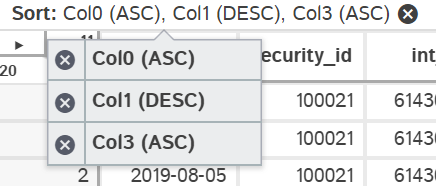
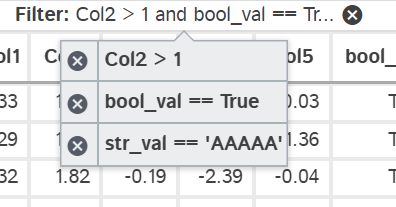
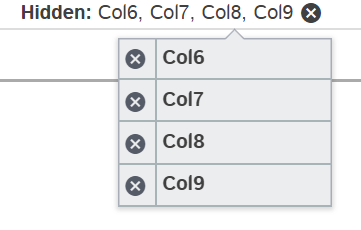
When performing multiple of the same operation the description will become too large to display so the display will truncate the description and if users click it they will be presented with a tooltip where you can crop individual operations. Here are some examples:
| Sorts | Filters | Hidden Columns |
|---|---|---|
 |
 |
 |
Currently there are two ways which you can resize columns.
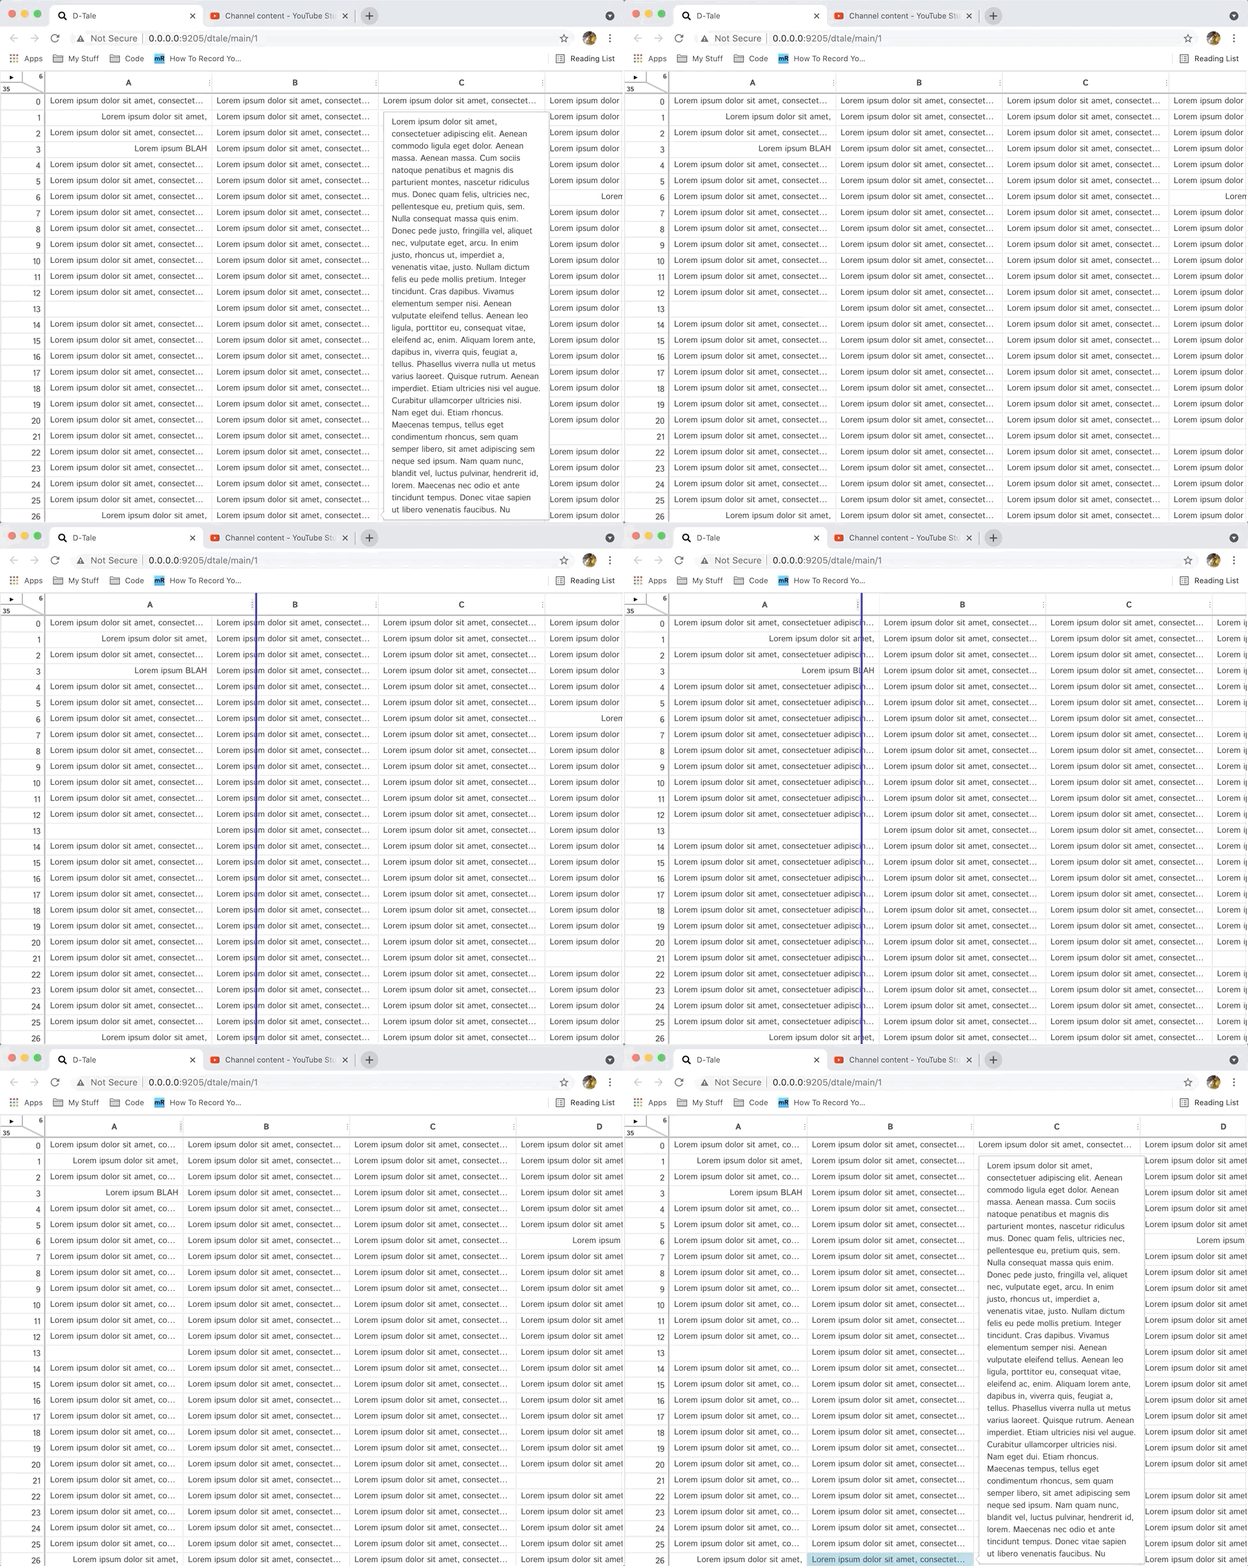
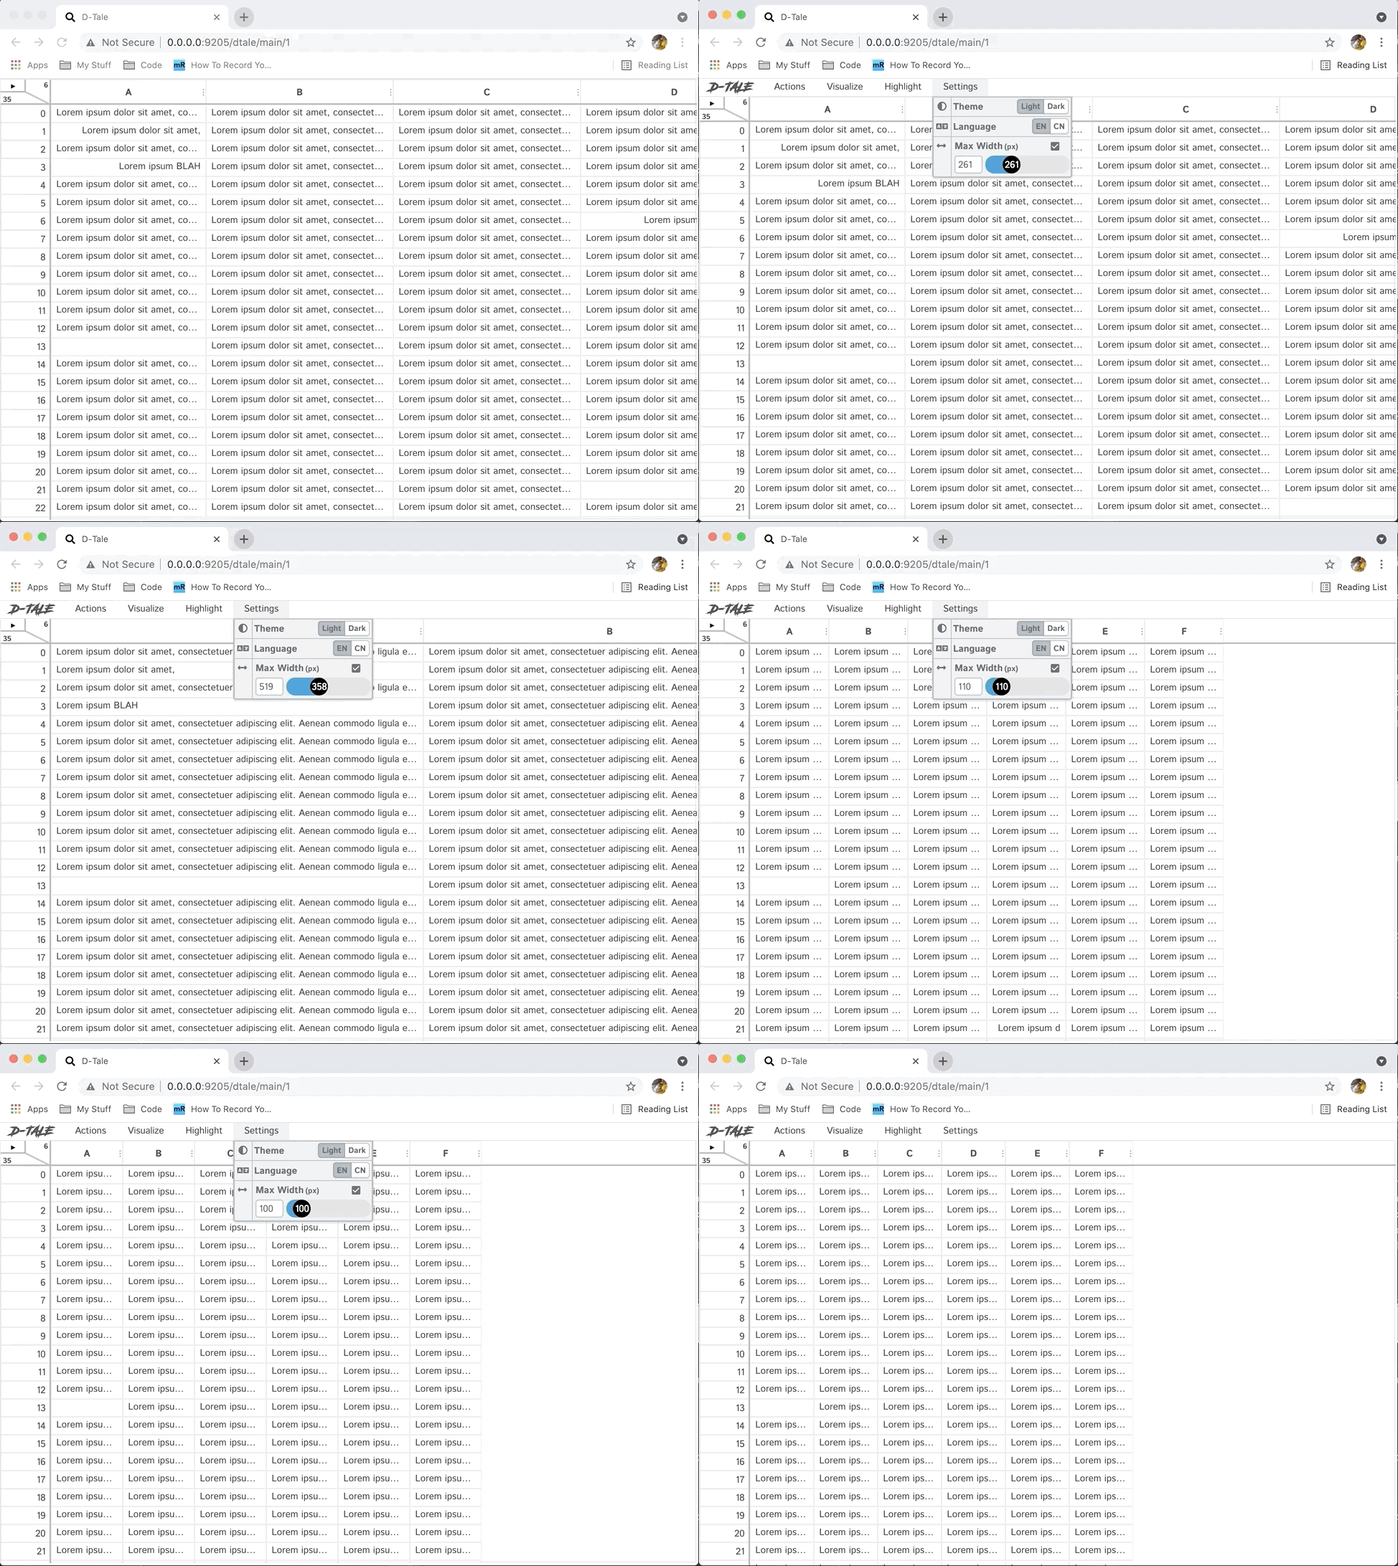
max_column_width property ahead of time in your global configuration or programmatically using:import dtale.global_state as global_state global_state.set_app_settings(dict(max_column_width=100))
You may edit any cells in your grid (with the exception of the row indexes or headers, the ladder can be edited using the Rename column menu function).
In order to edit a cell simply double-click on it. This will convert it into a text-input field and you should see a blinking cursor. In addition to turning that cell into an input it will also display an input at the top of the screen for better viewing of long strings. It is assumed that the value you type in will match the data type of the column you editing. For example:
True, otherwise FalseUsers can make use of two protected values as well:
numpy.nannumpy.infTo save your change simply press "Enter" or to cancel your changes press "Esc".
If there is a conversion issue with the value you have entered it will display a popup with the specific exception in question.
Here's a quick demo:
Here's a demo of editing cells with long strings:
| Select | Copy | Paste |
|---|---|---|
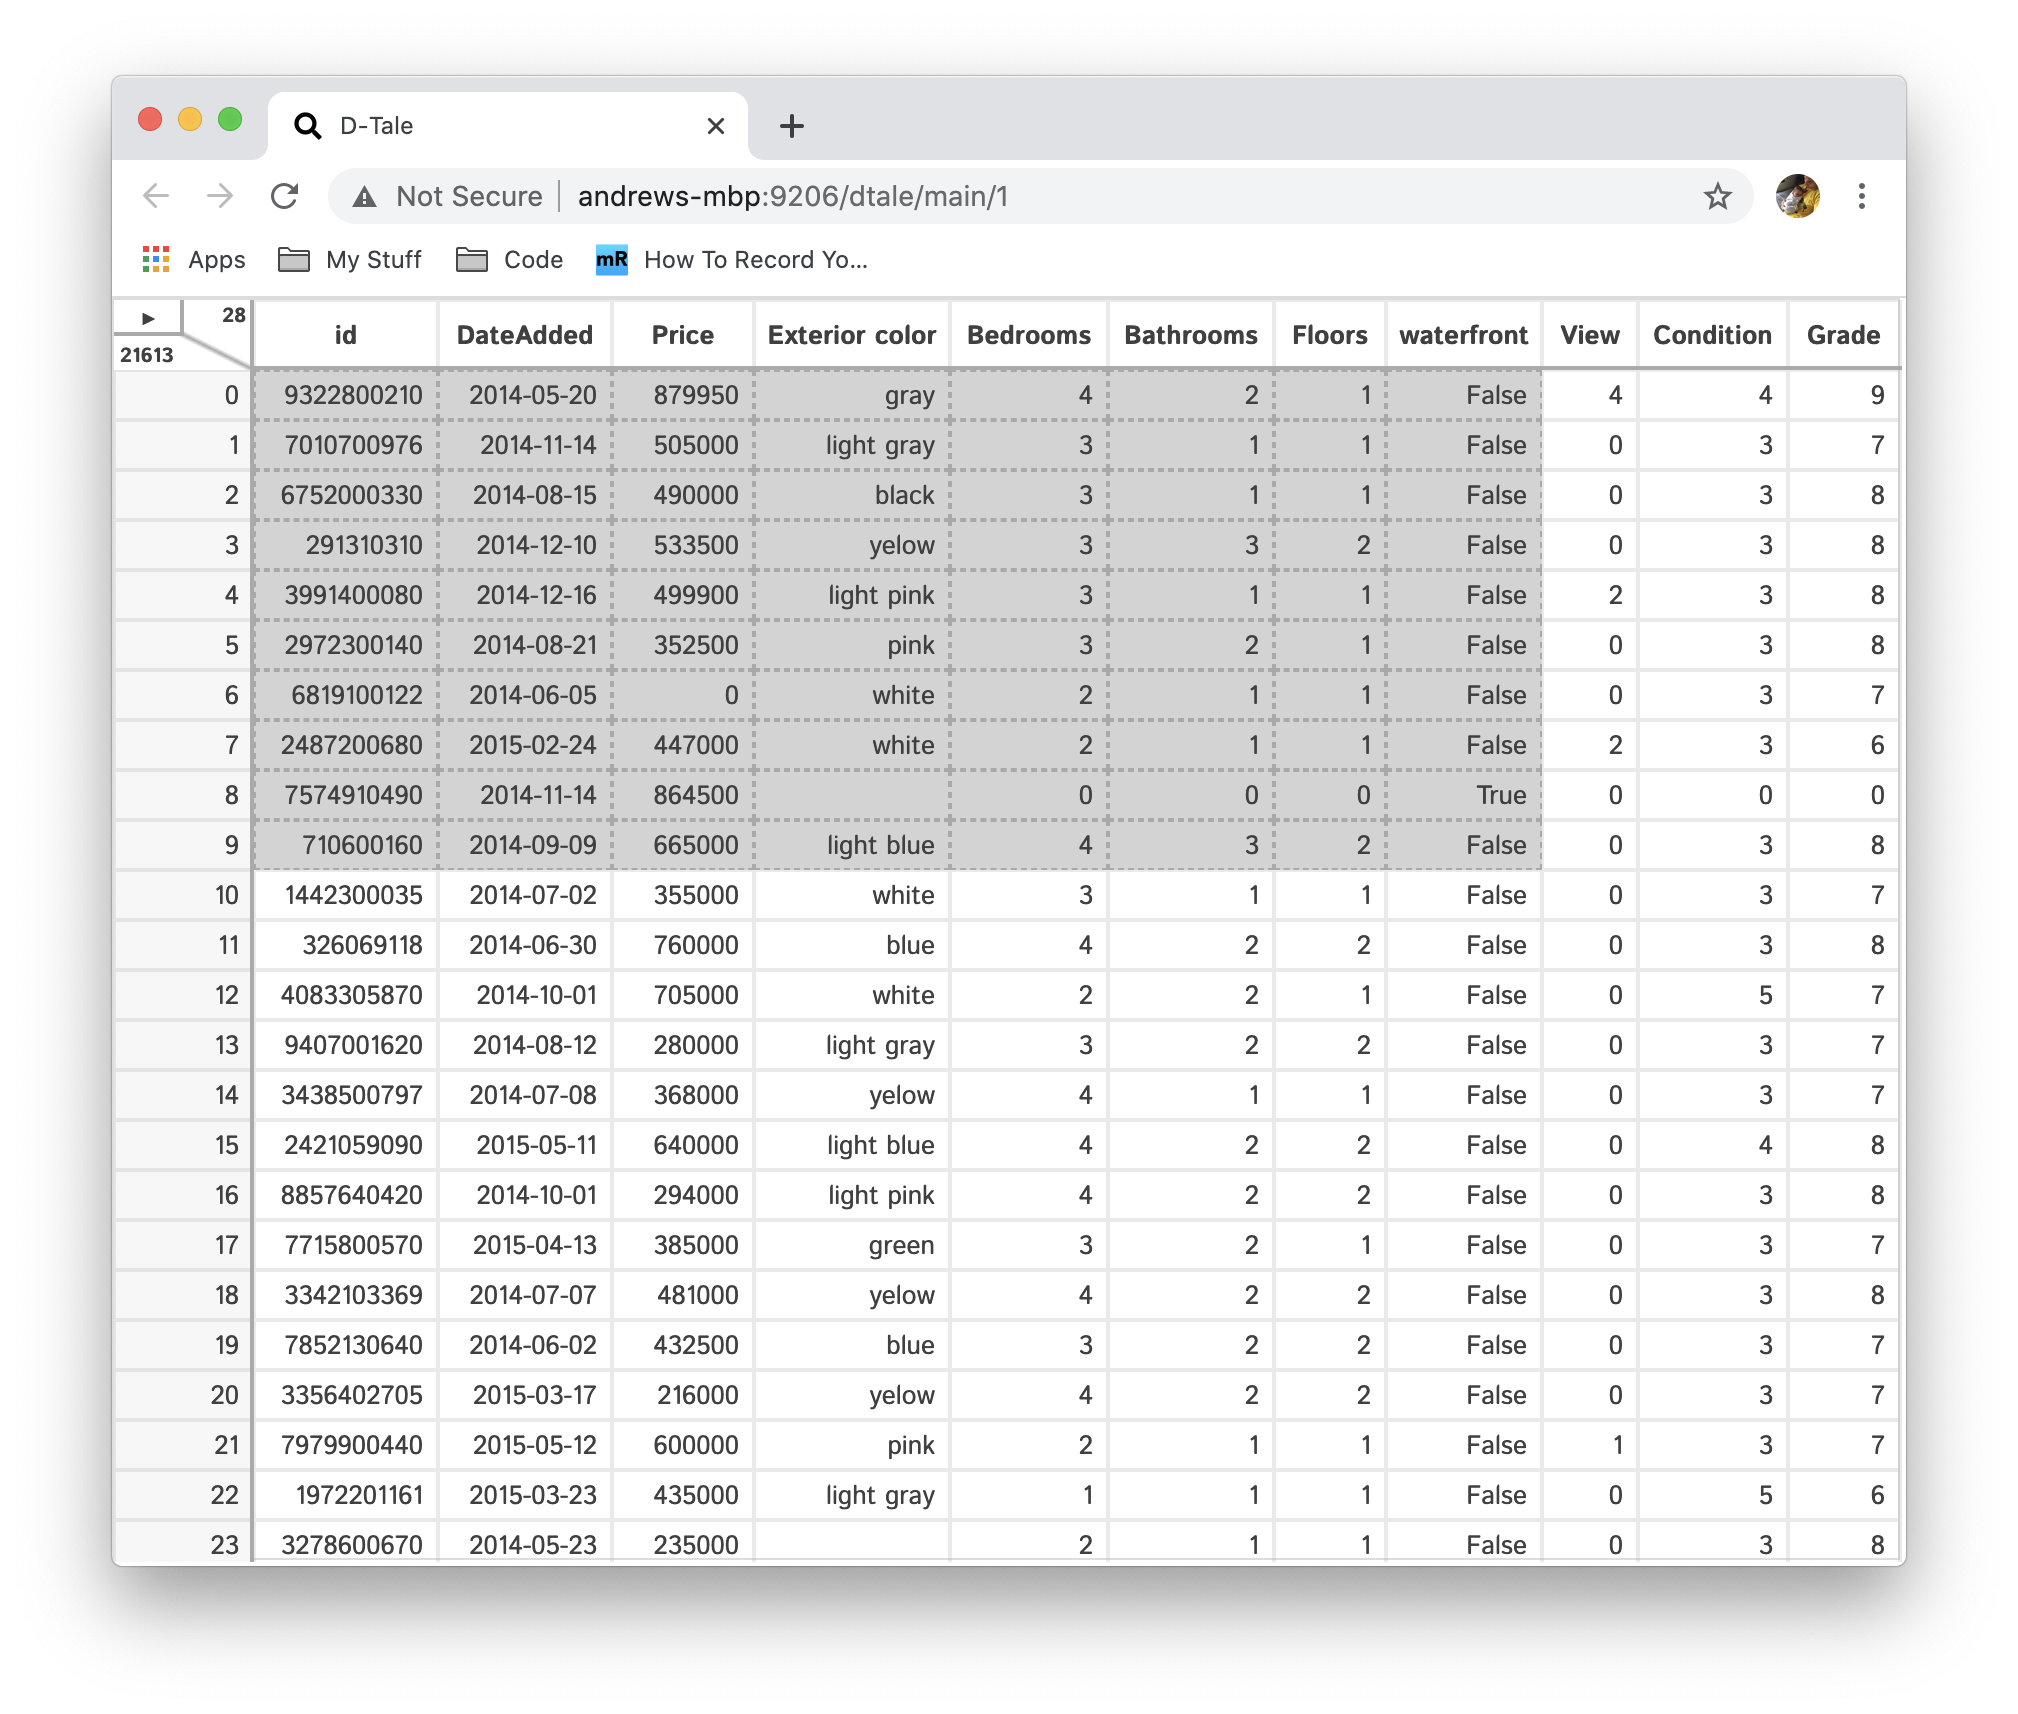 |
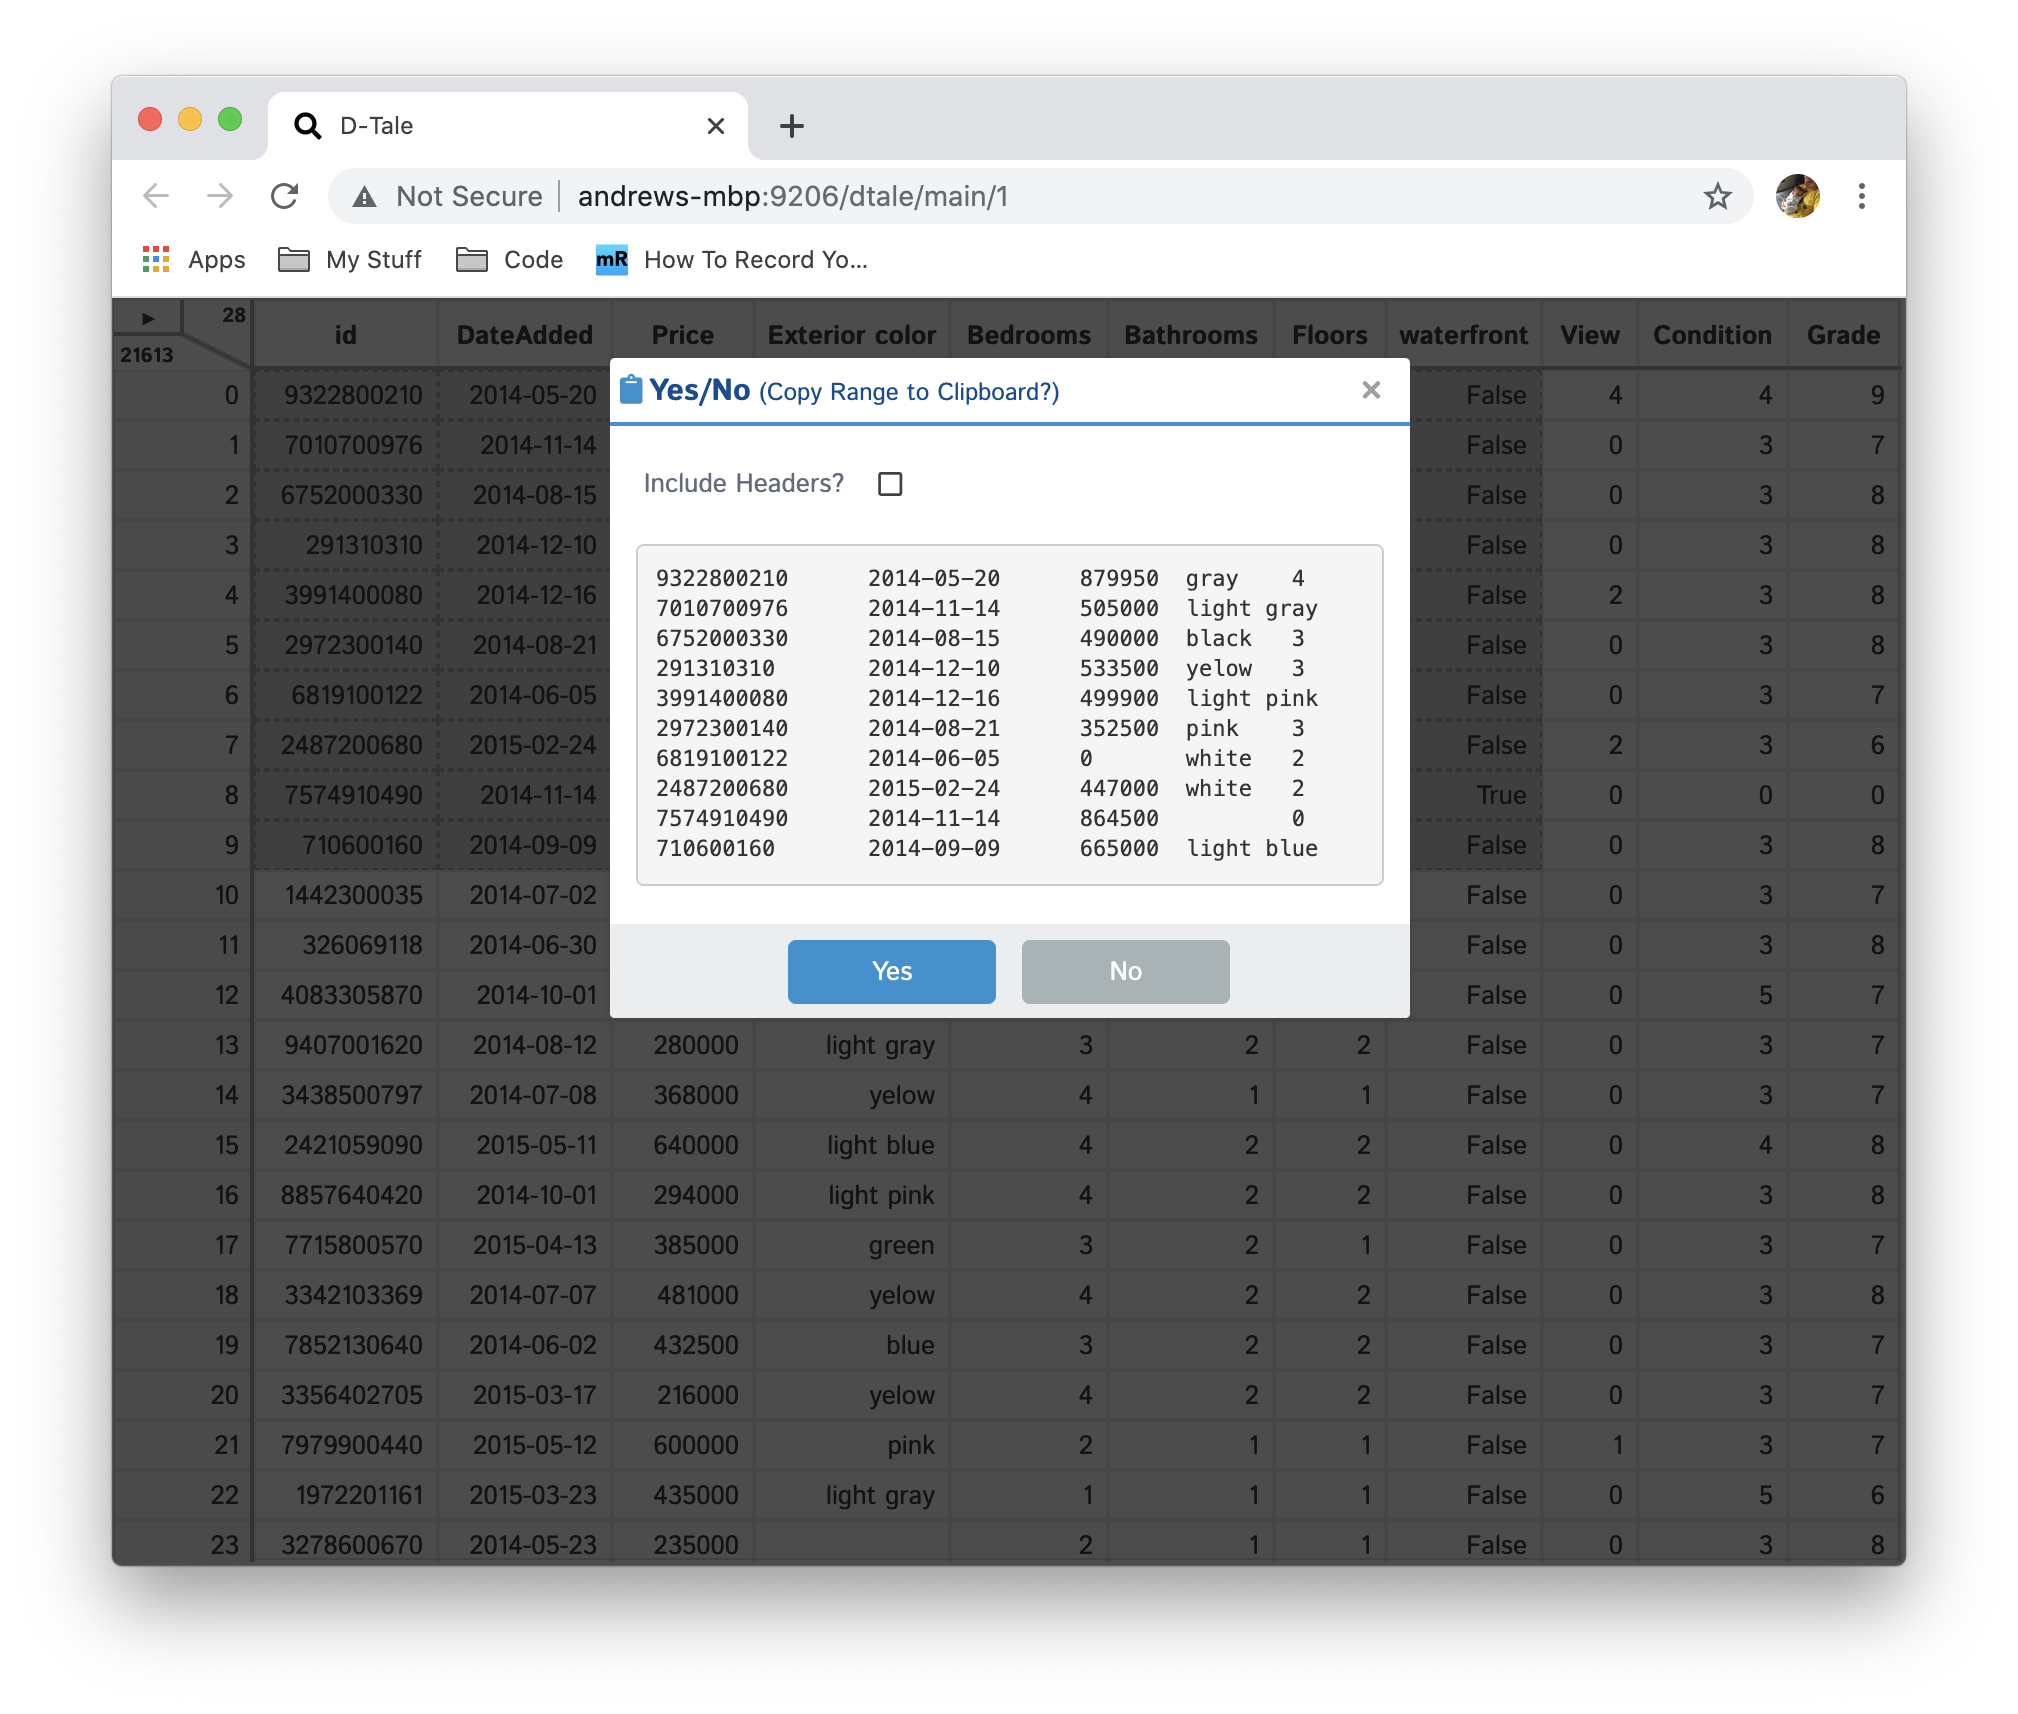 |
 |
One request that I have heard time and time again while working on D-Tale is "it would be great to be able to copy a range of cells into excel". Well here is how that is accomplished:
xarray.Dataset. It is as simple as selecting one or many columns as an index and then your dataframe will be converted to a dataset (df.set_index([...]).to_xarray()) which makes toggling between indexes slices much easier.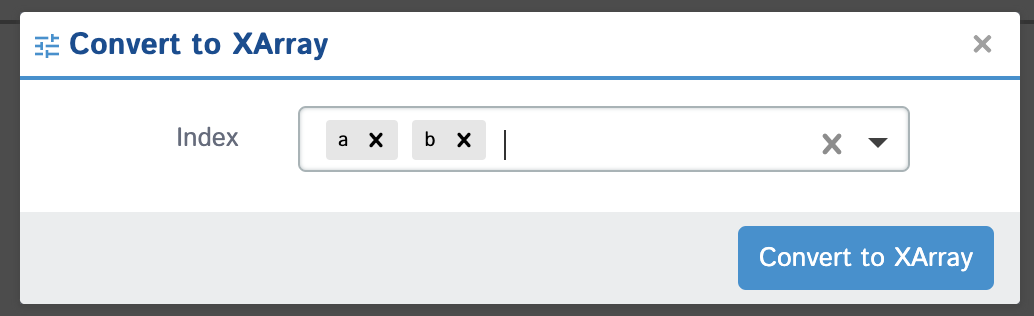
xarray.Dataset you will be given the ability to toggle which dimension coordinates you're viewing by clicking this button. You can select values for all, some or none (all data - no filter) of your coordinates and the data displayed in your grid will match your selections. Under the hood the code being executed is as follows: ds.sel(dim1=coord1,...).to_dataframe()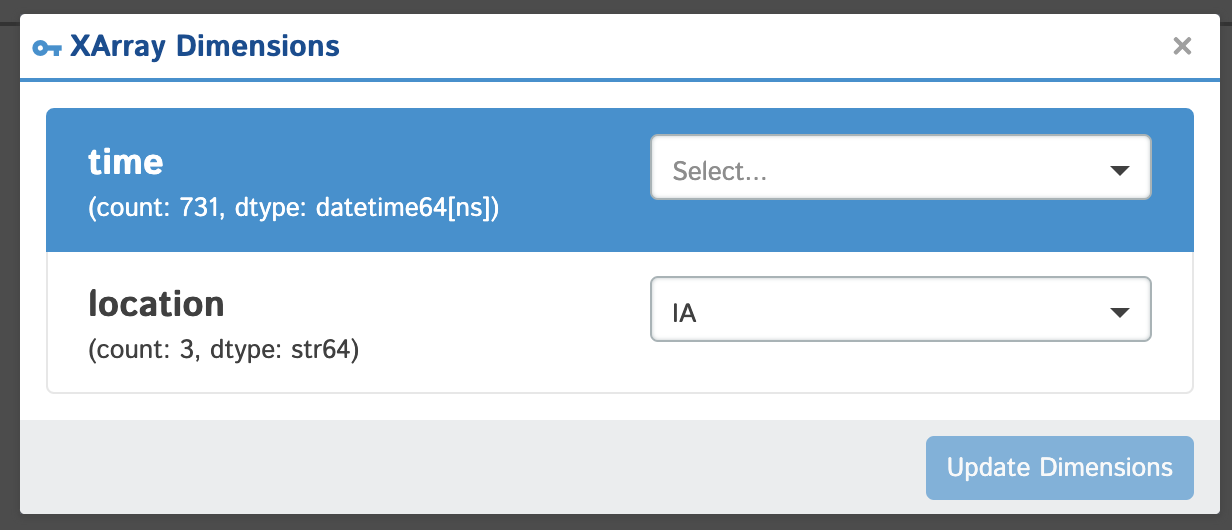
View all the columns & their data types as well as individual details of each column
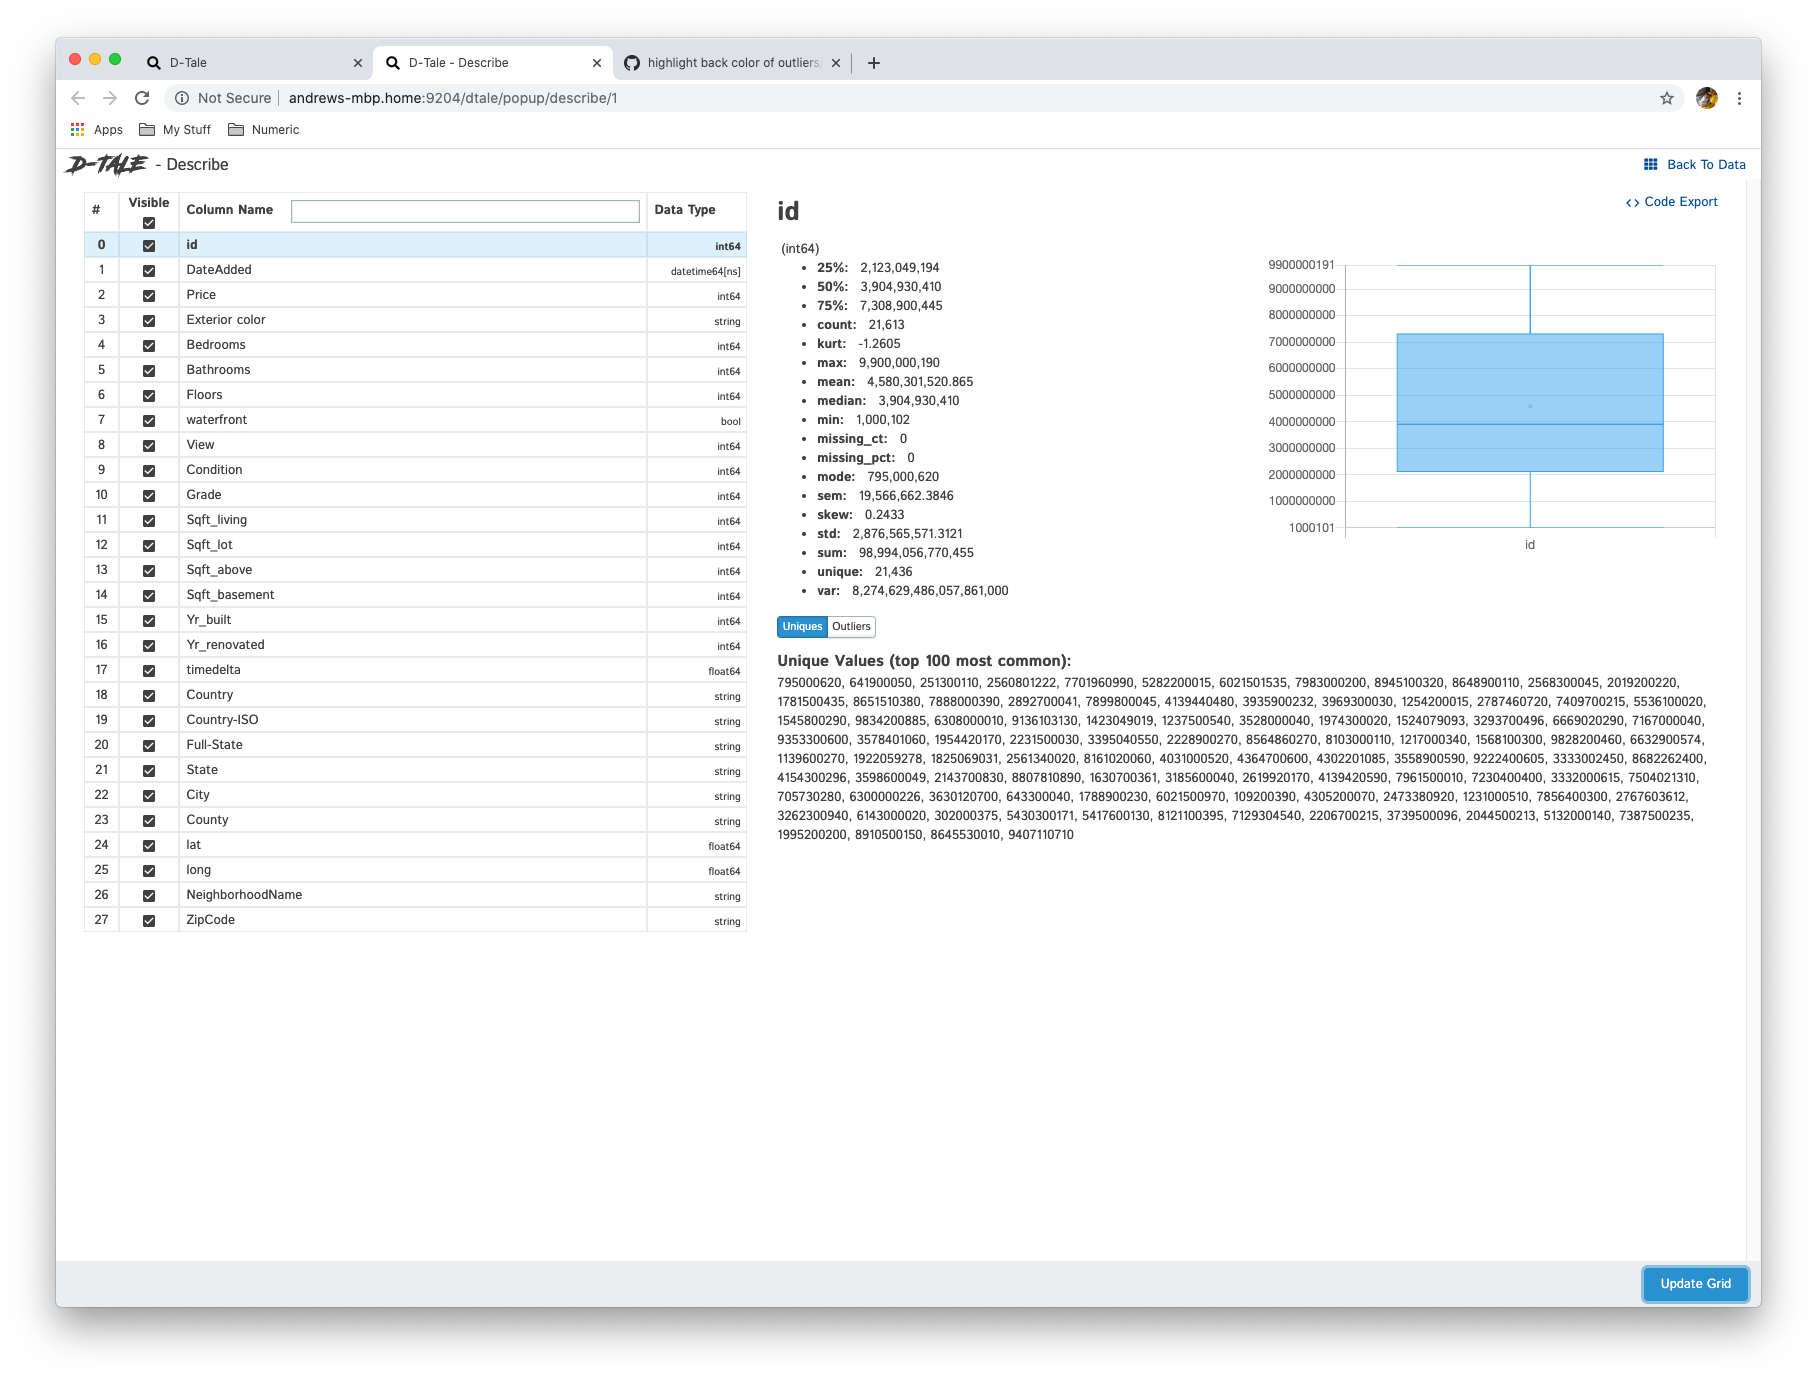
| Data Type | Display | Notes |
|---|---|---|
| date | 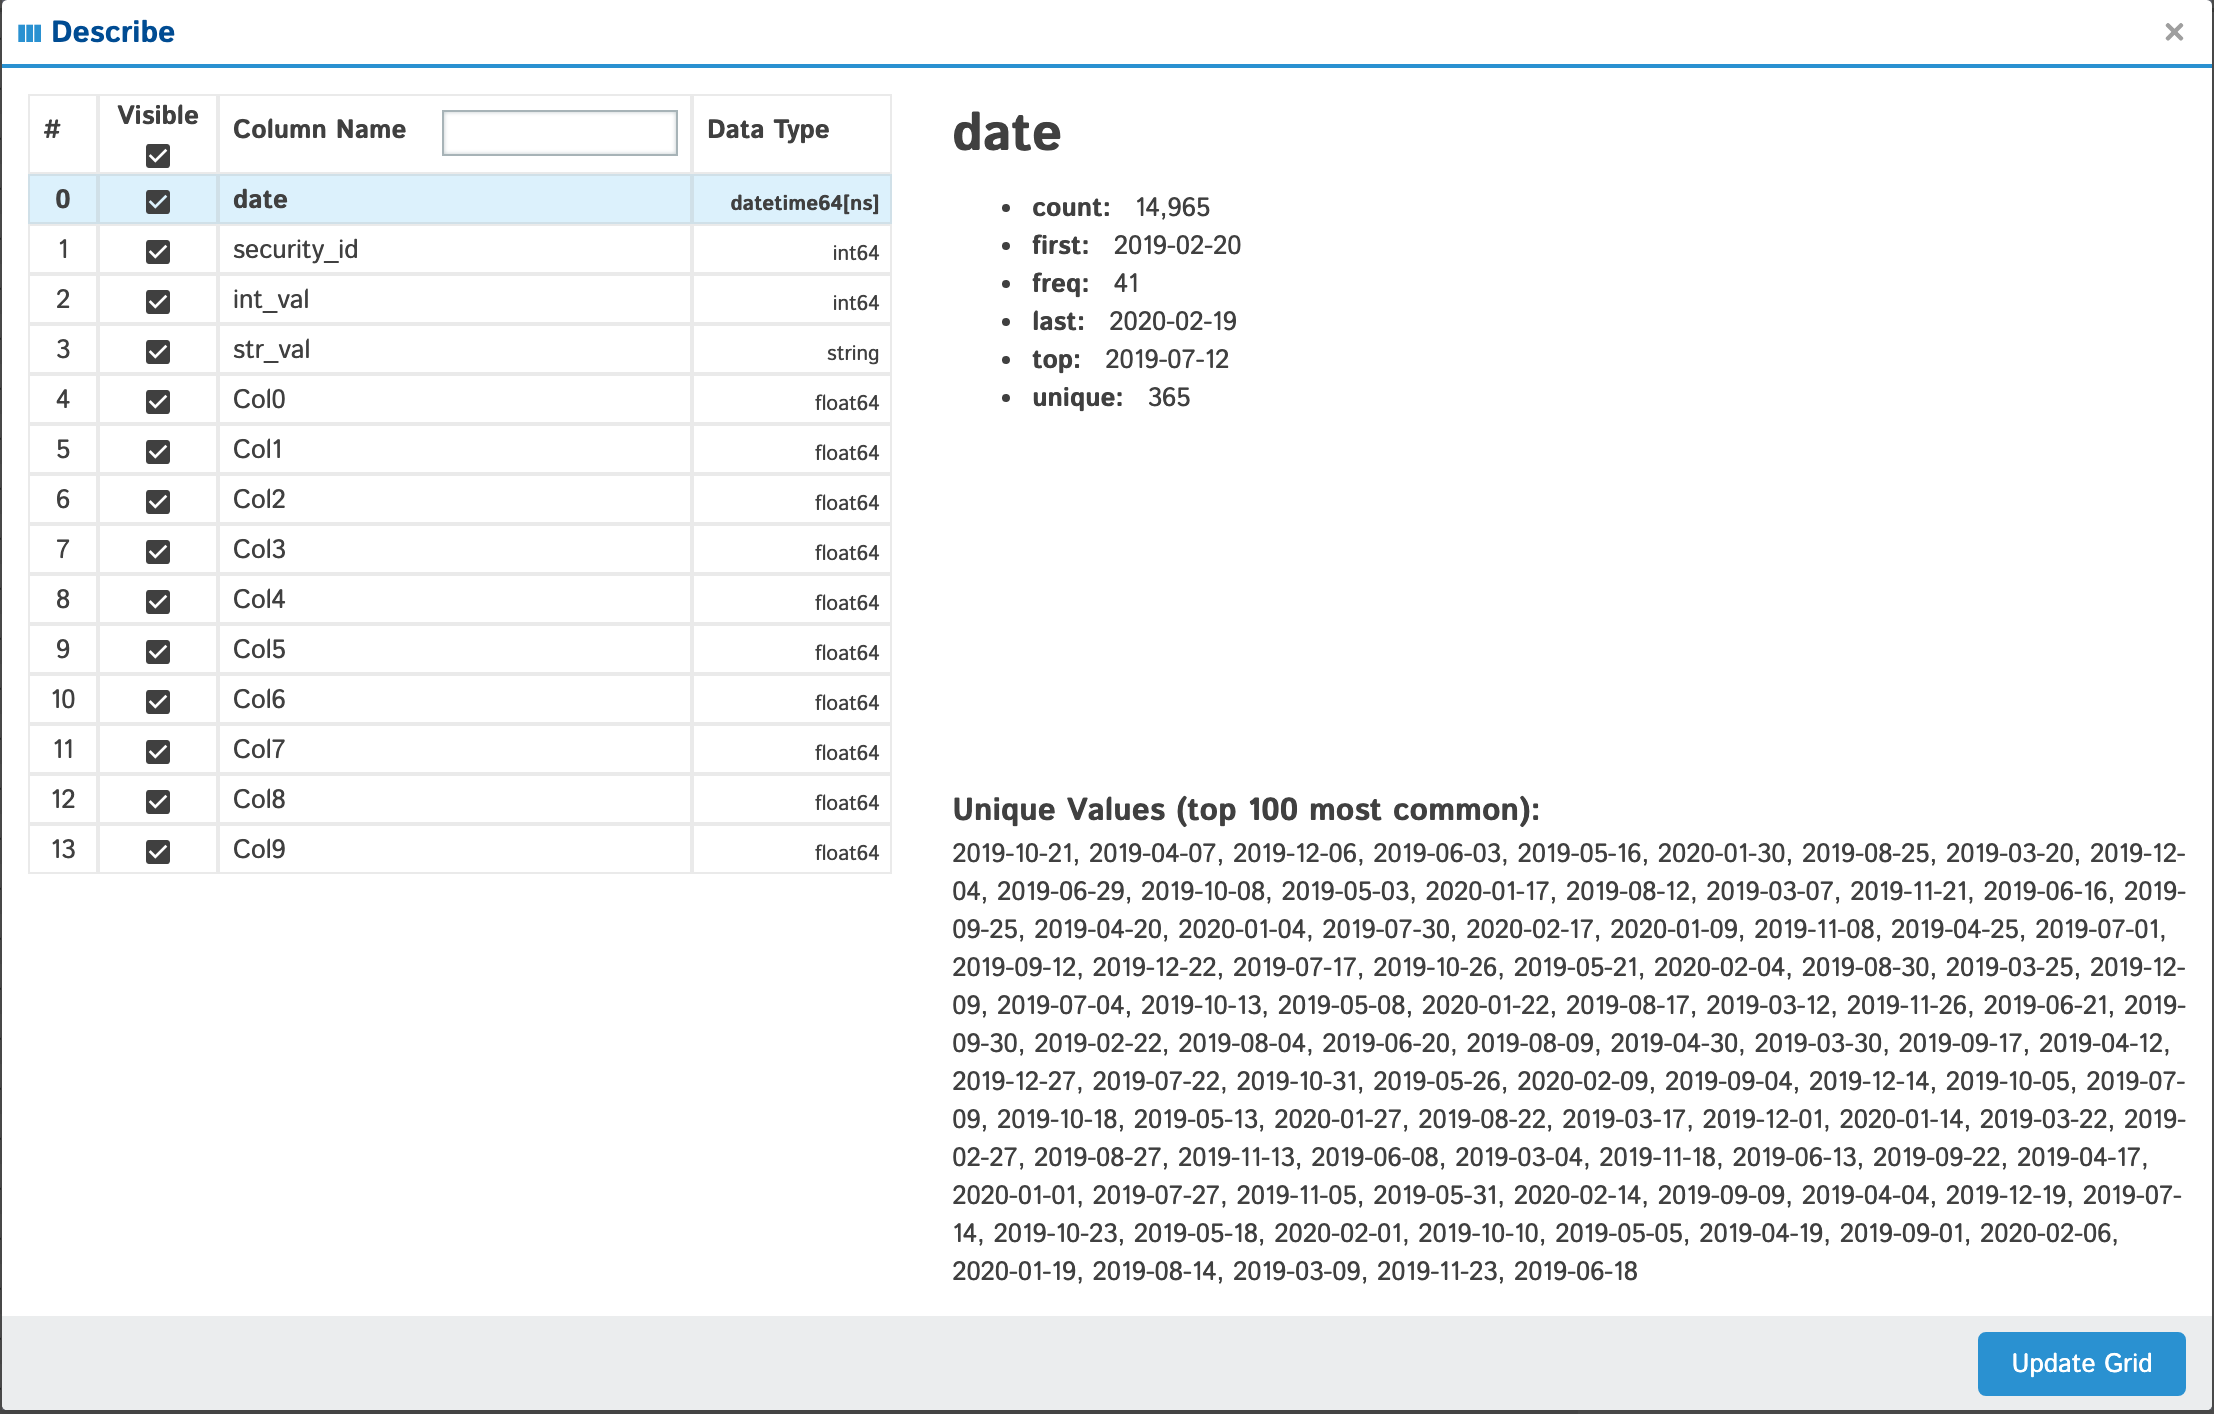 |
|
| string |  |
If you have less than or equal to 100 unique values they will be displayed at the bottom of your popup |
| int | 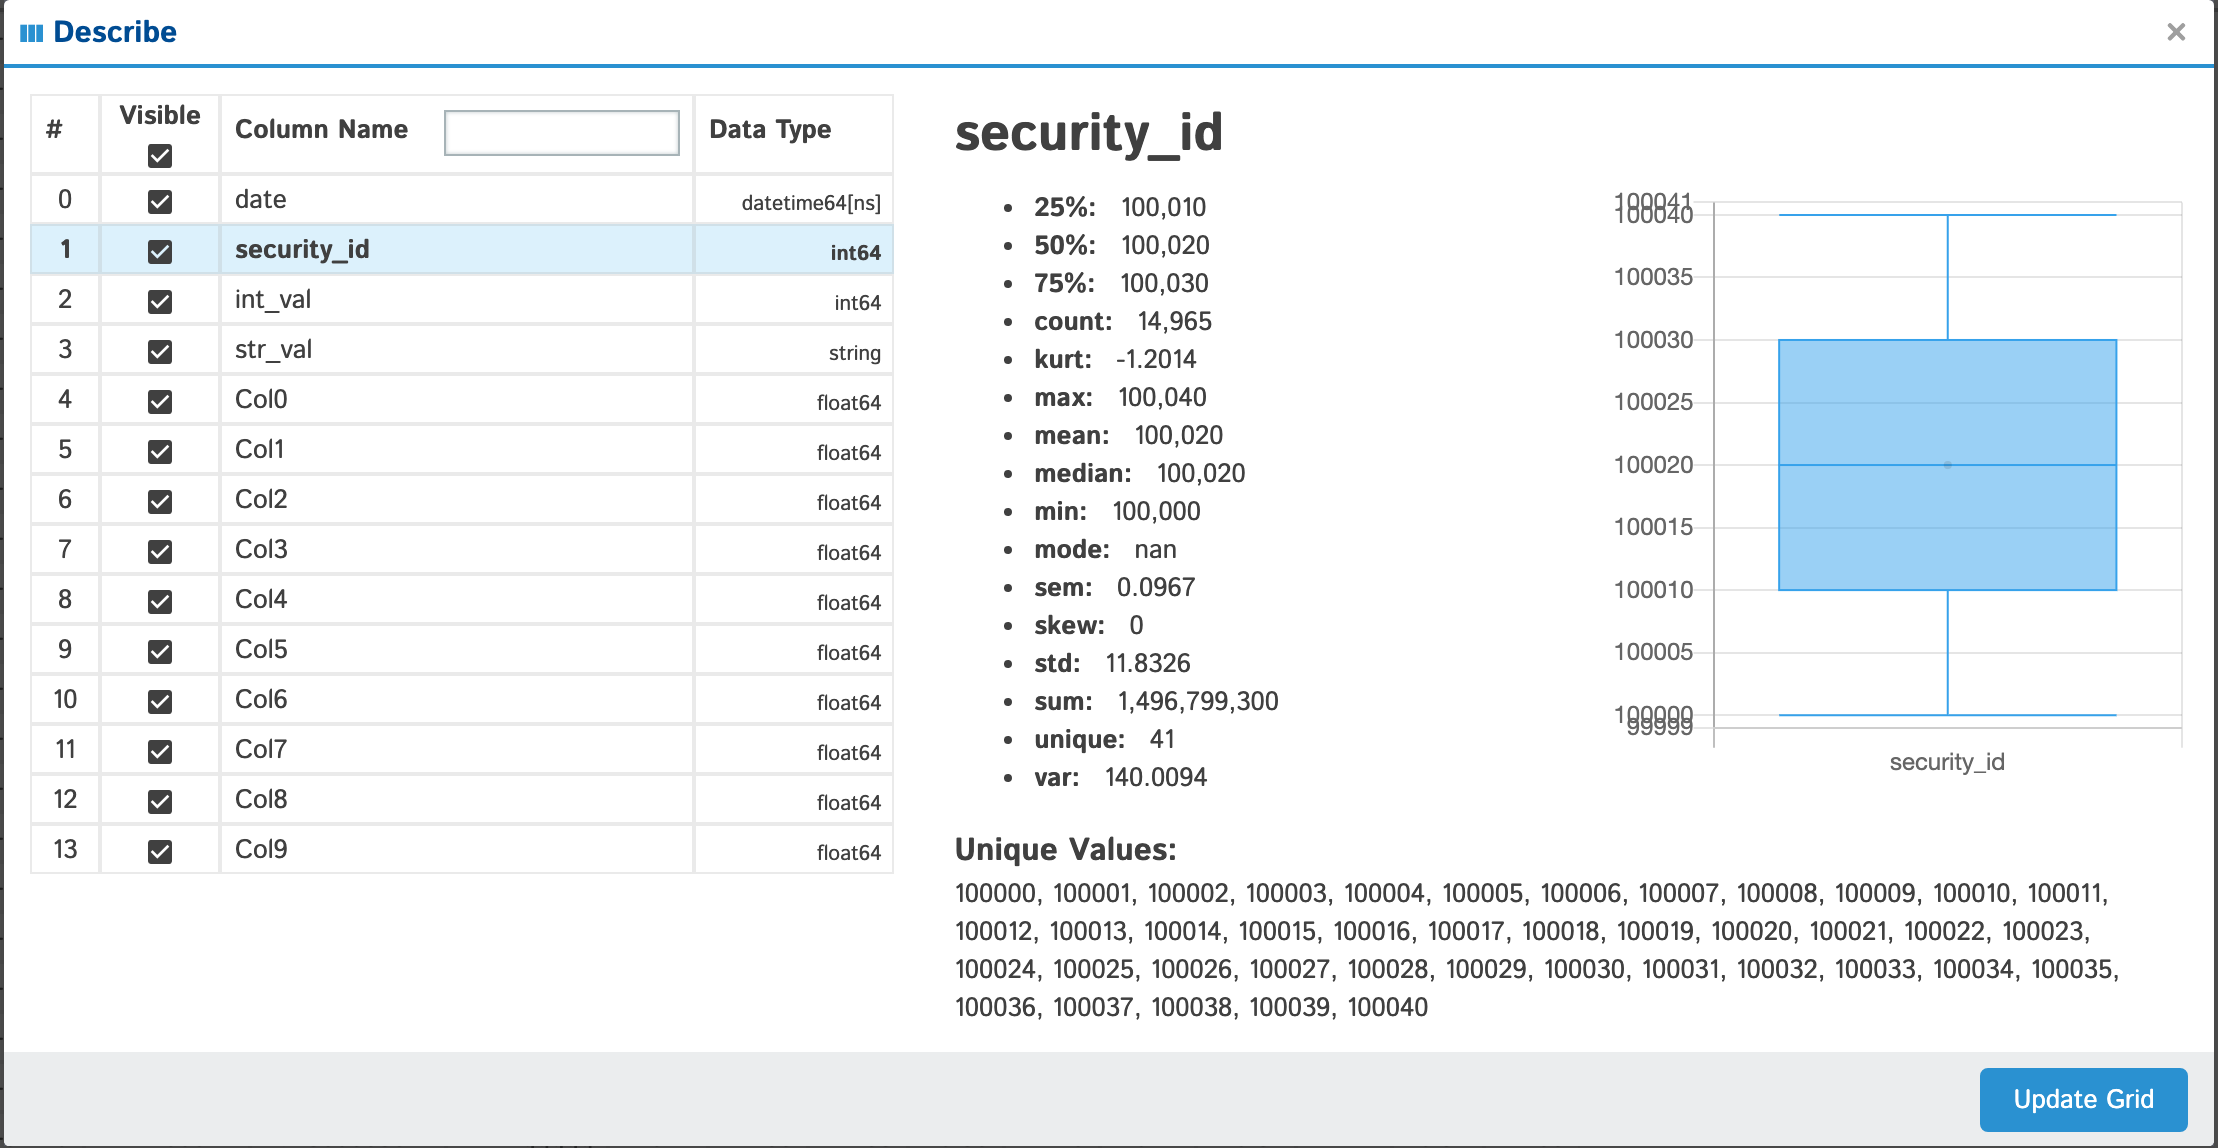 |
Anything with standard numeric classifications (min, max, 25%, 50%, 75%) will have a nice boxplot with the mean (if it exists) displayed as an outlier if you look closely. |
| float | 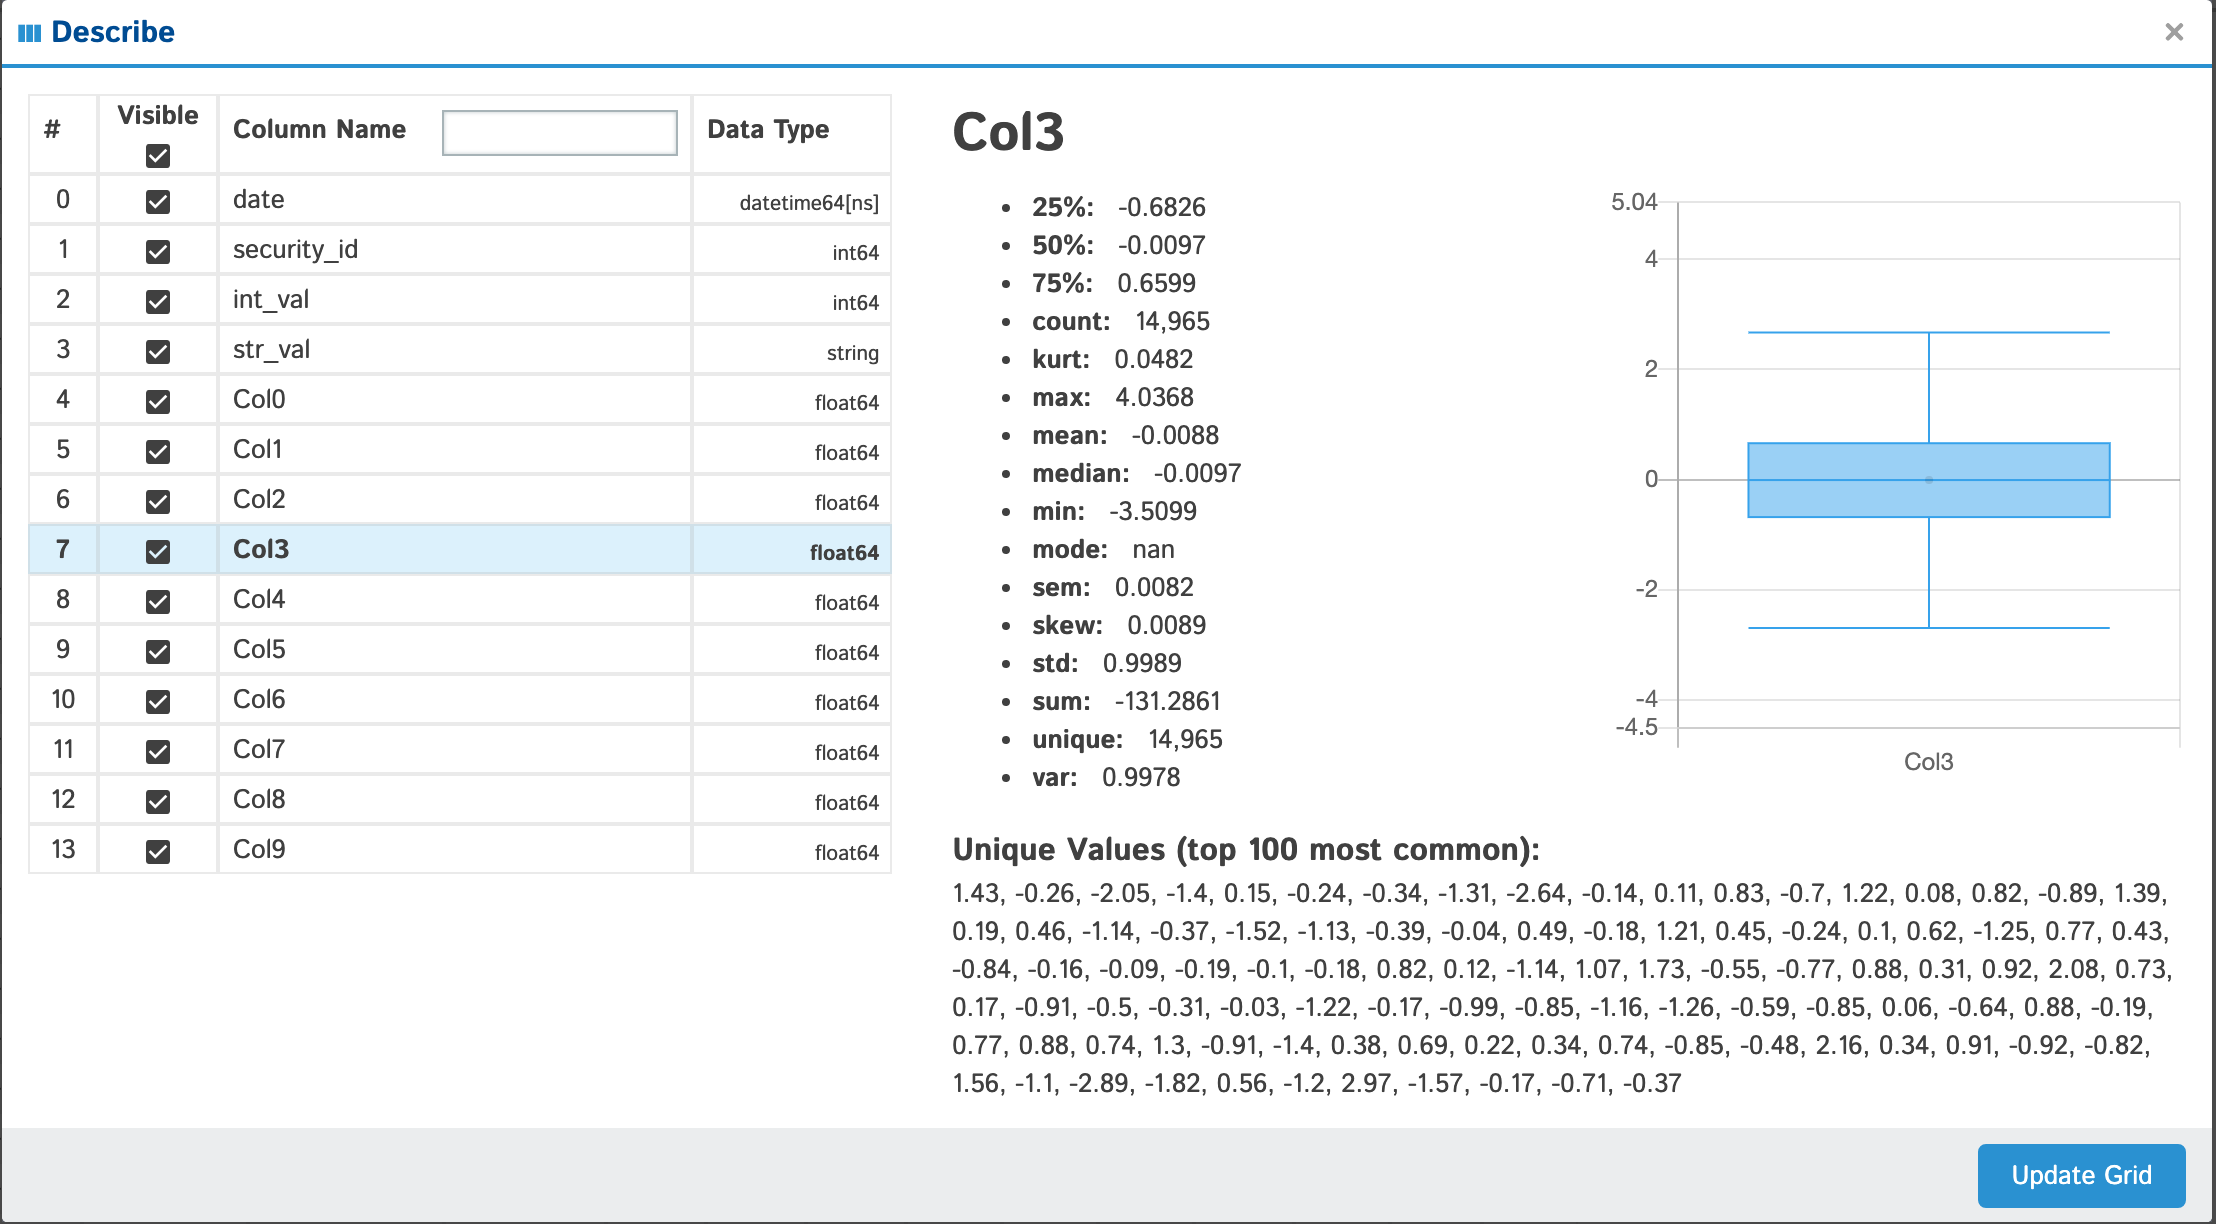 |
When viewing integer & float columns in the "Describe" popup you will see in the lower right-hand corner a toggle for Uniques & Outliers.
| Outliers | Filter |
|---|---|
 |
 |
If you click the "Outliers" toggle this will load the top 100 outliers in your column based on the following code snippet:
s = df[column]
q1 = s.quantile(0.25)
q3 = s.quantile(0.75)
iqr = q3 - q1
iqr_lower = q1 - 1.5 * iqr
iqr_upper = q3 + 1.5 * iqr
outliers = s[(s < iqr_lower) | (s > iqr_upper)]
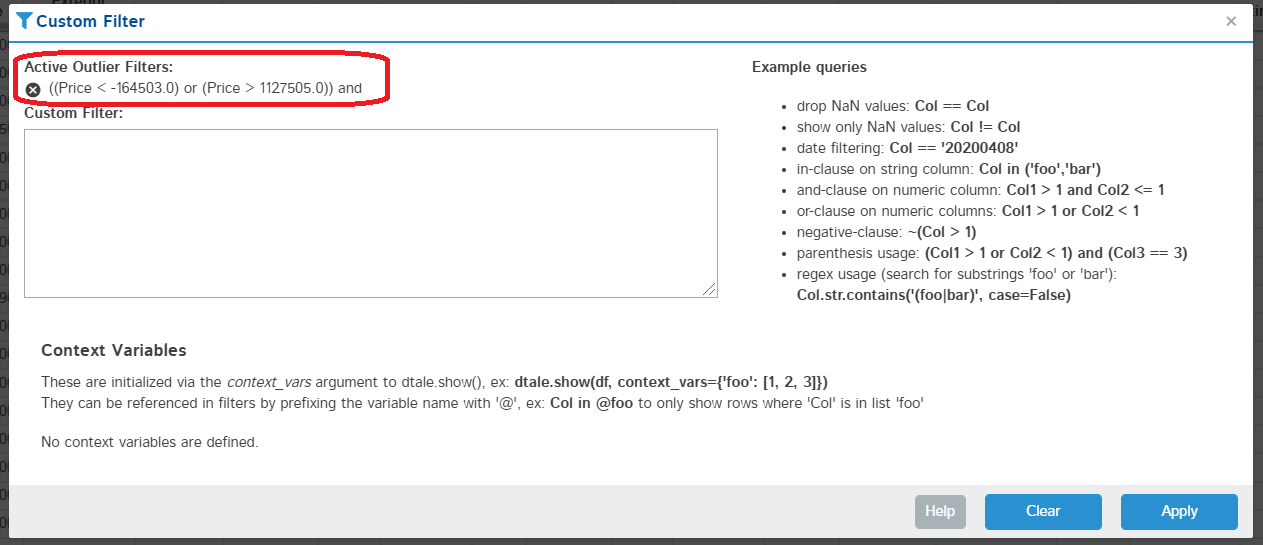
If you click on the "Apply outlier filter" link this will add an addtional "outlier" filter for this column which can be removed from the header or the custom filter shown in picture above to the right.
Starting with version 3.7.0 this feature will be turned off by default. Custom filters are vulnerable to code injection attacks, please only use in trusted environments.
You can turn this feature on by doing one of the following:
enable_custom_filters=True to your dtale.show callenable_custom_filters = True to the [app] section of your dtale.ini config file (more info)import dtale.global_state as global_state global_state.set_app_settings(dict(enable_custom_filters=True))
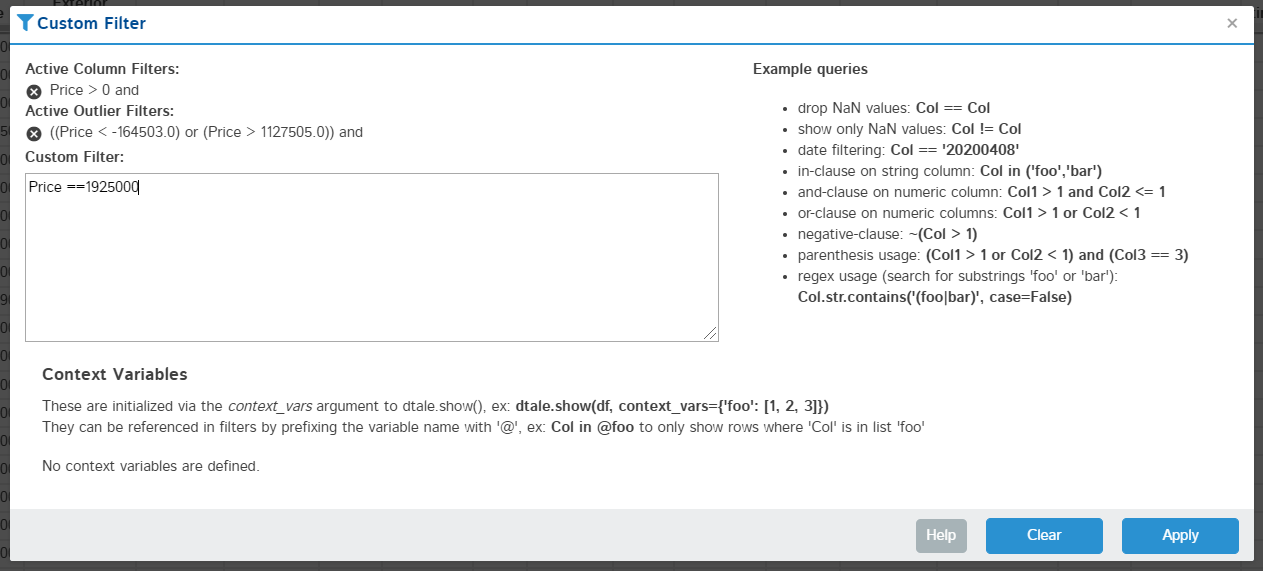
Apply a custom pandas query to your data (link to pandas documentation included in popup)
| Editing | Result |
|---|---|
 |
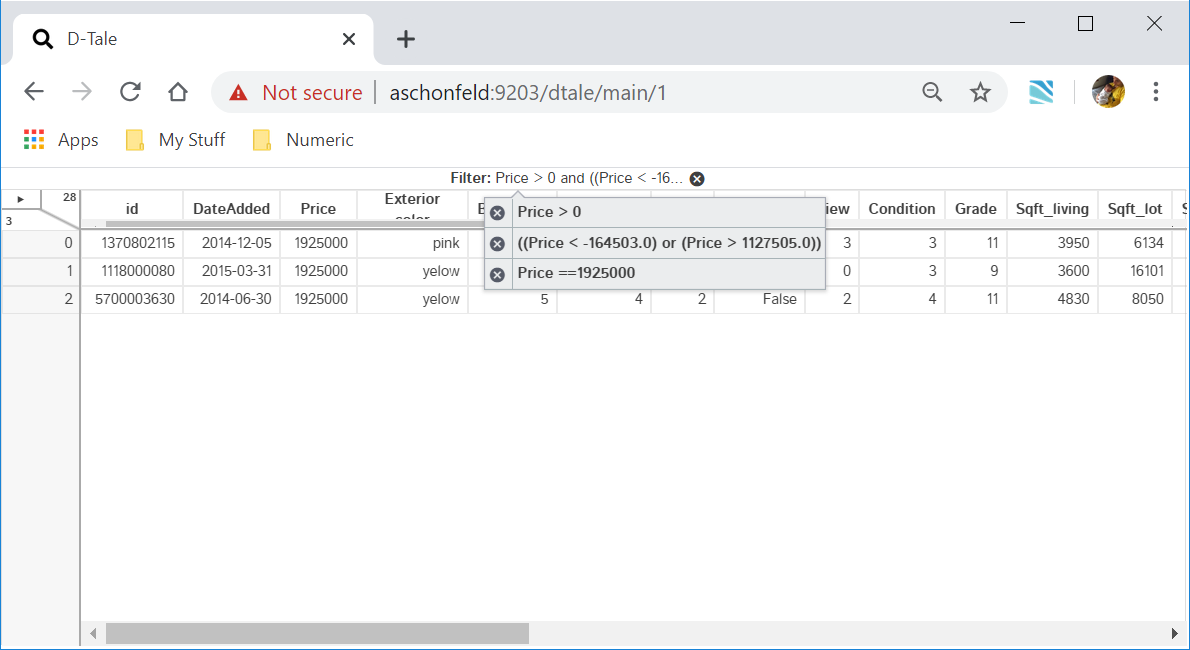 |
You can also see any outlier or column filters you've applied (which will be included in addition to your custom query) and remove them if you'd like.
Context Variables are user-defined values passed in via the context_variables argument to dtale.show(); they can be referenced in filters by prefixing the variable name with '@'.
For example, here is how you can use context variables in a pandas query:
import pandas as pd

df = pd.DataFrame([
  dict(name='Joe', age=7),
  dict(name='Bob', age=23),
  dict(name='Ann', age=45),
  dict(name='Cat', age=88),
])
two_oldest_ages = df['age'].nlargest(2)
df.query('age in @two_oldest_ages')
And here is how you would pass that context variable to D-Tale: dtale.show(df, context_variables=dict(two_oldest_ages=two_oldest_ages))
Here's some nice documentation on the performance of pandas queries
This video shows you how to build the following:
This feature allows users to merge or stack (vertically concatenate) dataframes they have loaded into D-Tale. They can also upload additional data to D-Tale while wihin this feature. The demo shown above goes over the following actions:
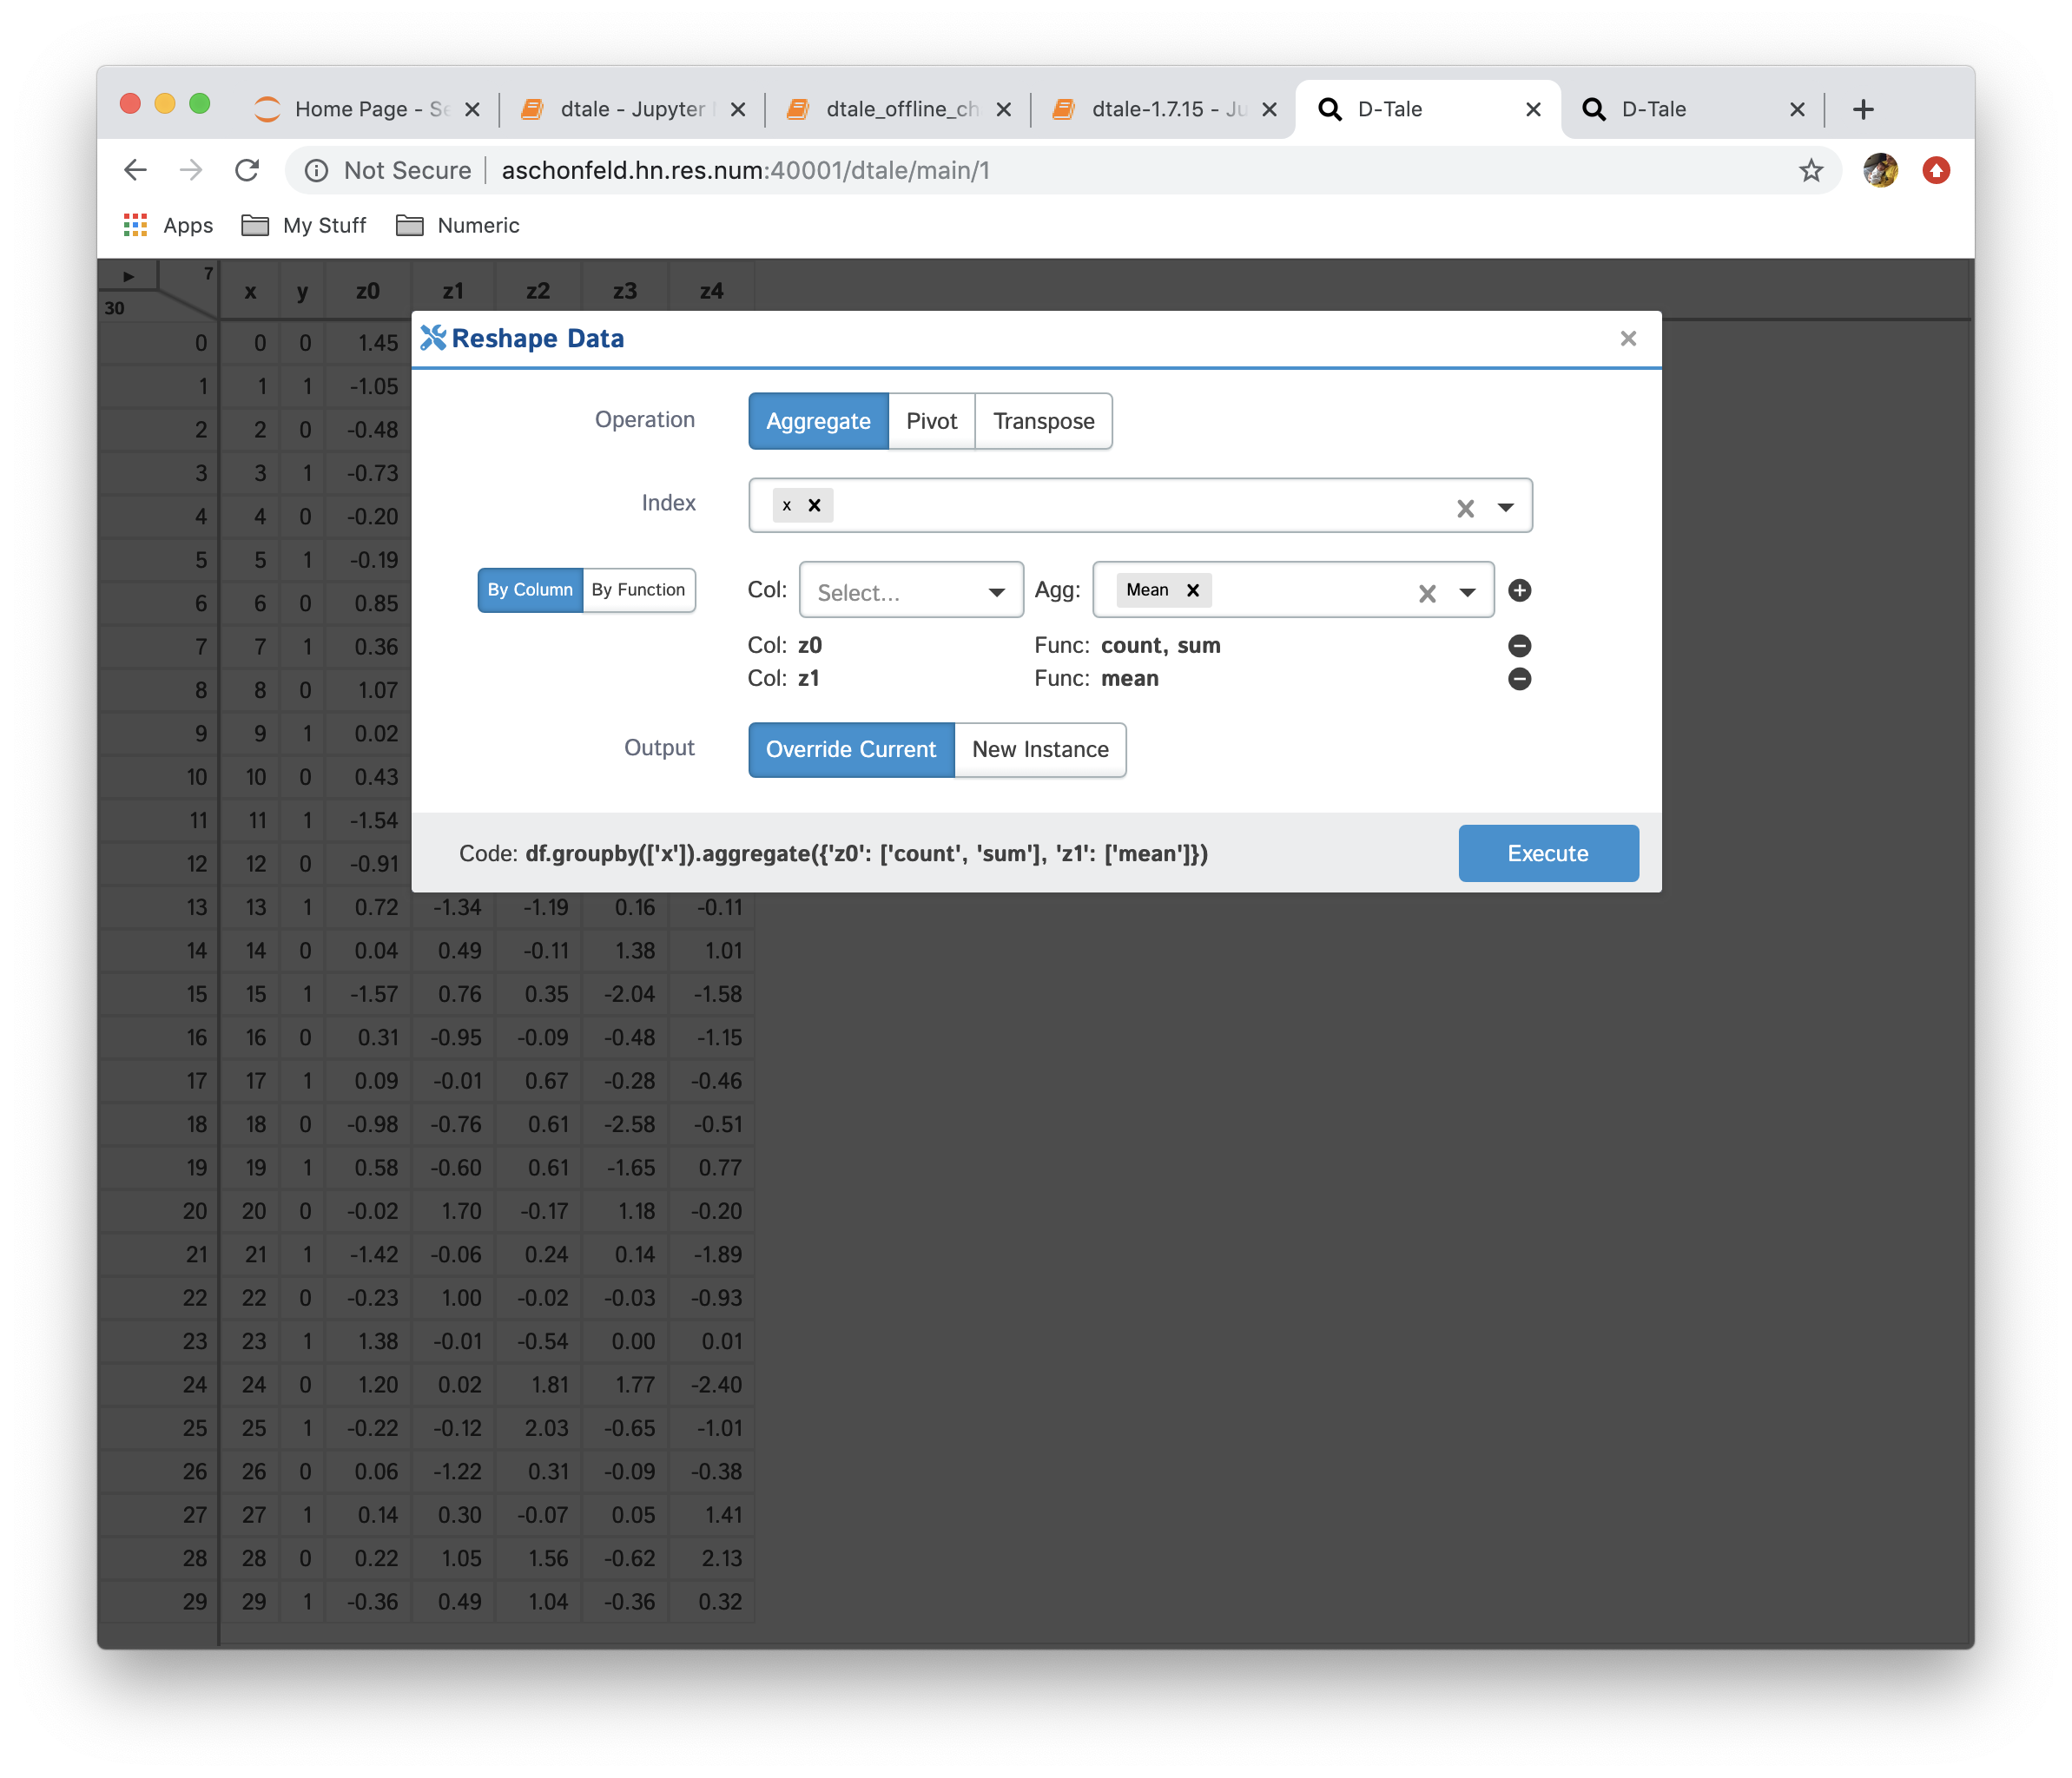
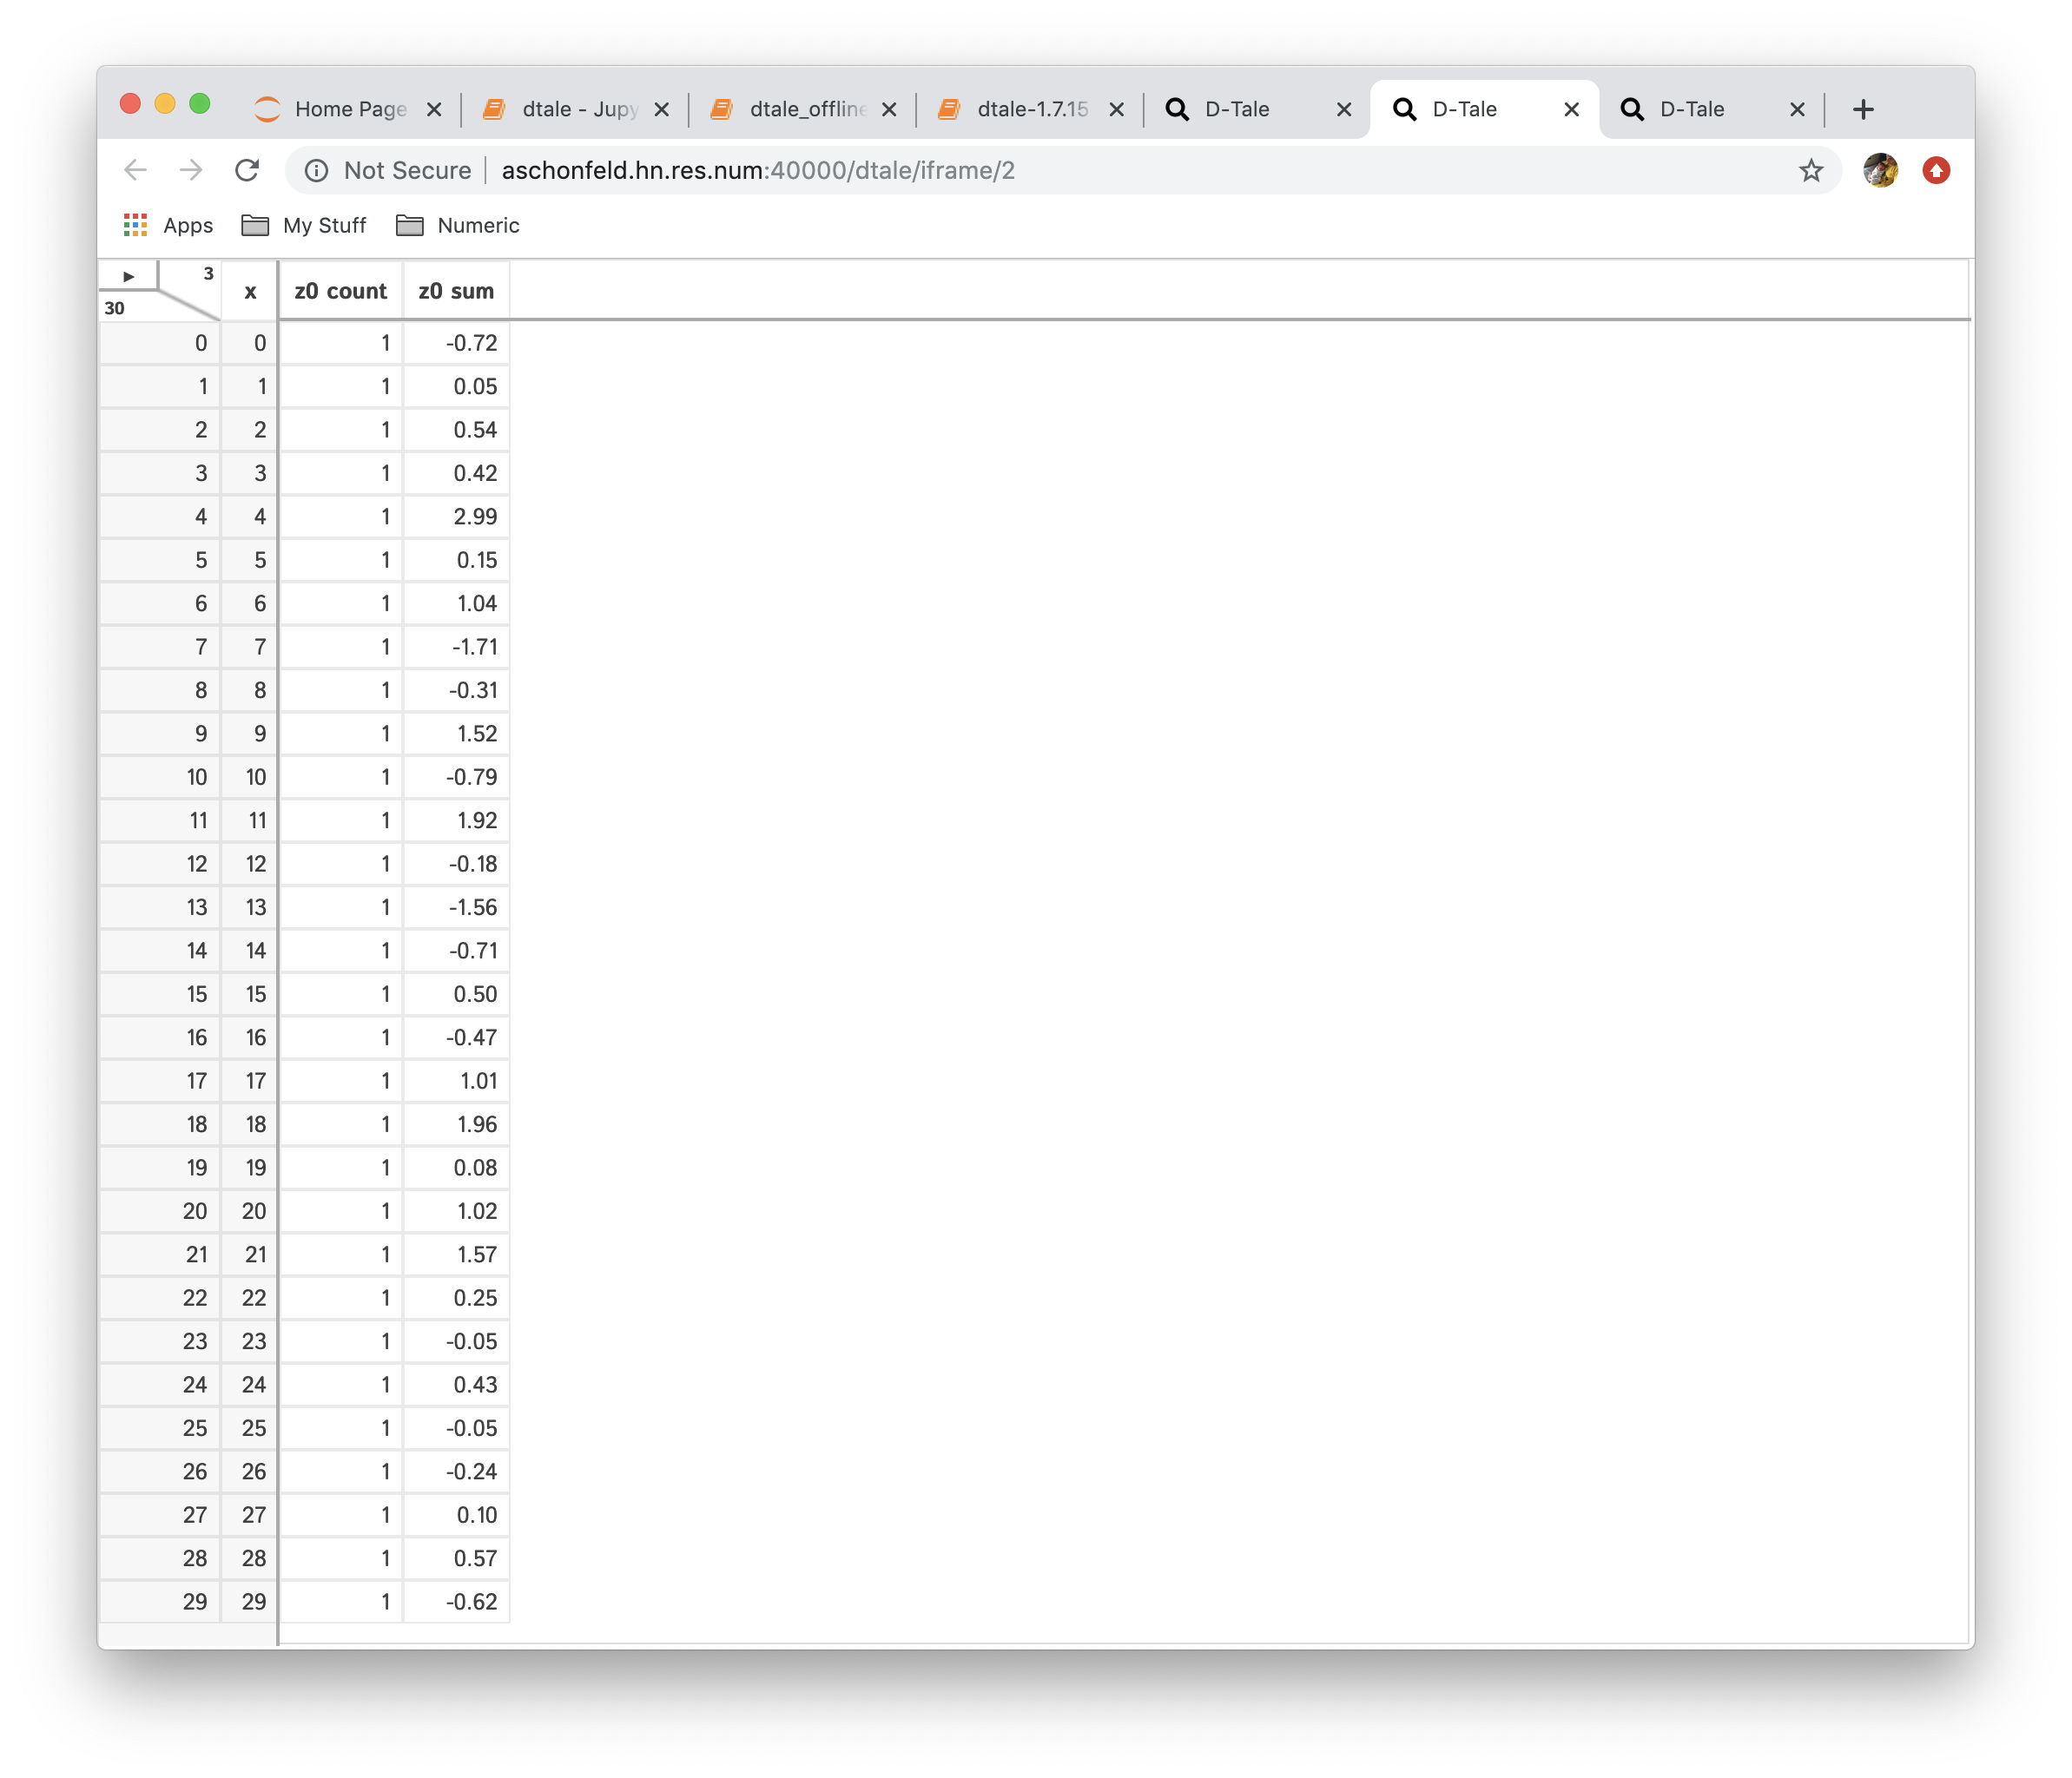
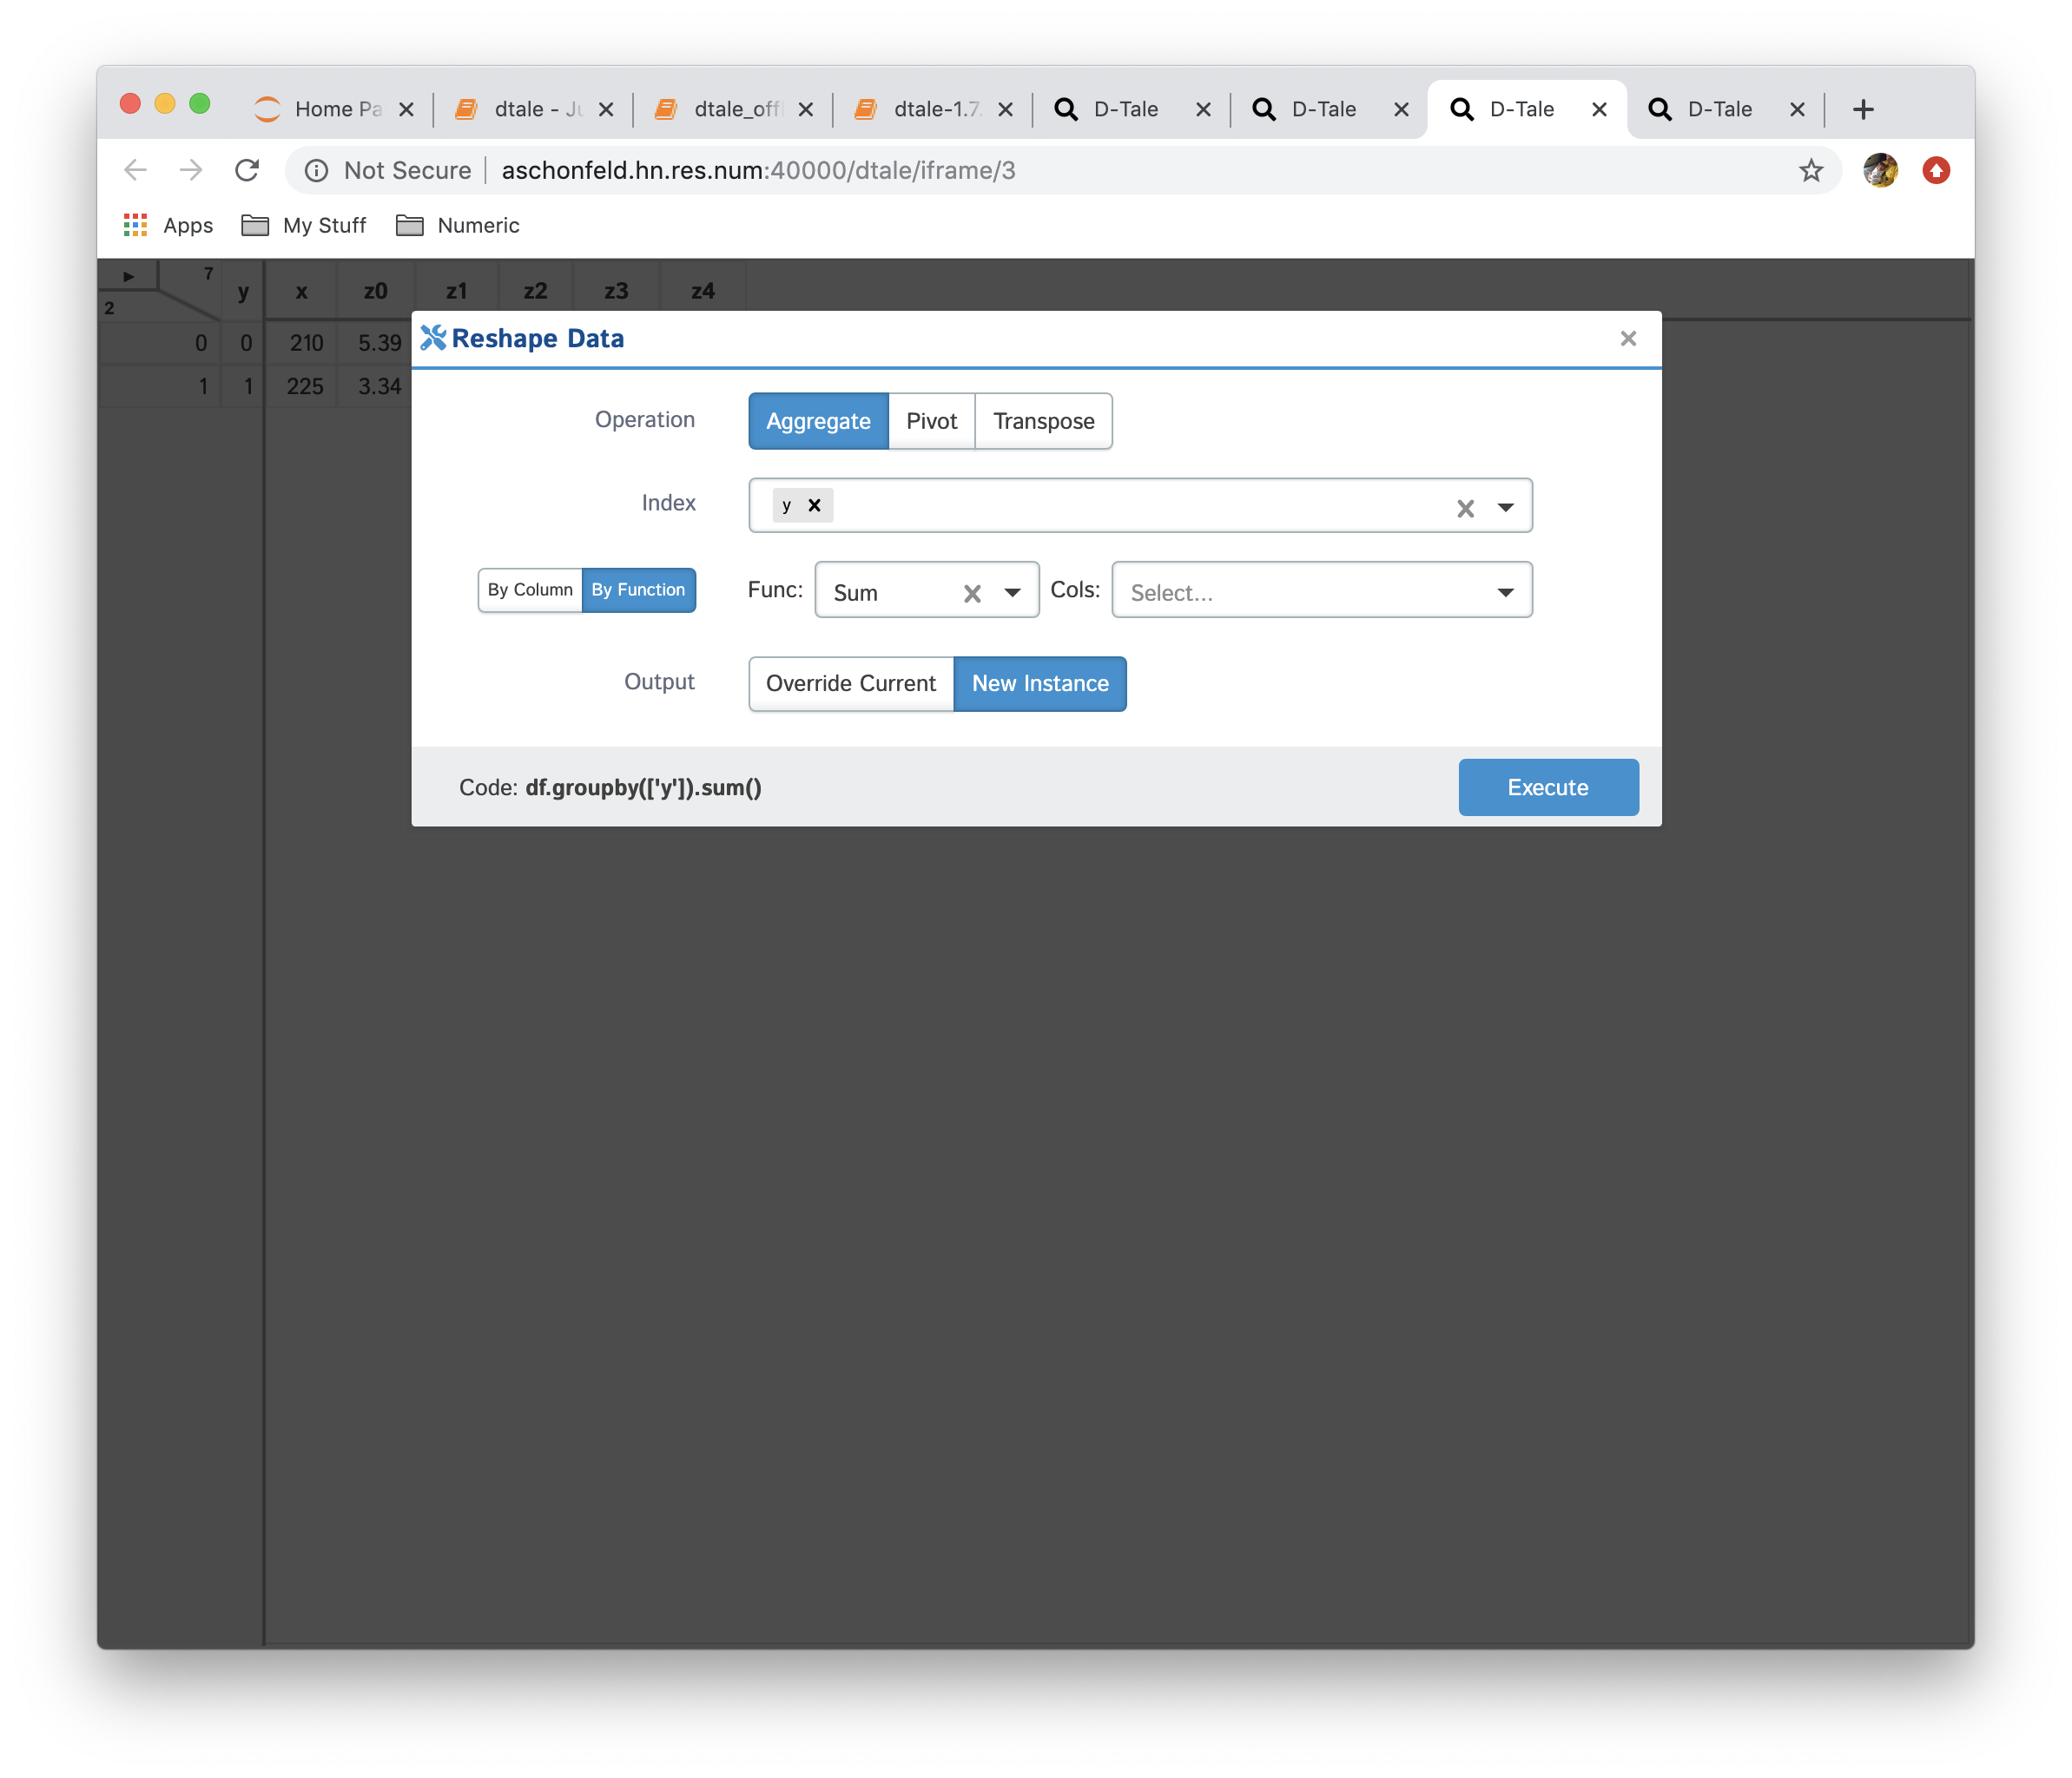
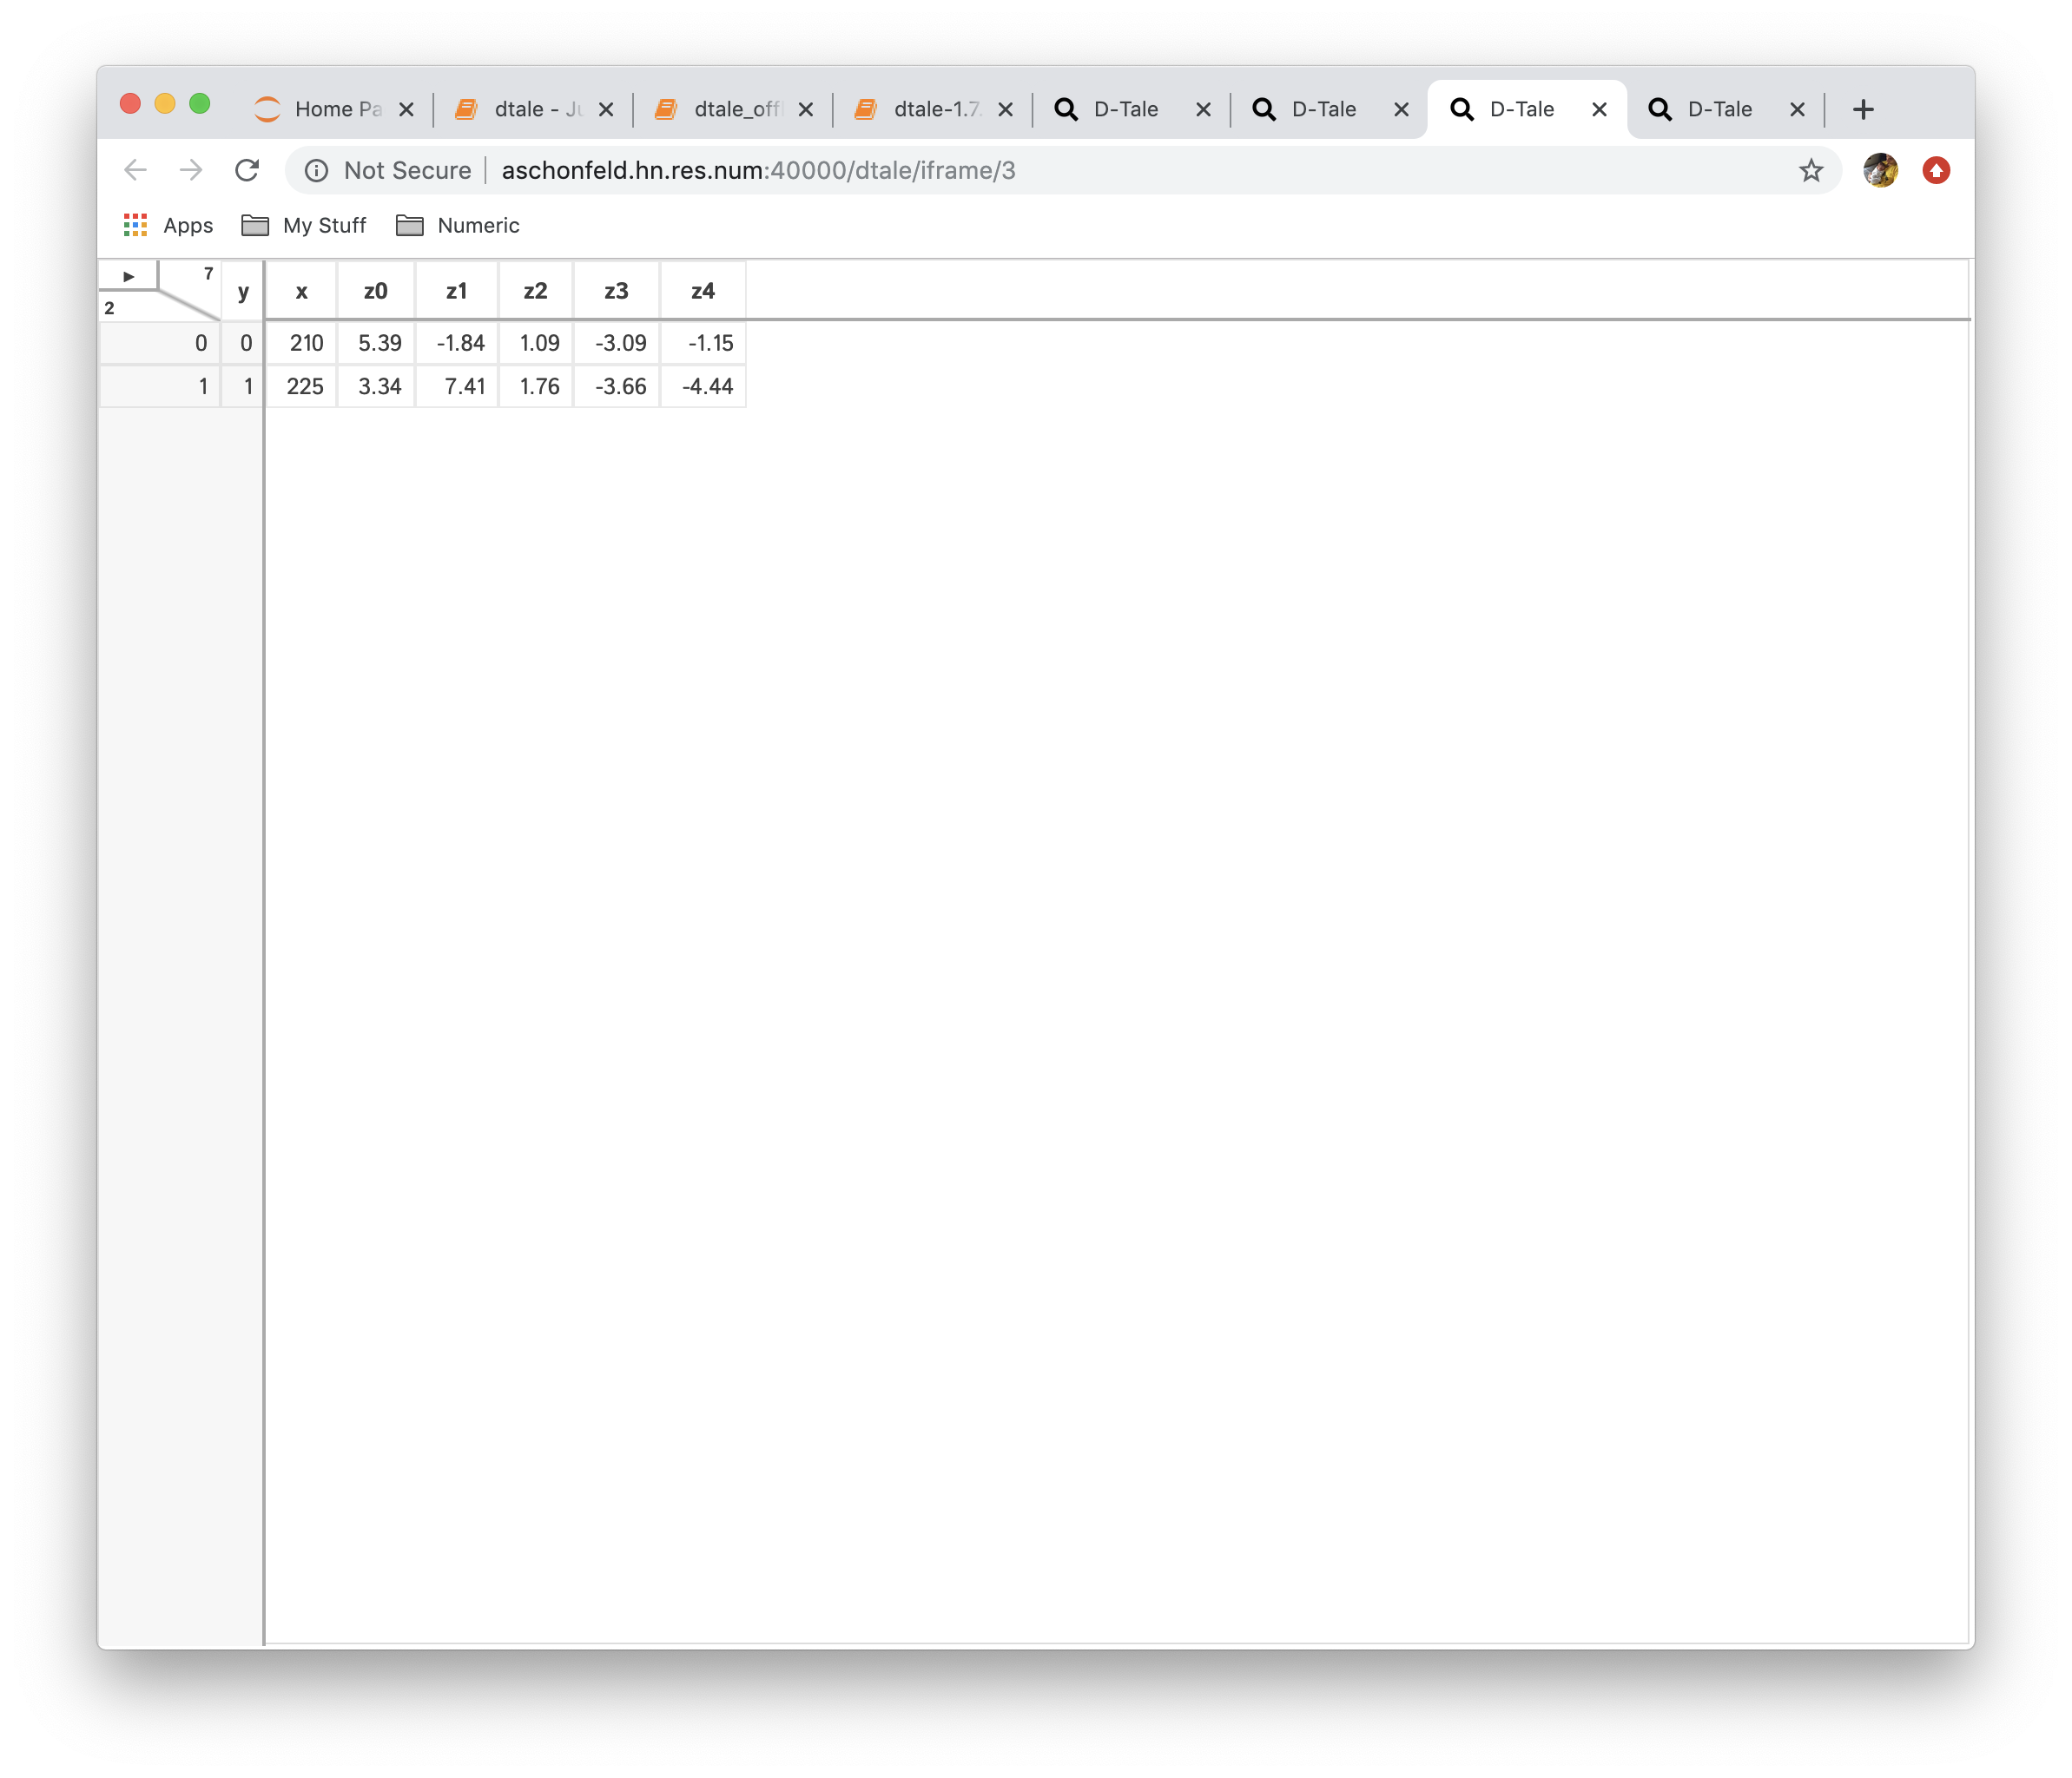
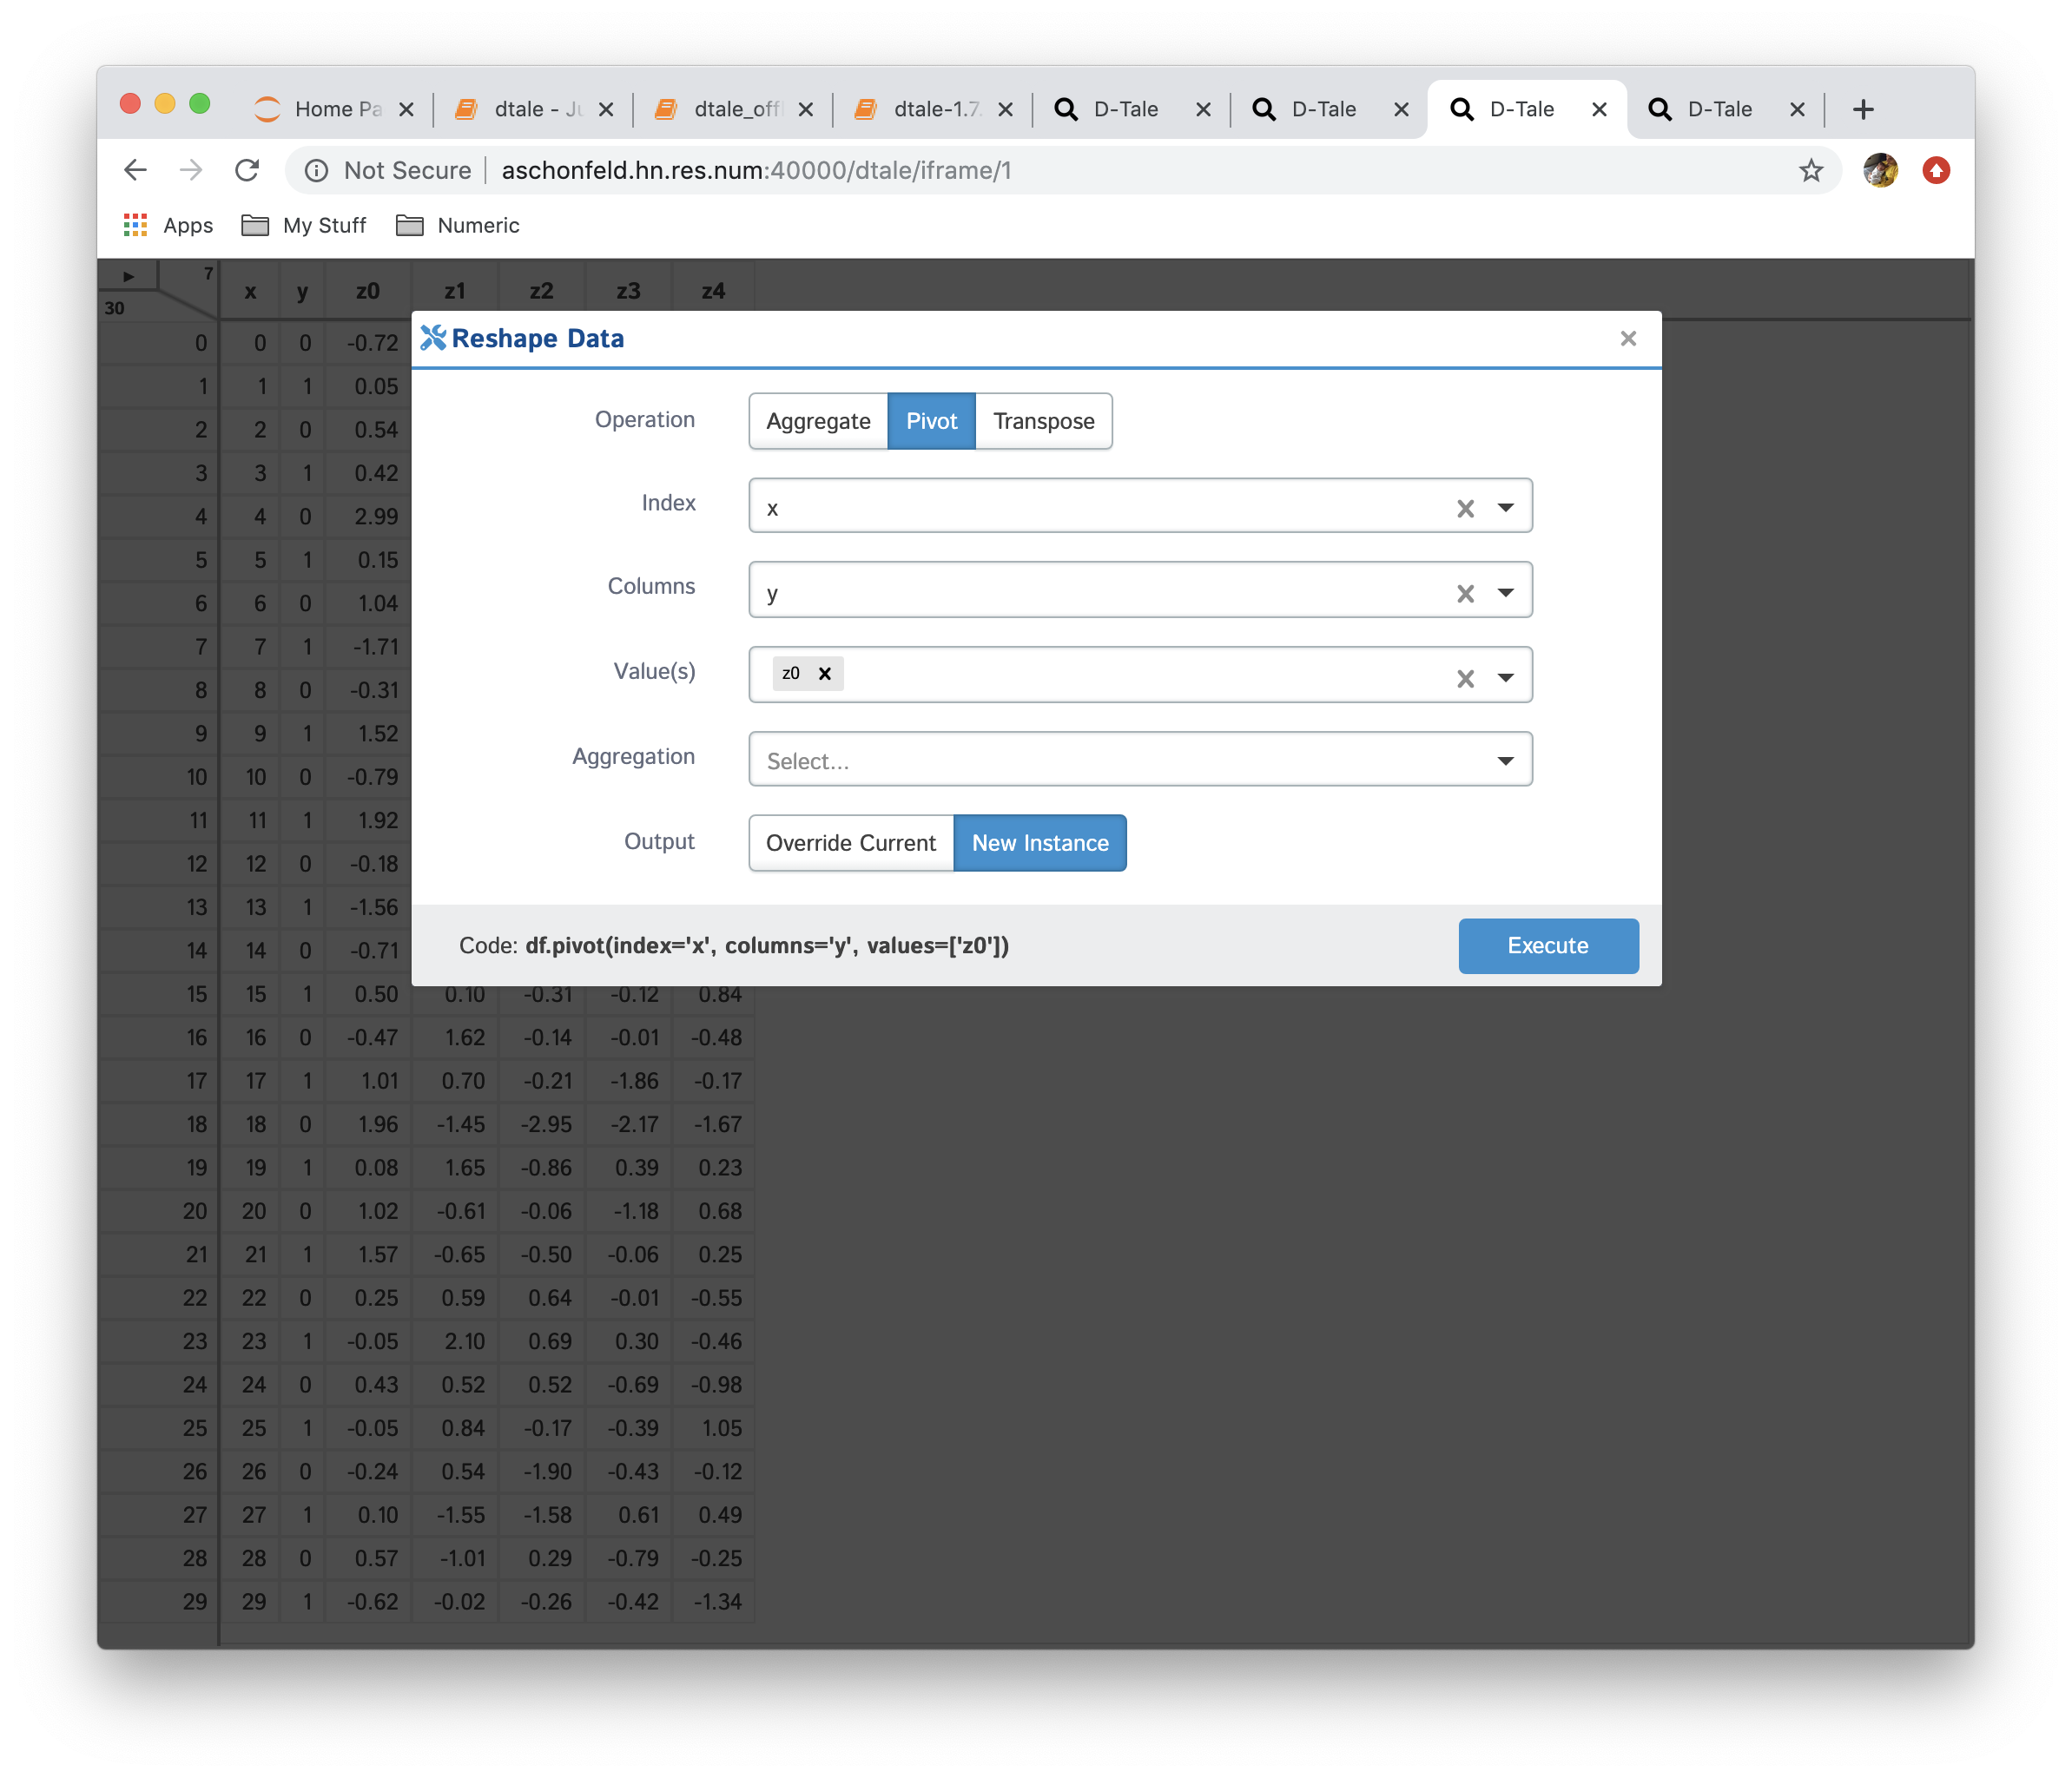
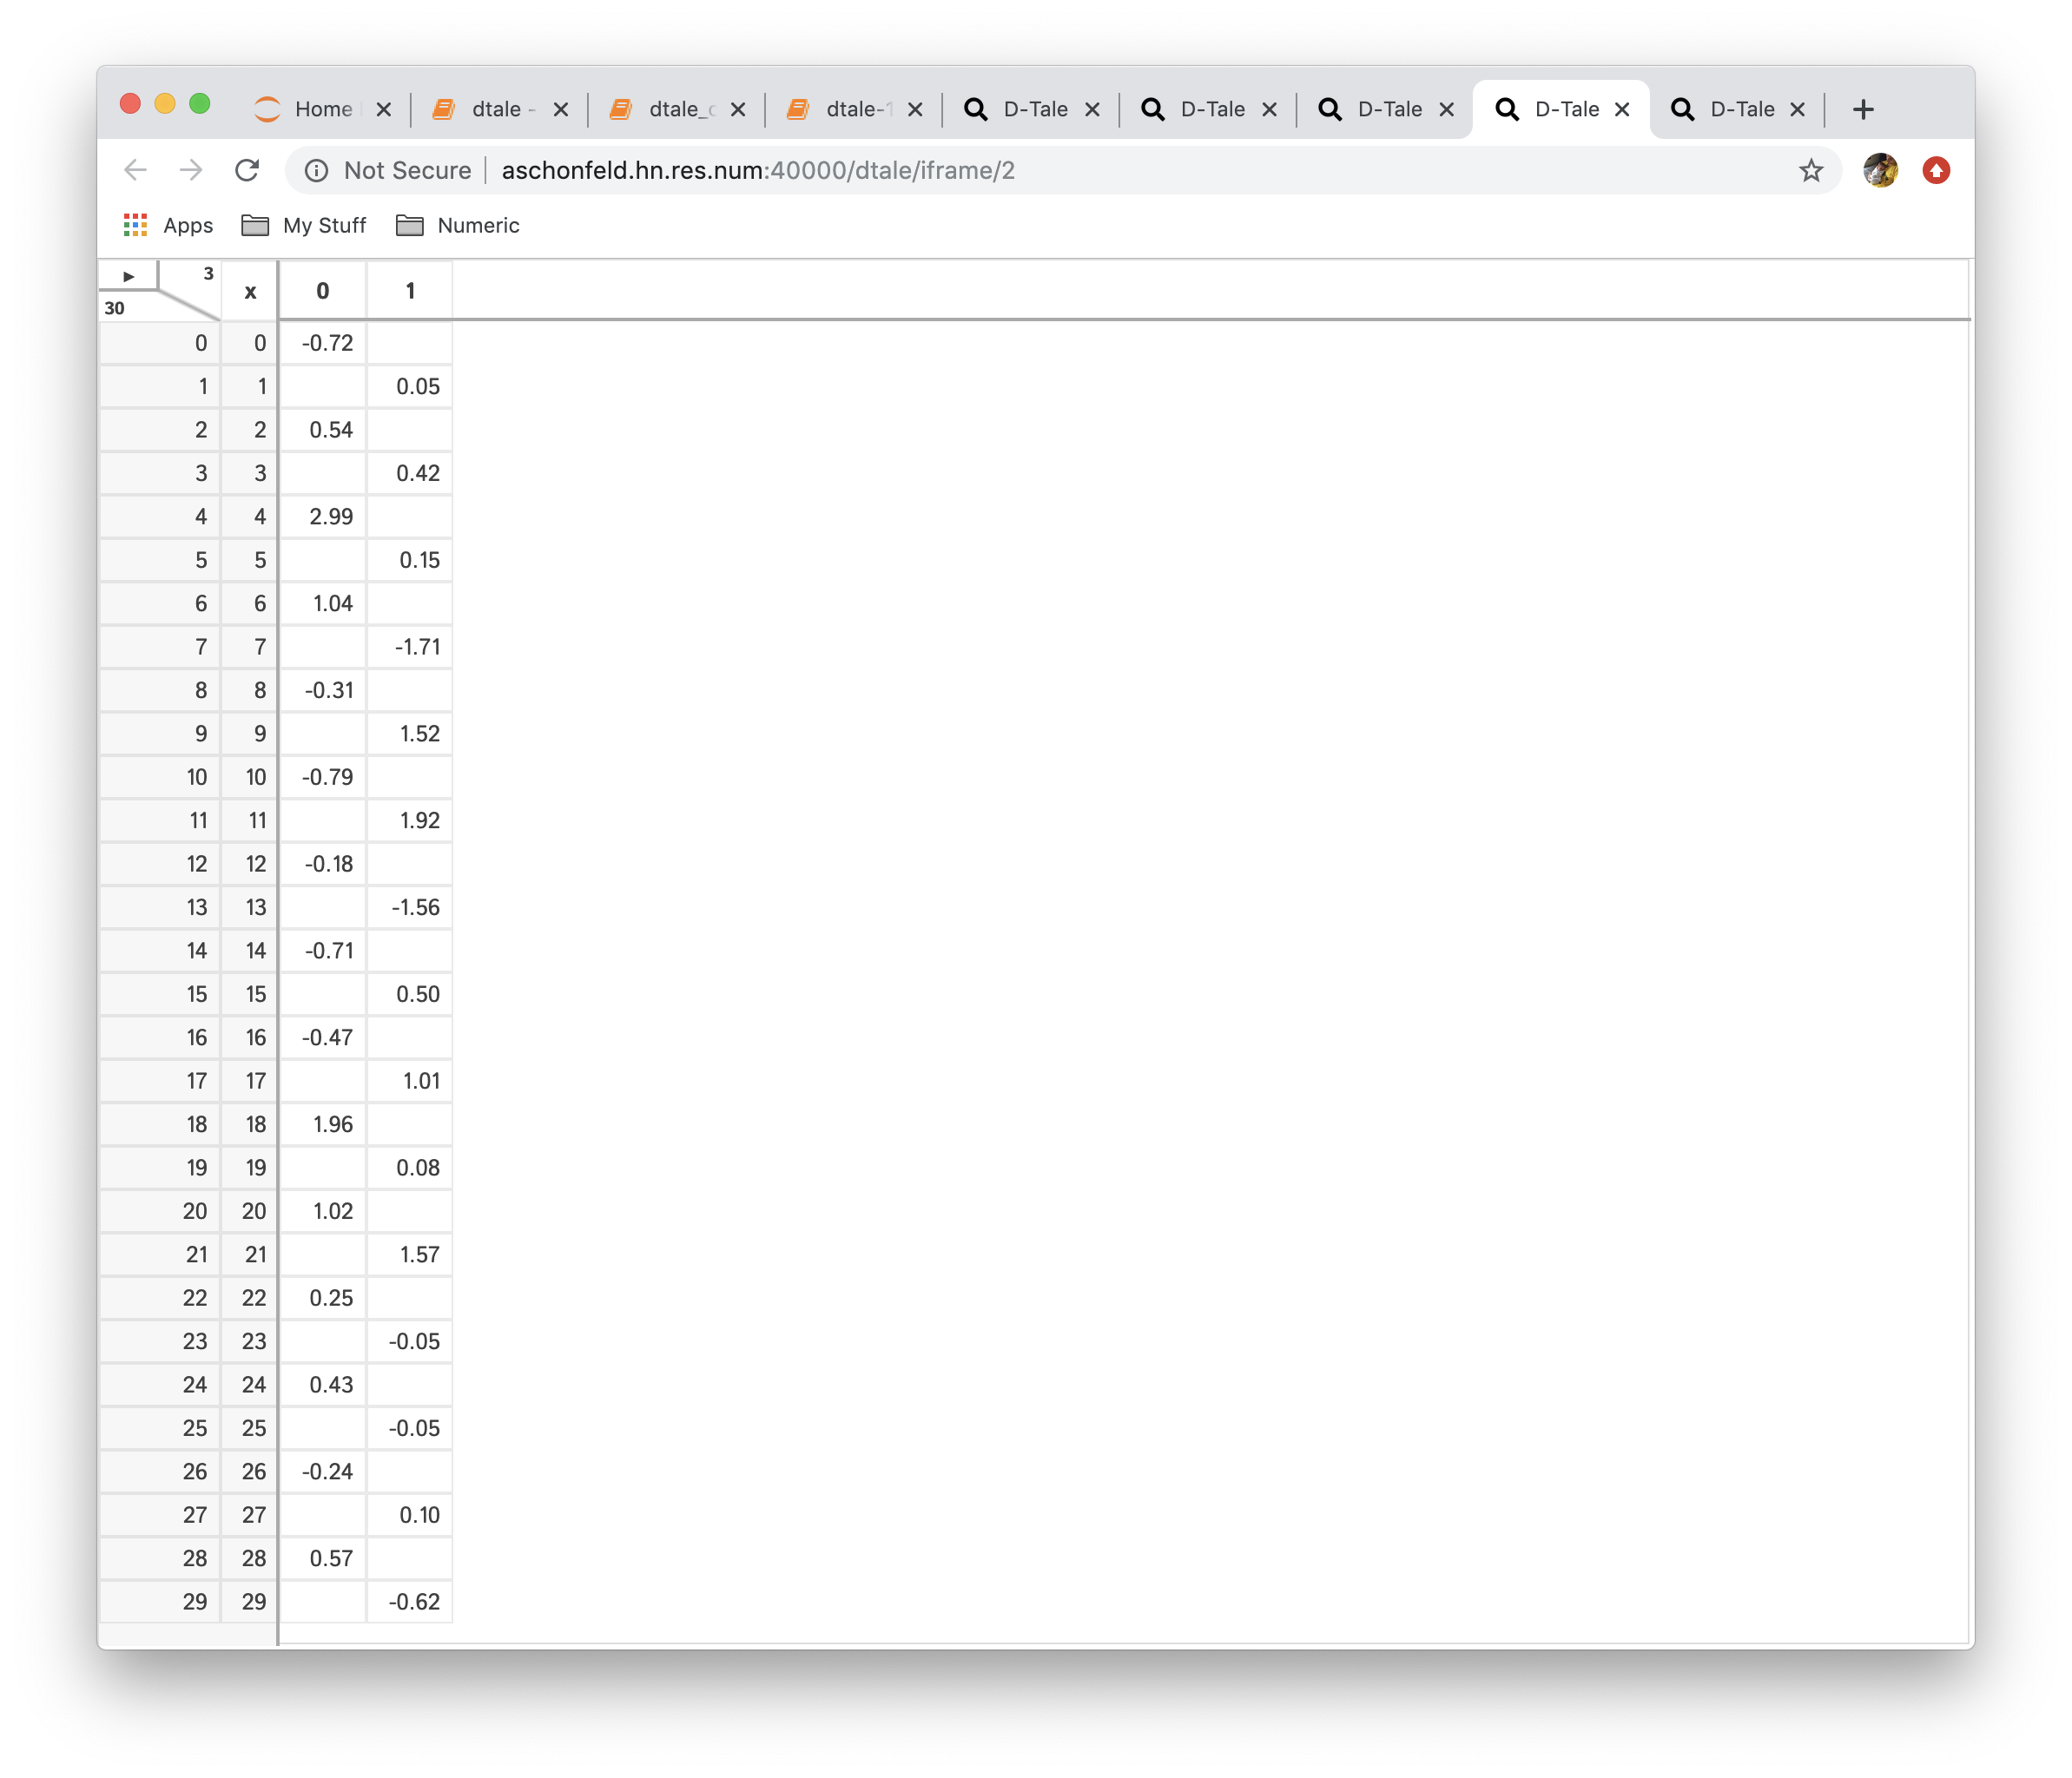
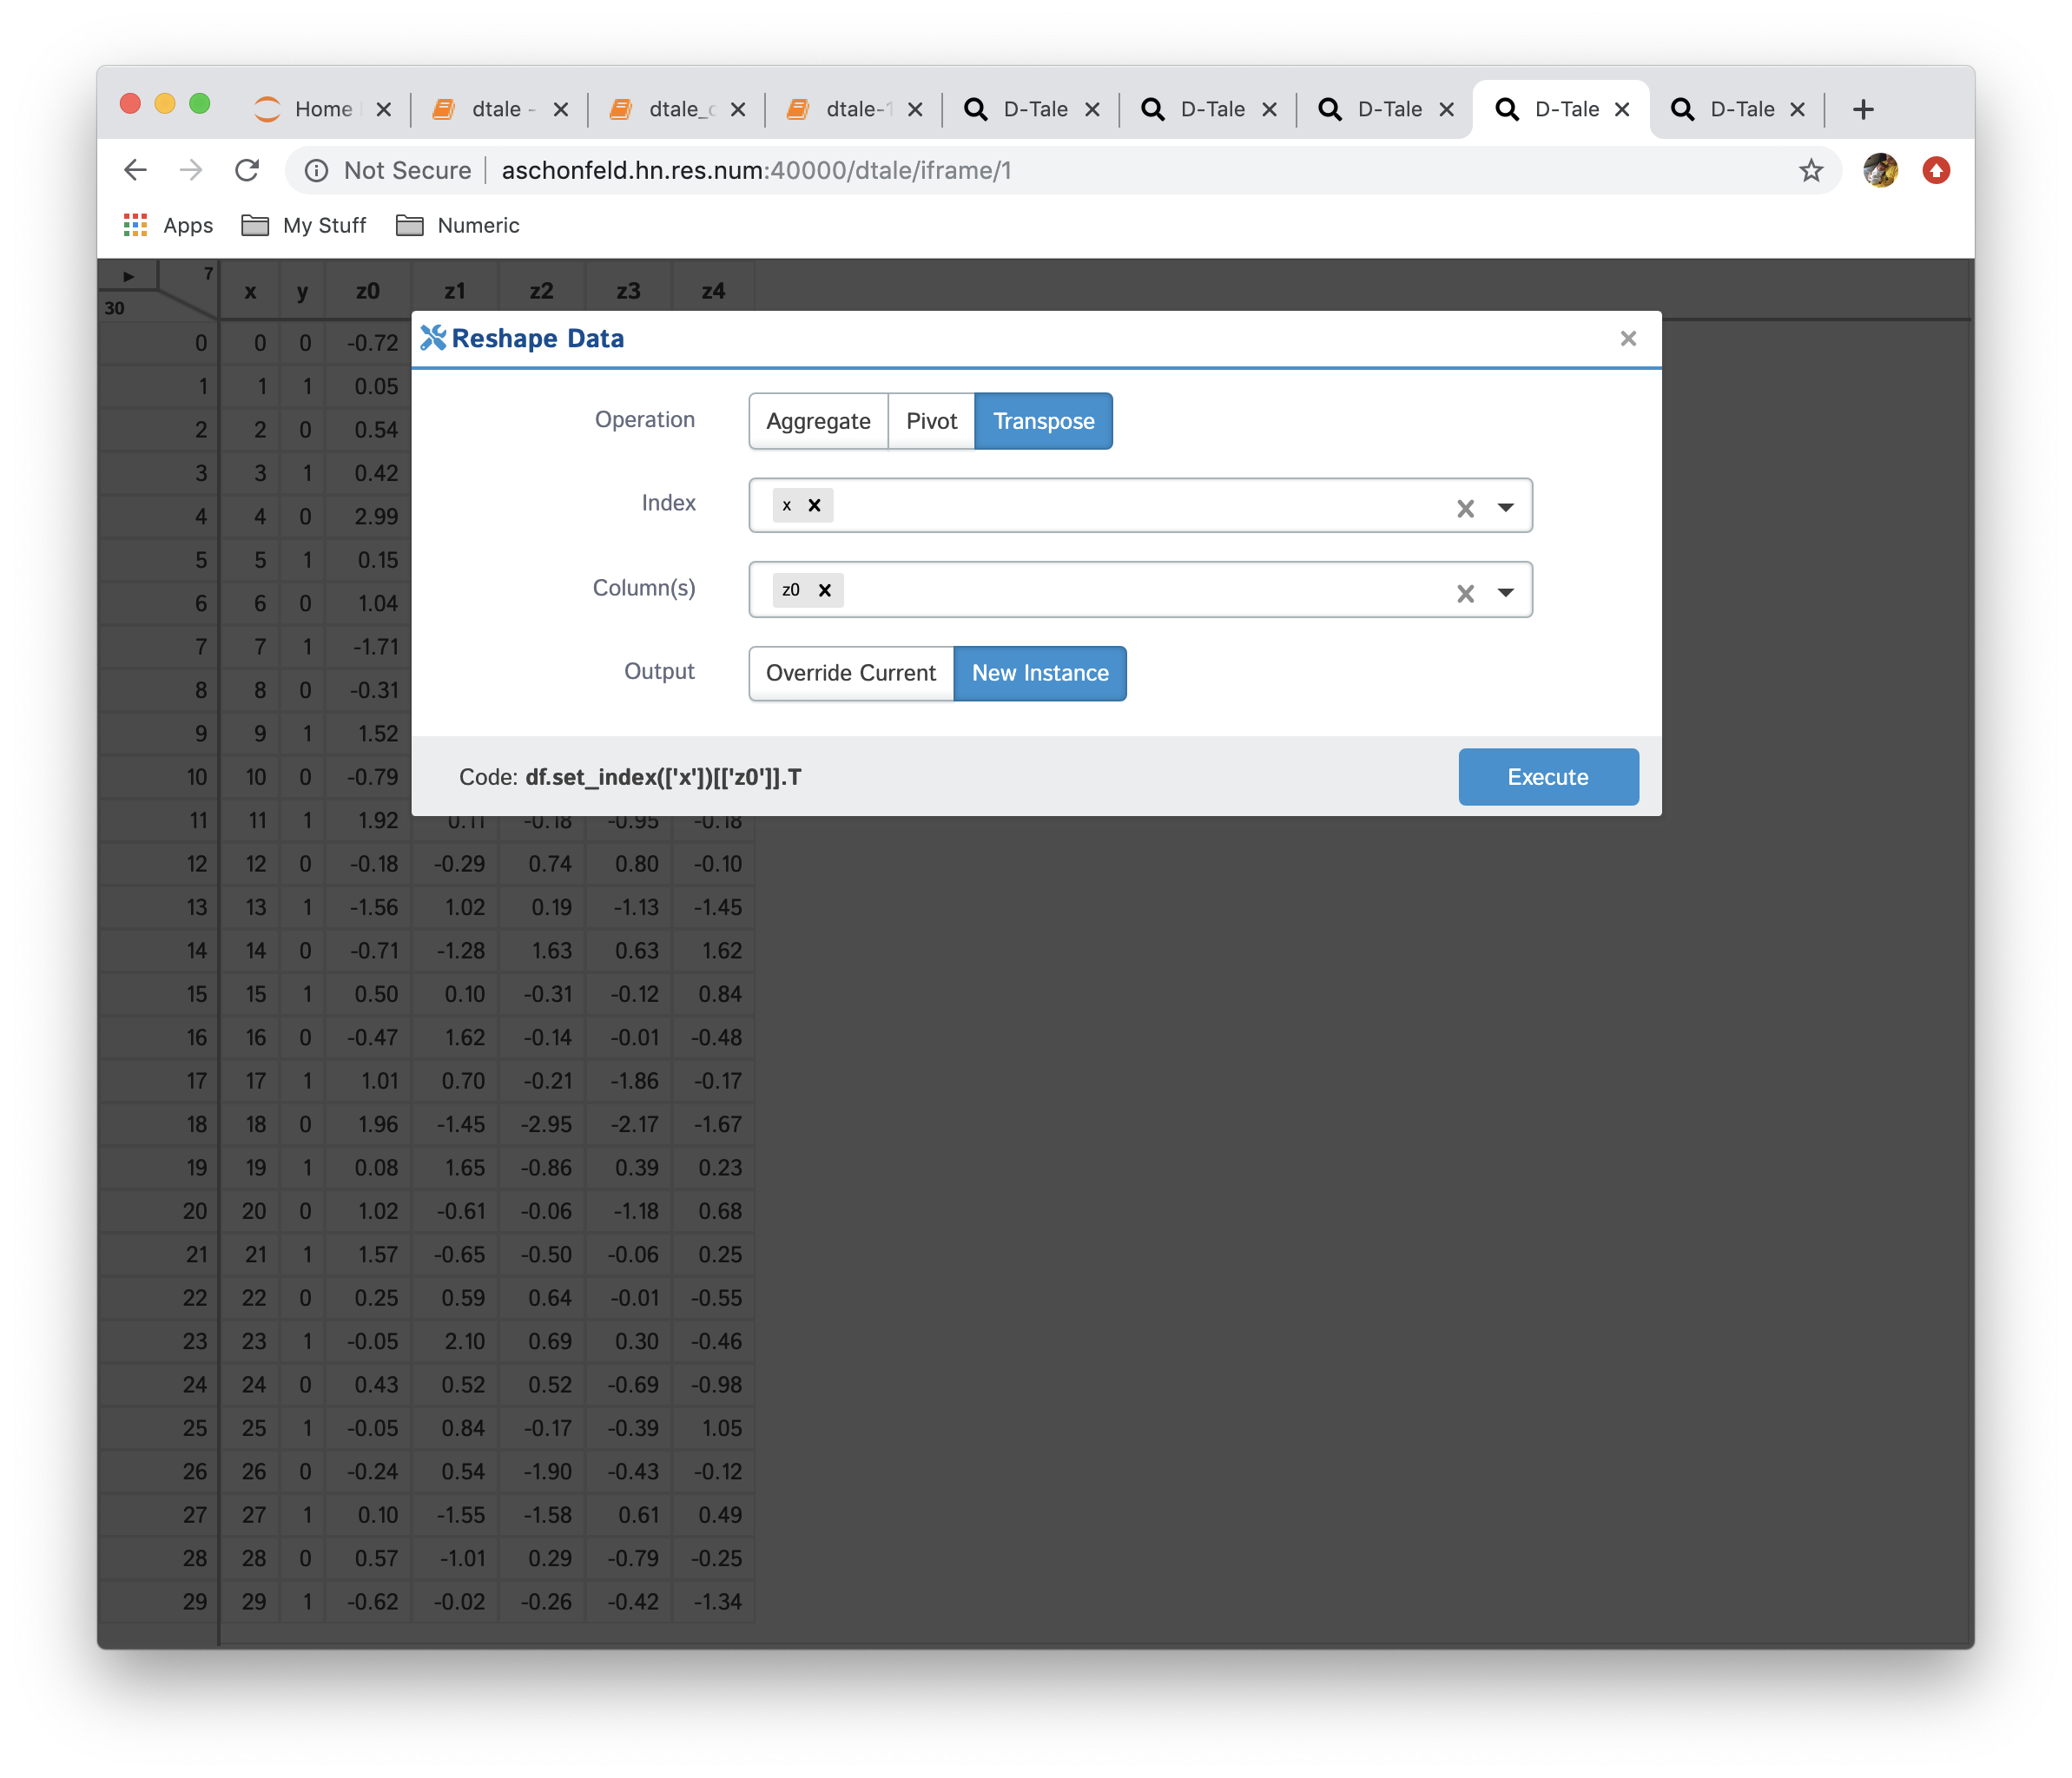
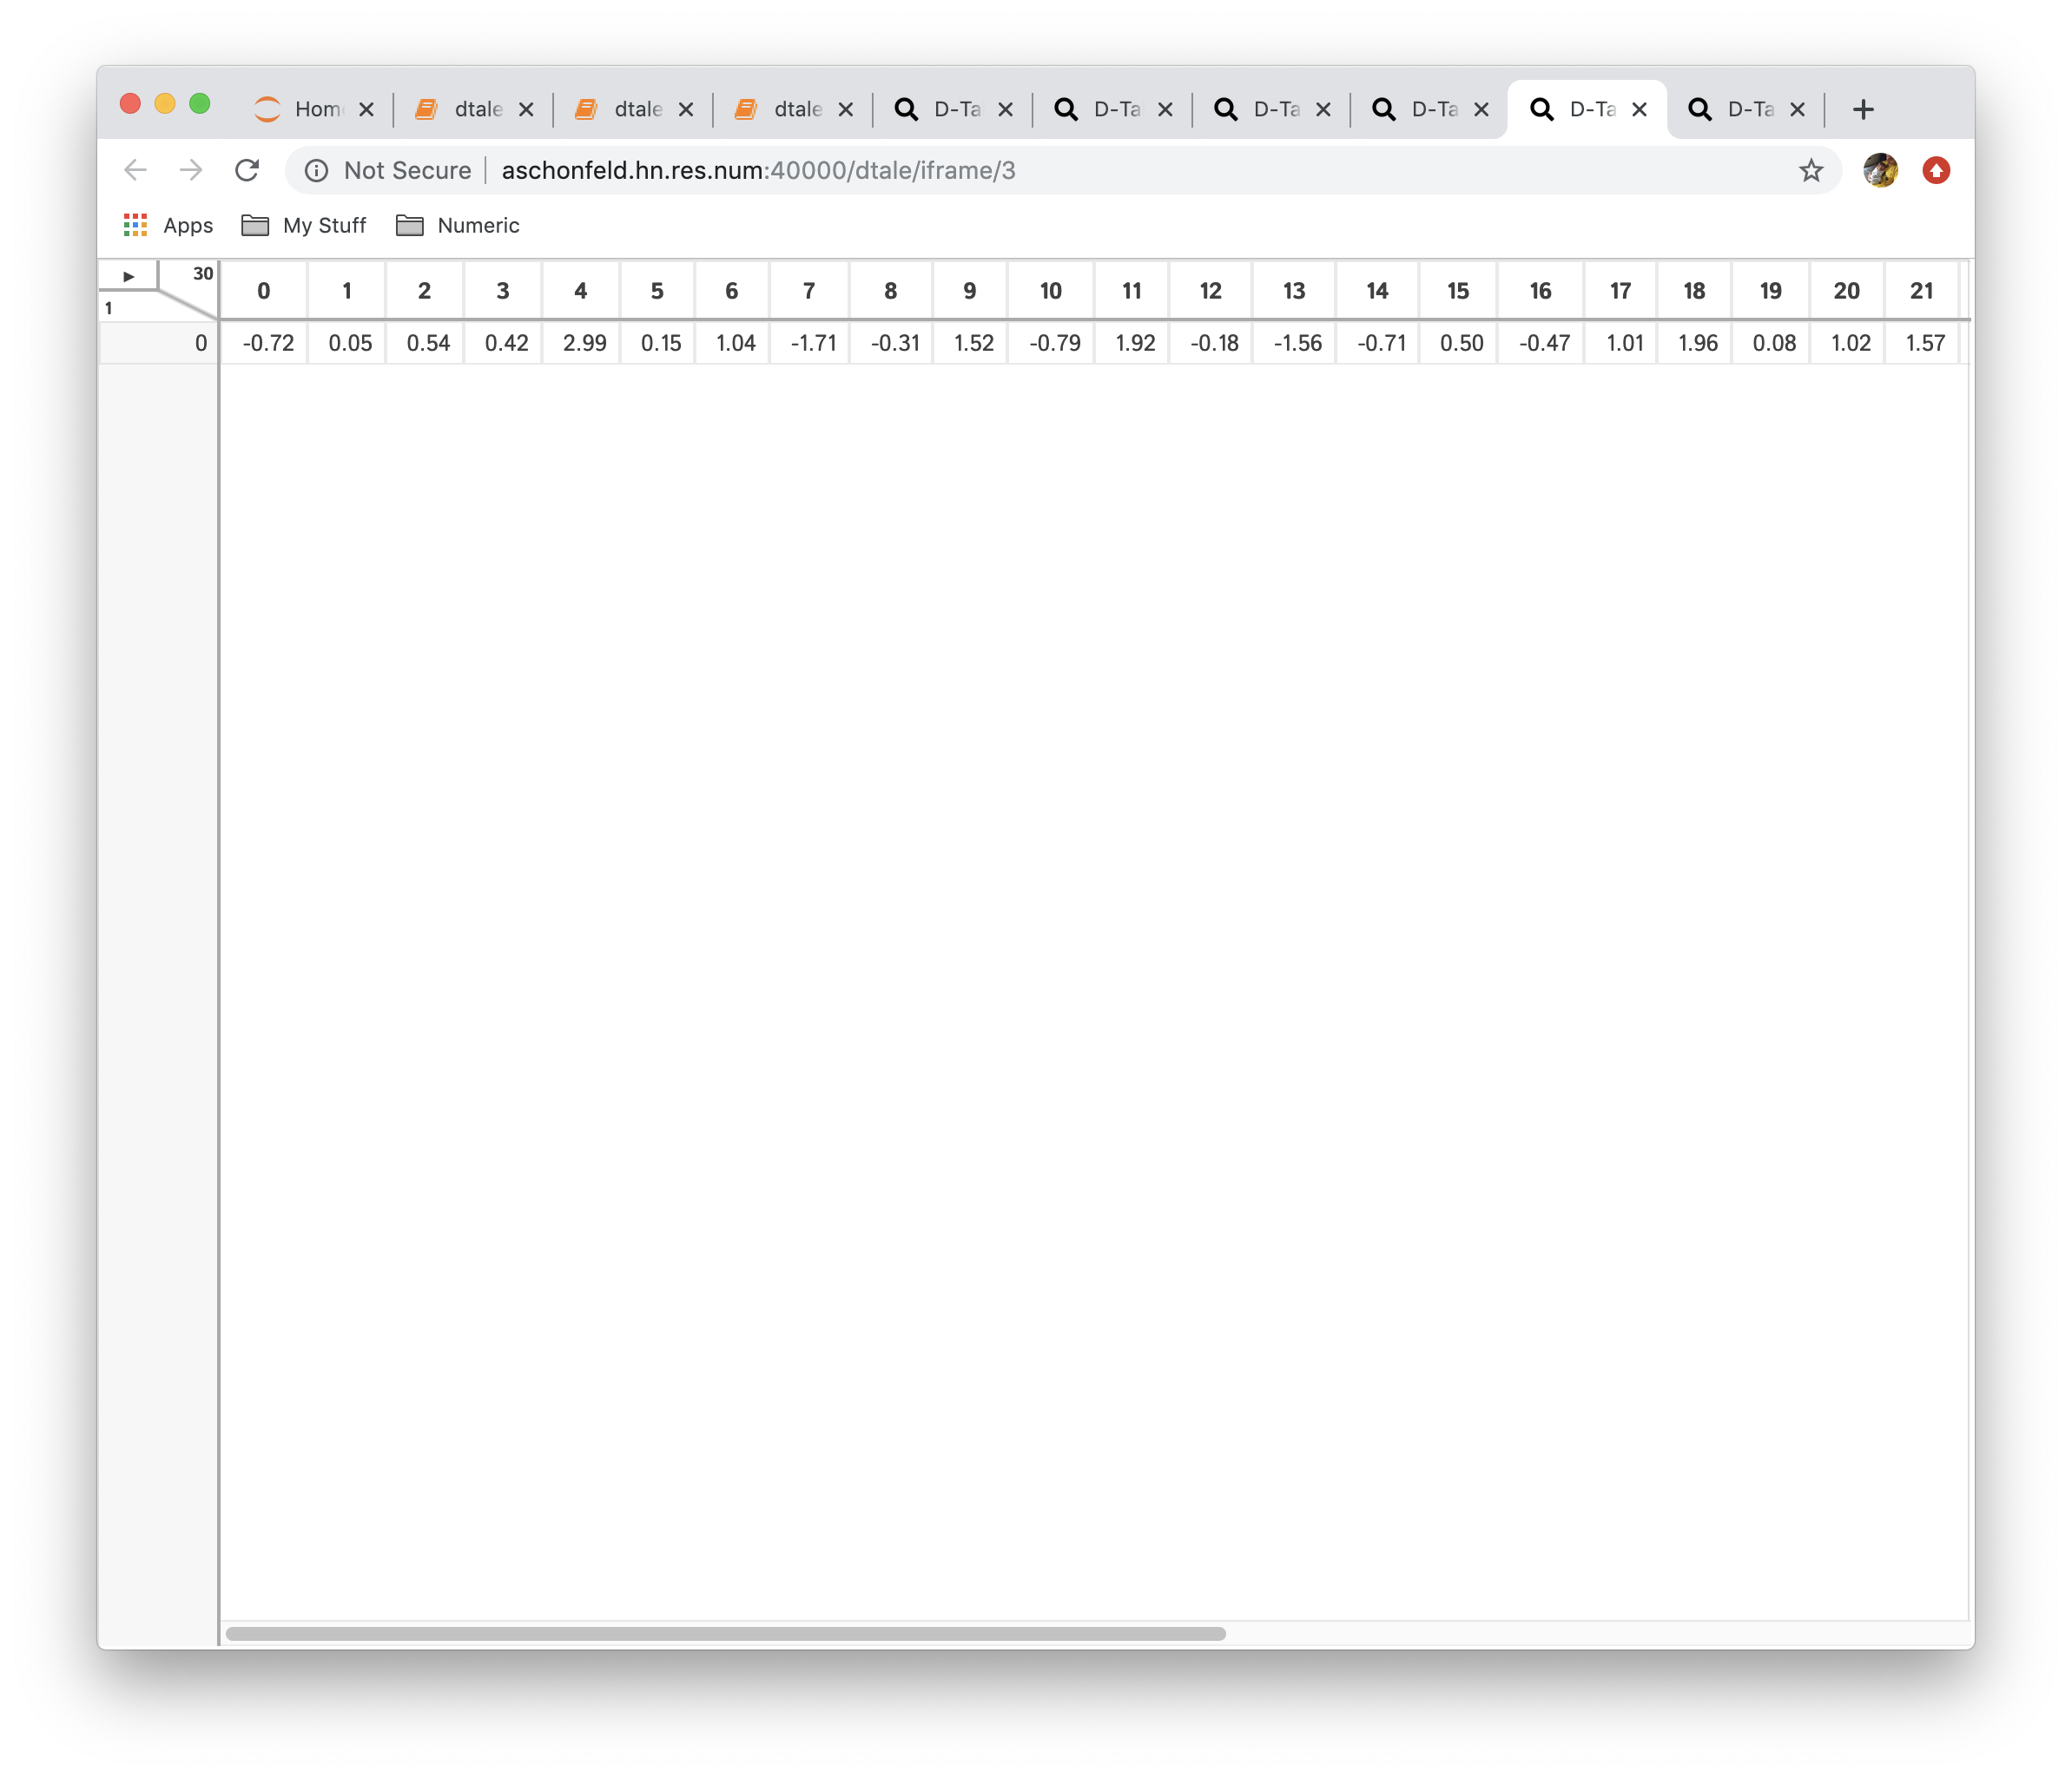
This is very powerful functionality which allows users to create a new data from currently loaded data. The operations currently available are:
| Function | Data |
|---|---|
| No Reshaping | 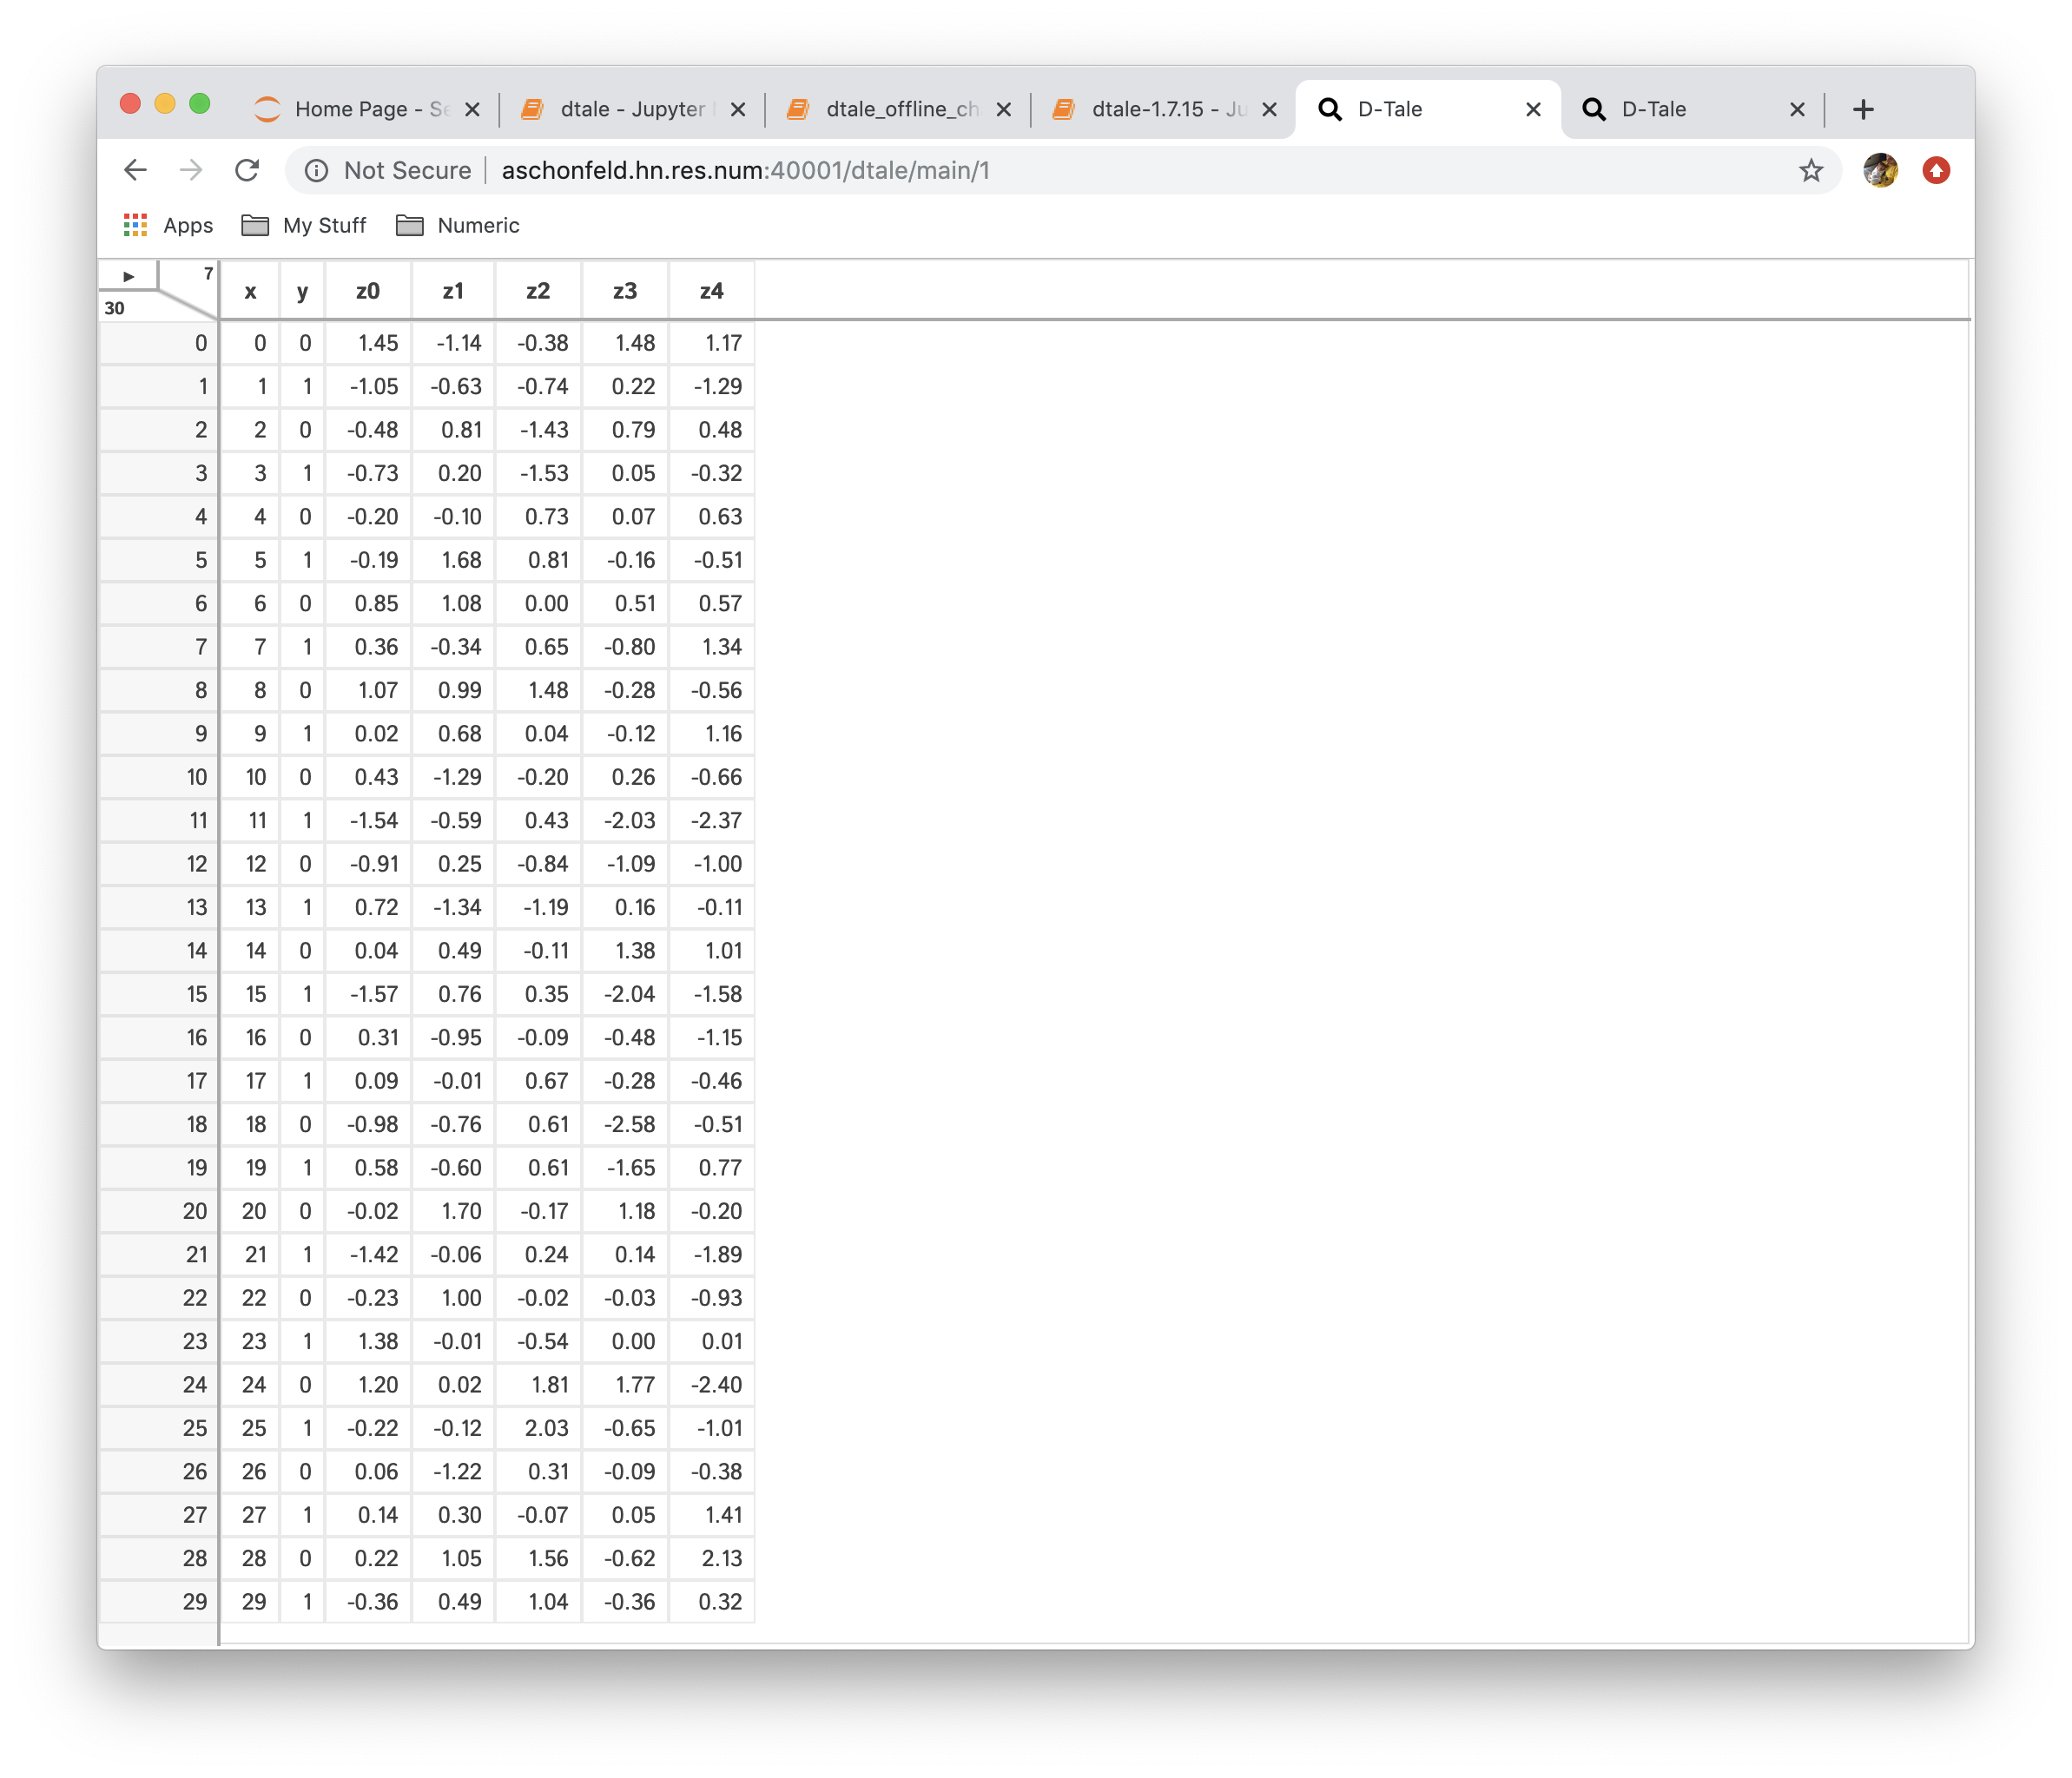 |
 |
 |
 |
 |
 |
 |
 |
 |
Remove duplicate columns/values from your data as well as extract duplicates out into separate instances.
The folowing screen shots are for a dataframe with the following data:
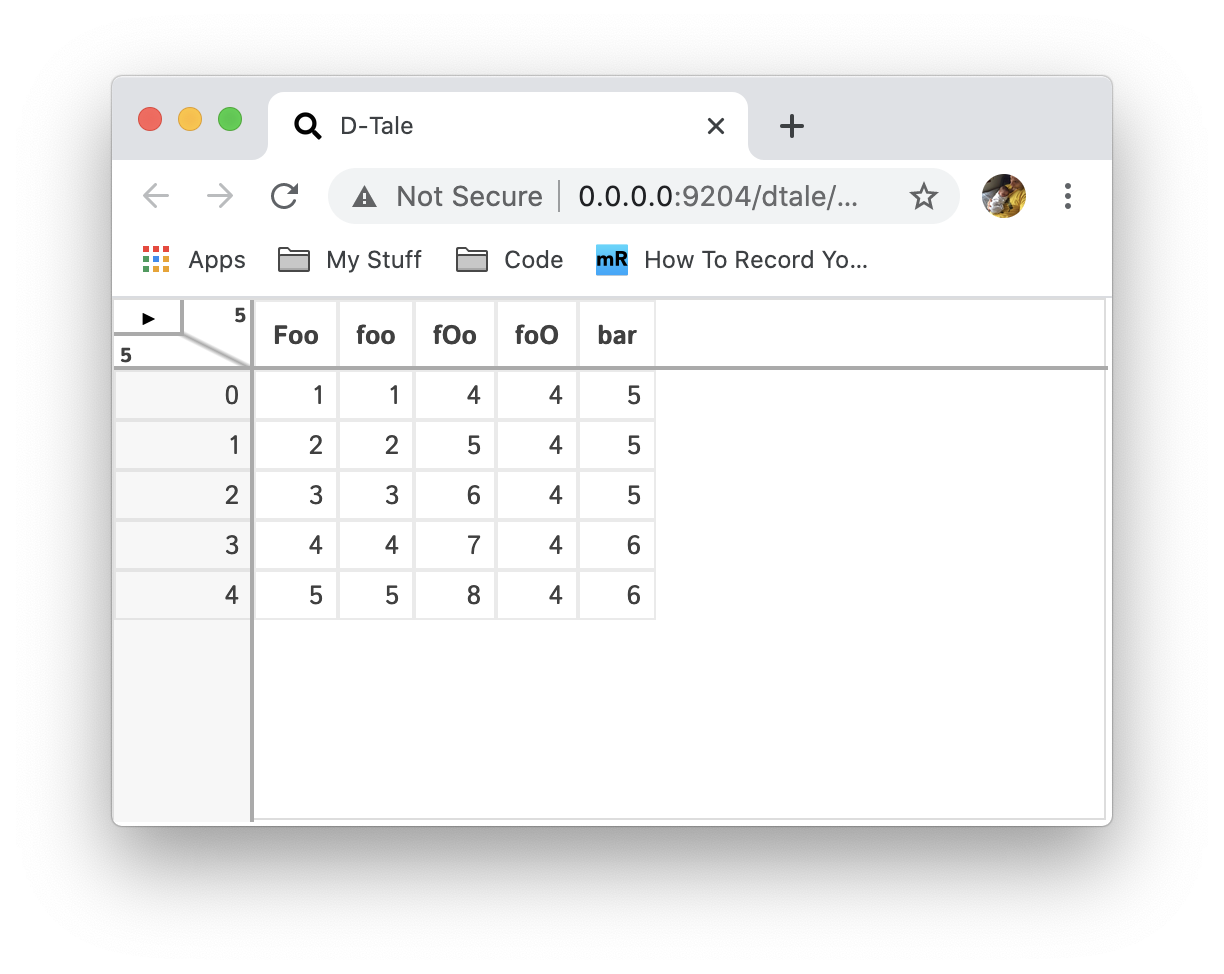
| Function | Description | Preview |
|---|---|---|
| Remove Duplicate Columns | Remove any columns that contain the same data as another and you can either keep the first, last or none of these columns that match this criteria. You can test which columns will be removed by clicking the "View Duplicates" button. |  |
| Remove Duplicate Column Names | Remove any columns with the same name (name comparison is case-insensitive) and you can either keep the first, last or none of these columns that match this criteria. You can test which columns will be removed by clicking the "View Duplicates" button. | 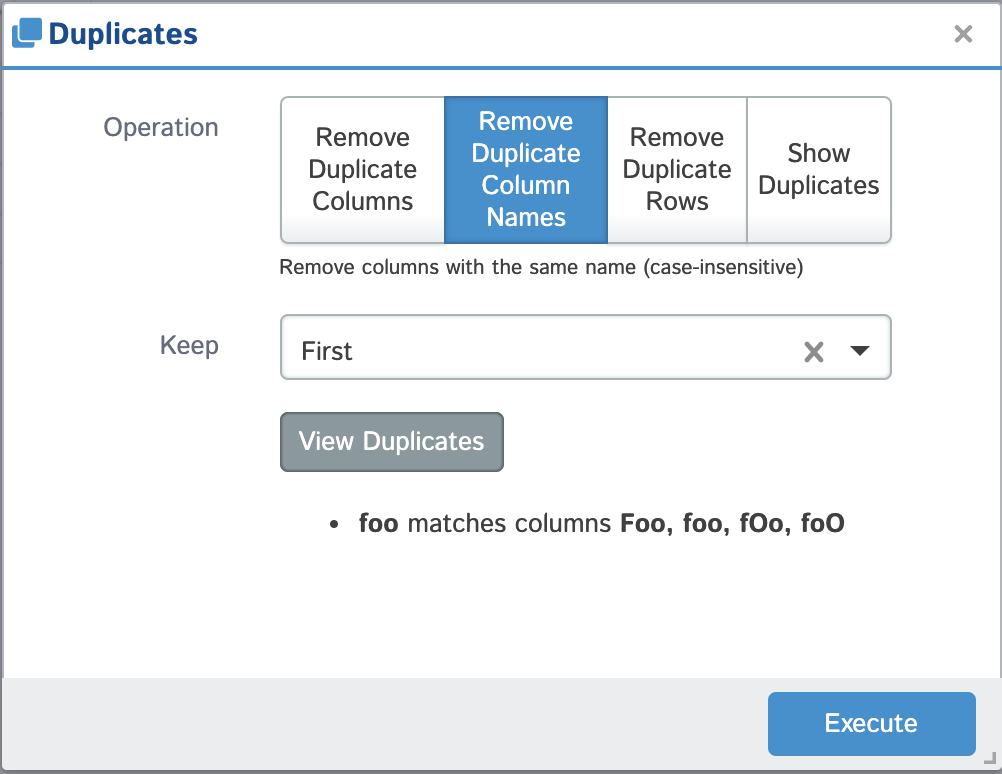 |
| Remove Duplicate Rows | Remove any rows from your dataframe where the values of a subset of columns are considered duplicates. You can choose to keep the first, last or none of the rows considered duplicated. | 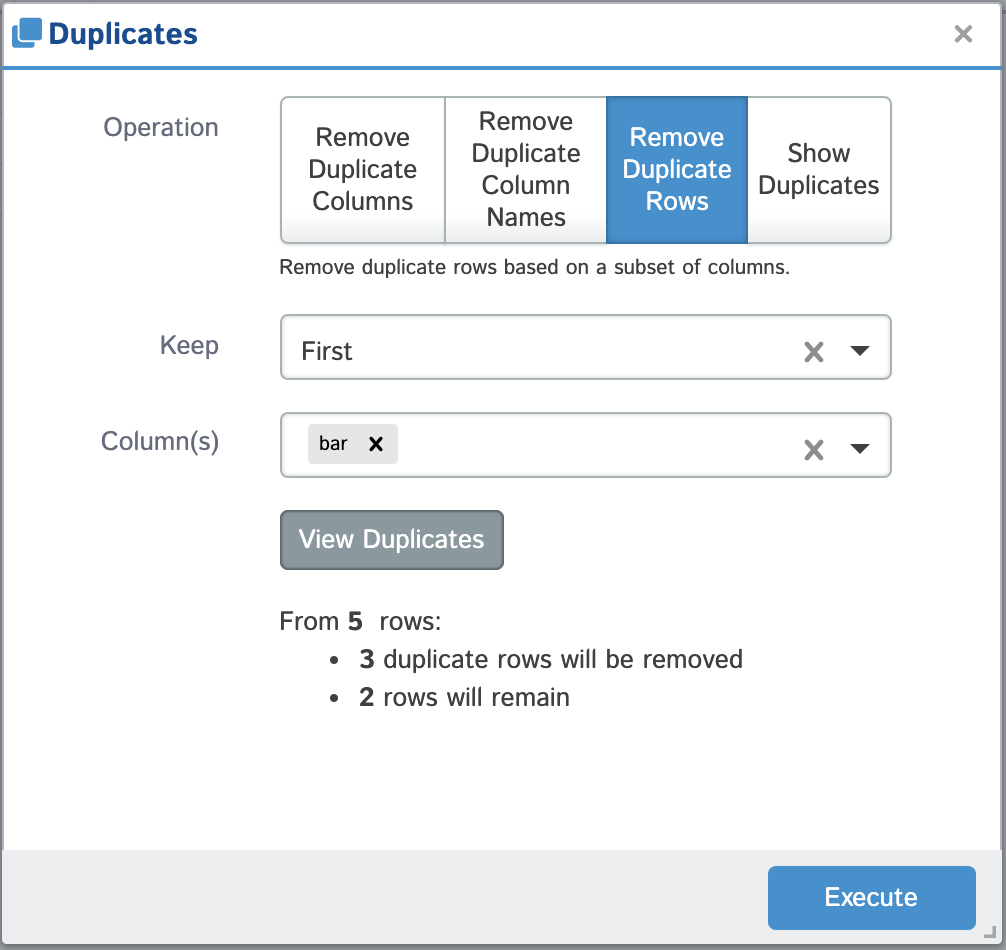 |
| Show Duplicates | Break any duplicate rows (based on a subset of columns) out into another dataframe viewable in your D-Tale session. You can choose to view all duplicates or select specific groups based on the duplicated value. | 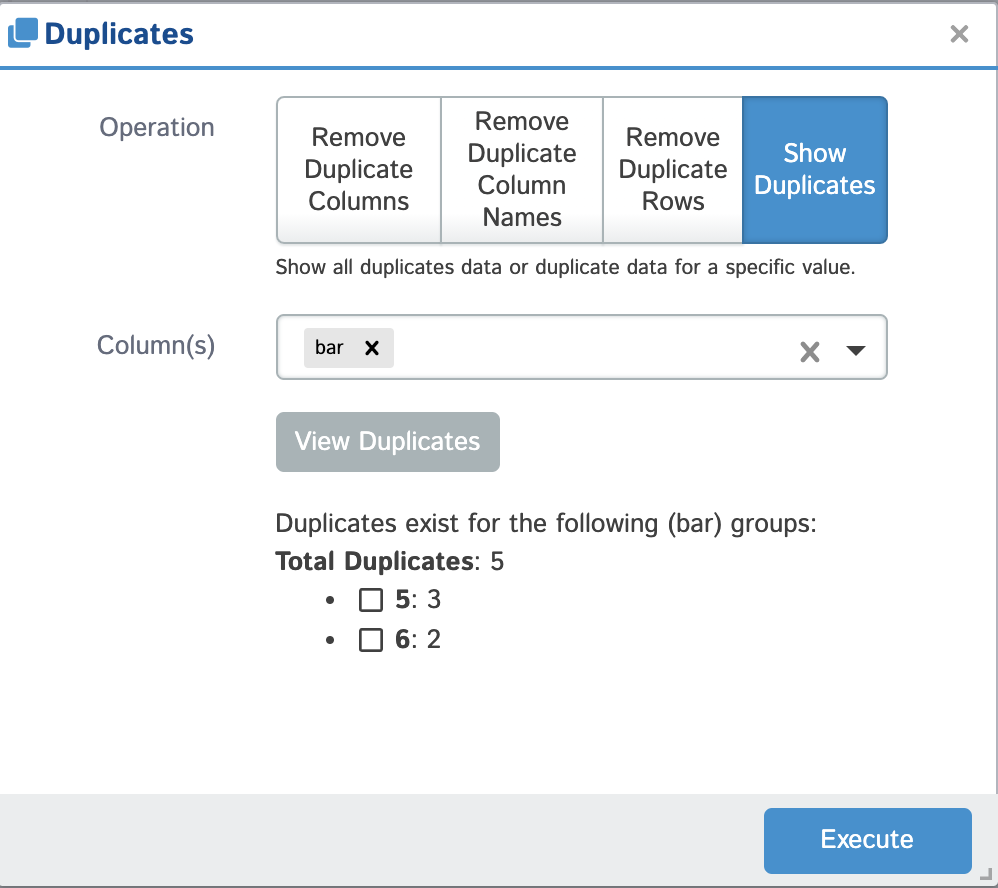 |
Display charts analyzing the presence of missing (NaN) data in your dataset using the missingno pacakage. You can also open them in a tab by themselves or export them to a static PNG using the links in the upper right corner. You can also close the side panel using the ESC key.
| Chart | Sample |
|---|---|
| Matrix | 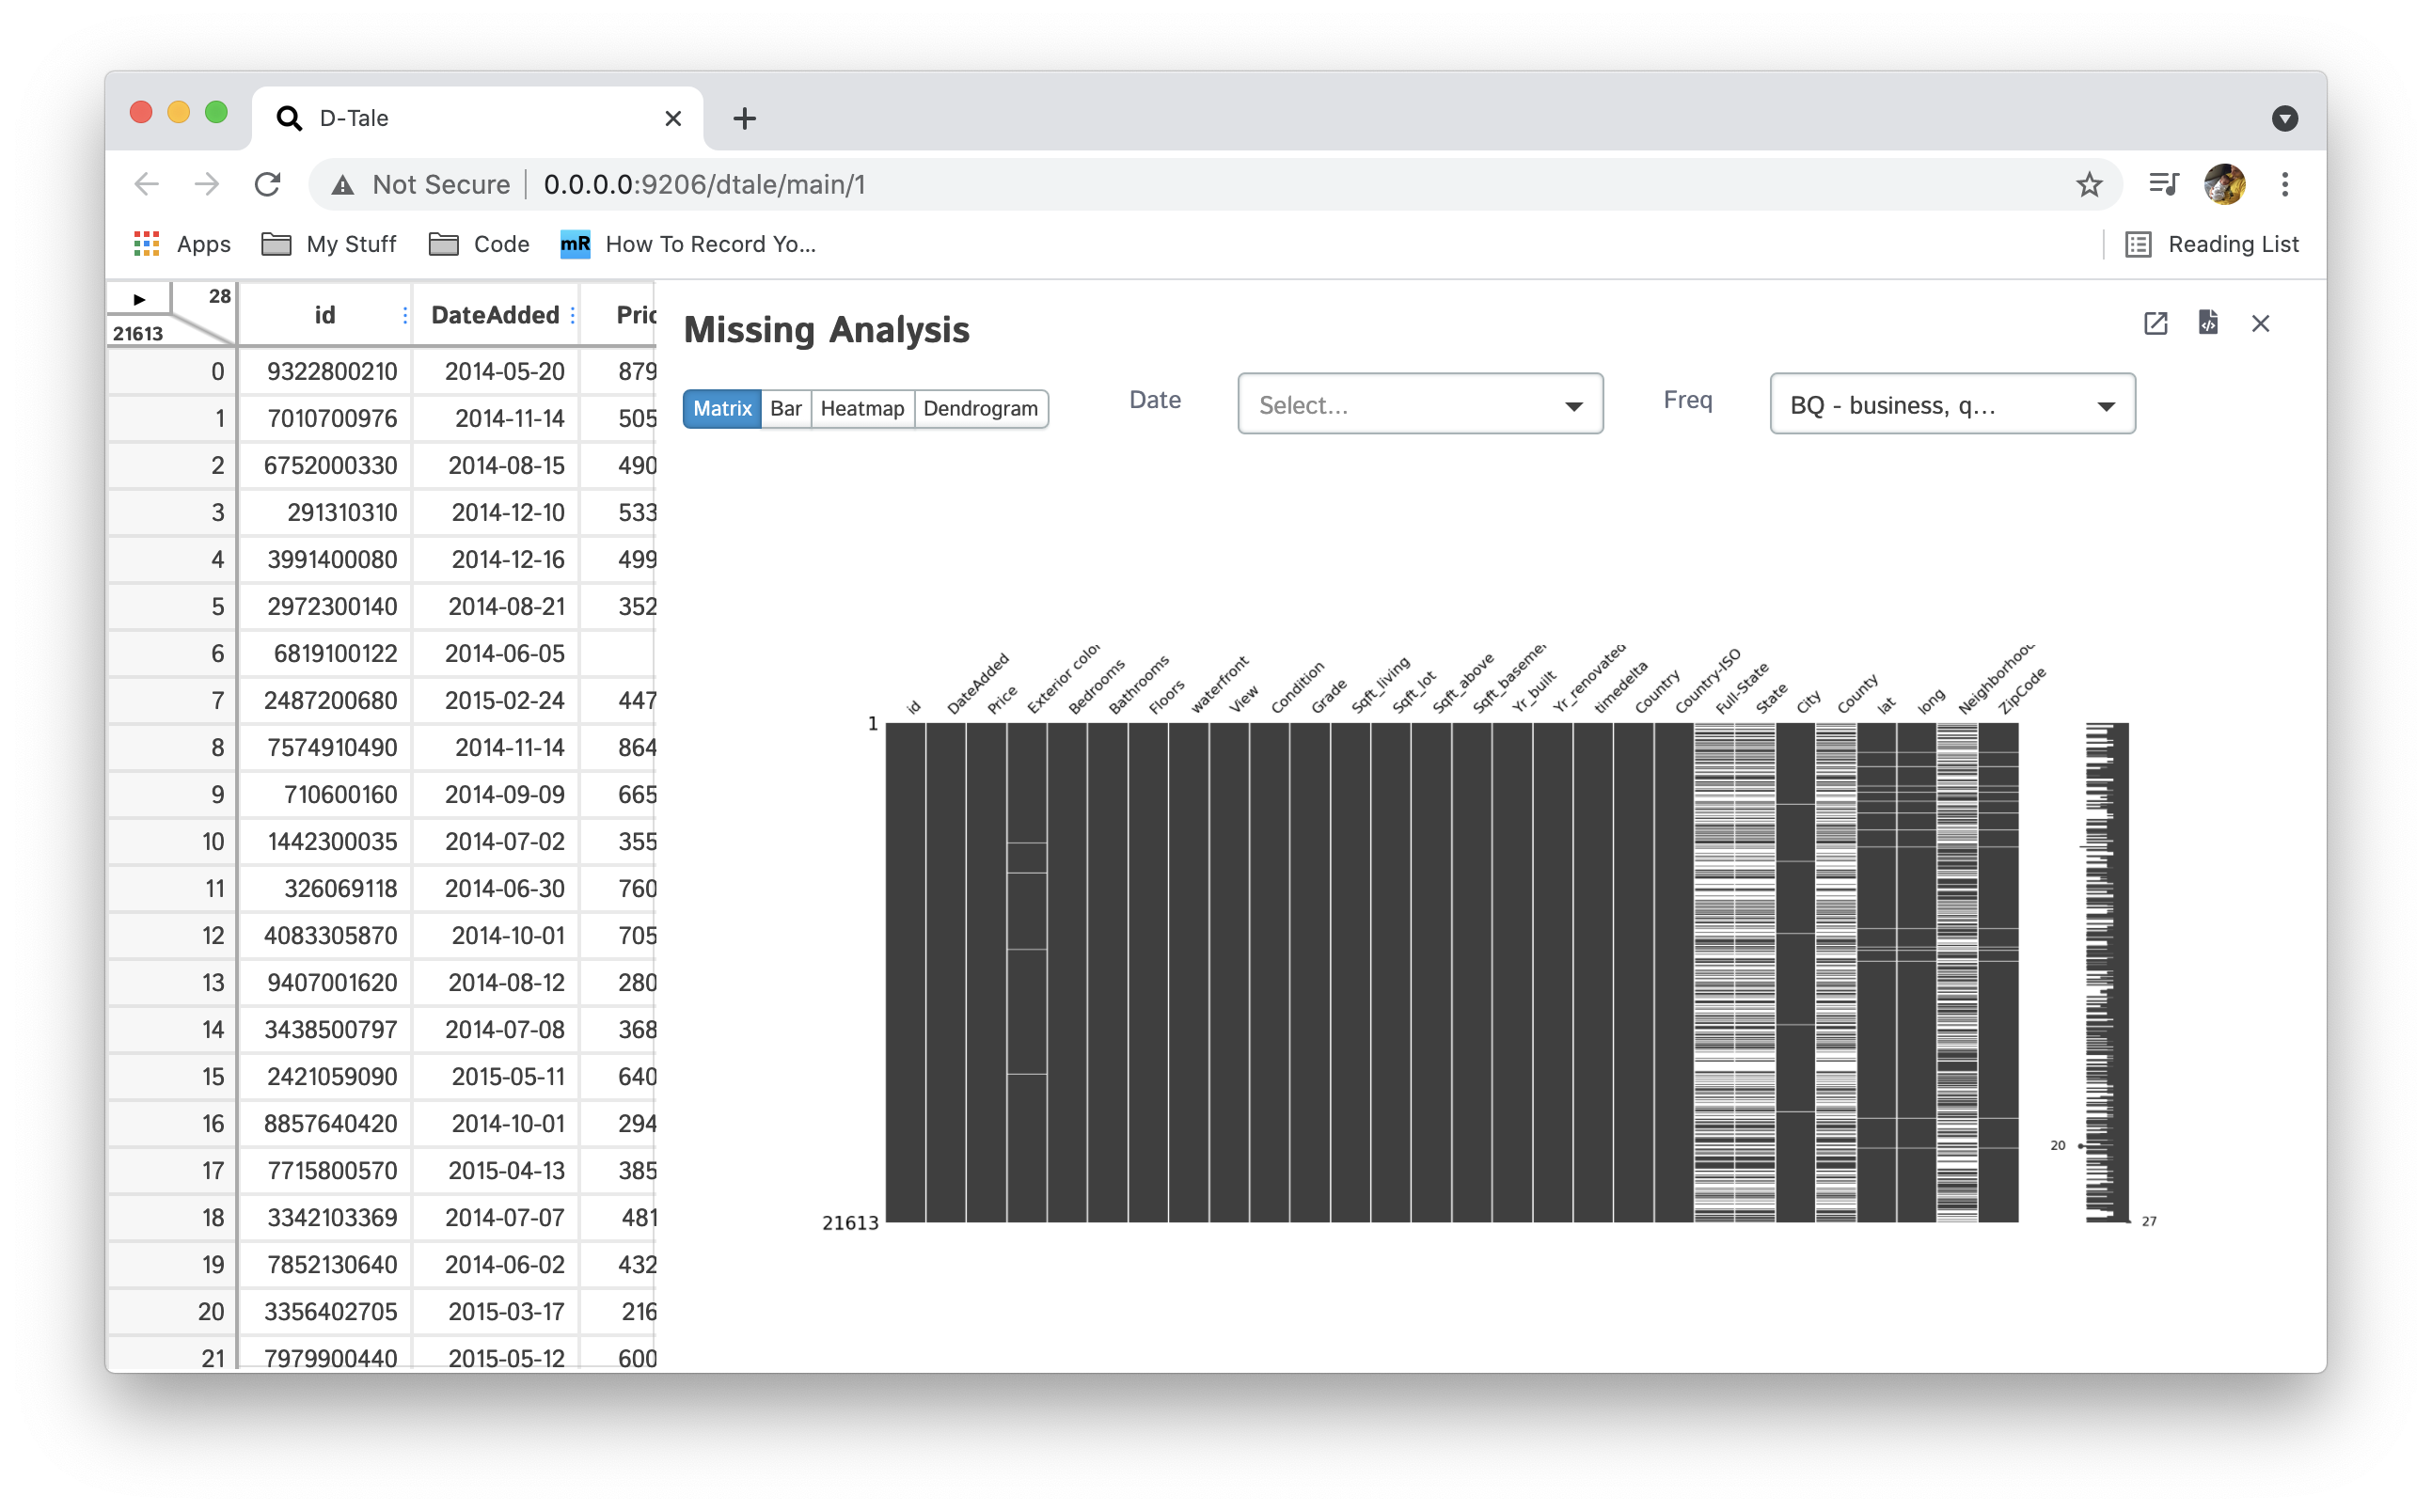 |
| Bar | 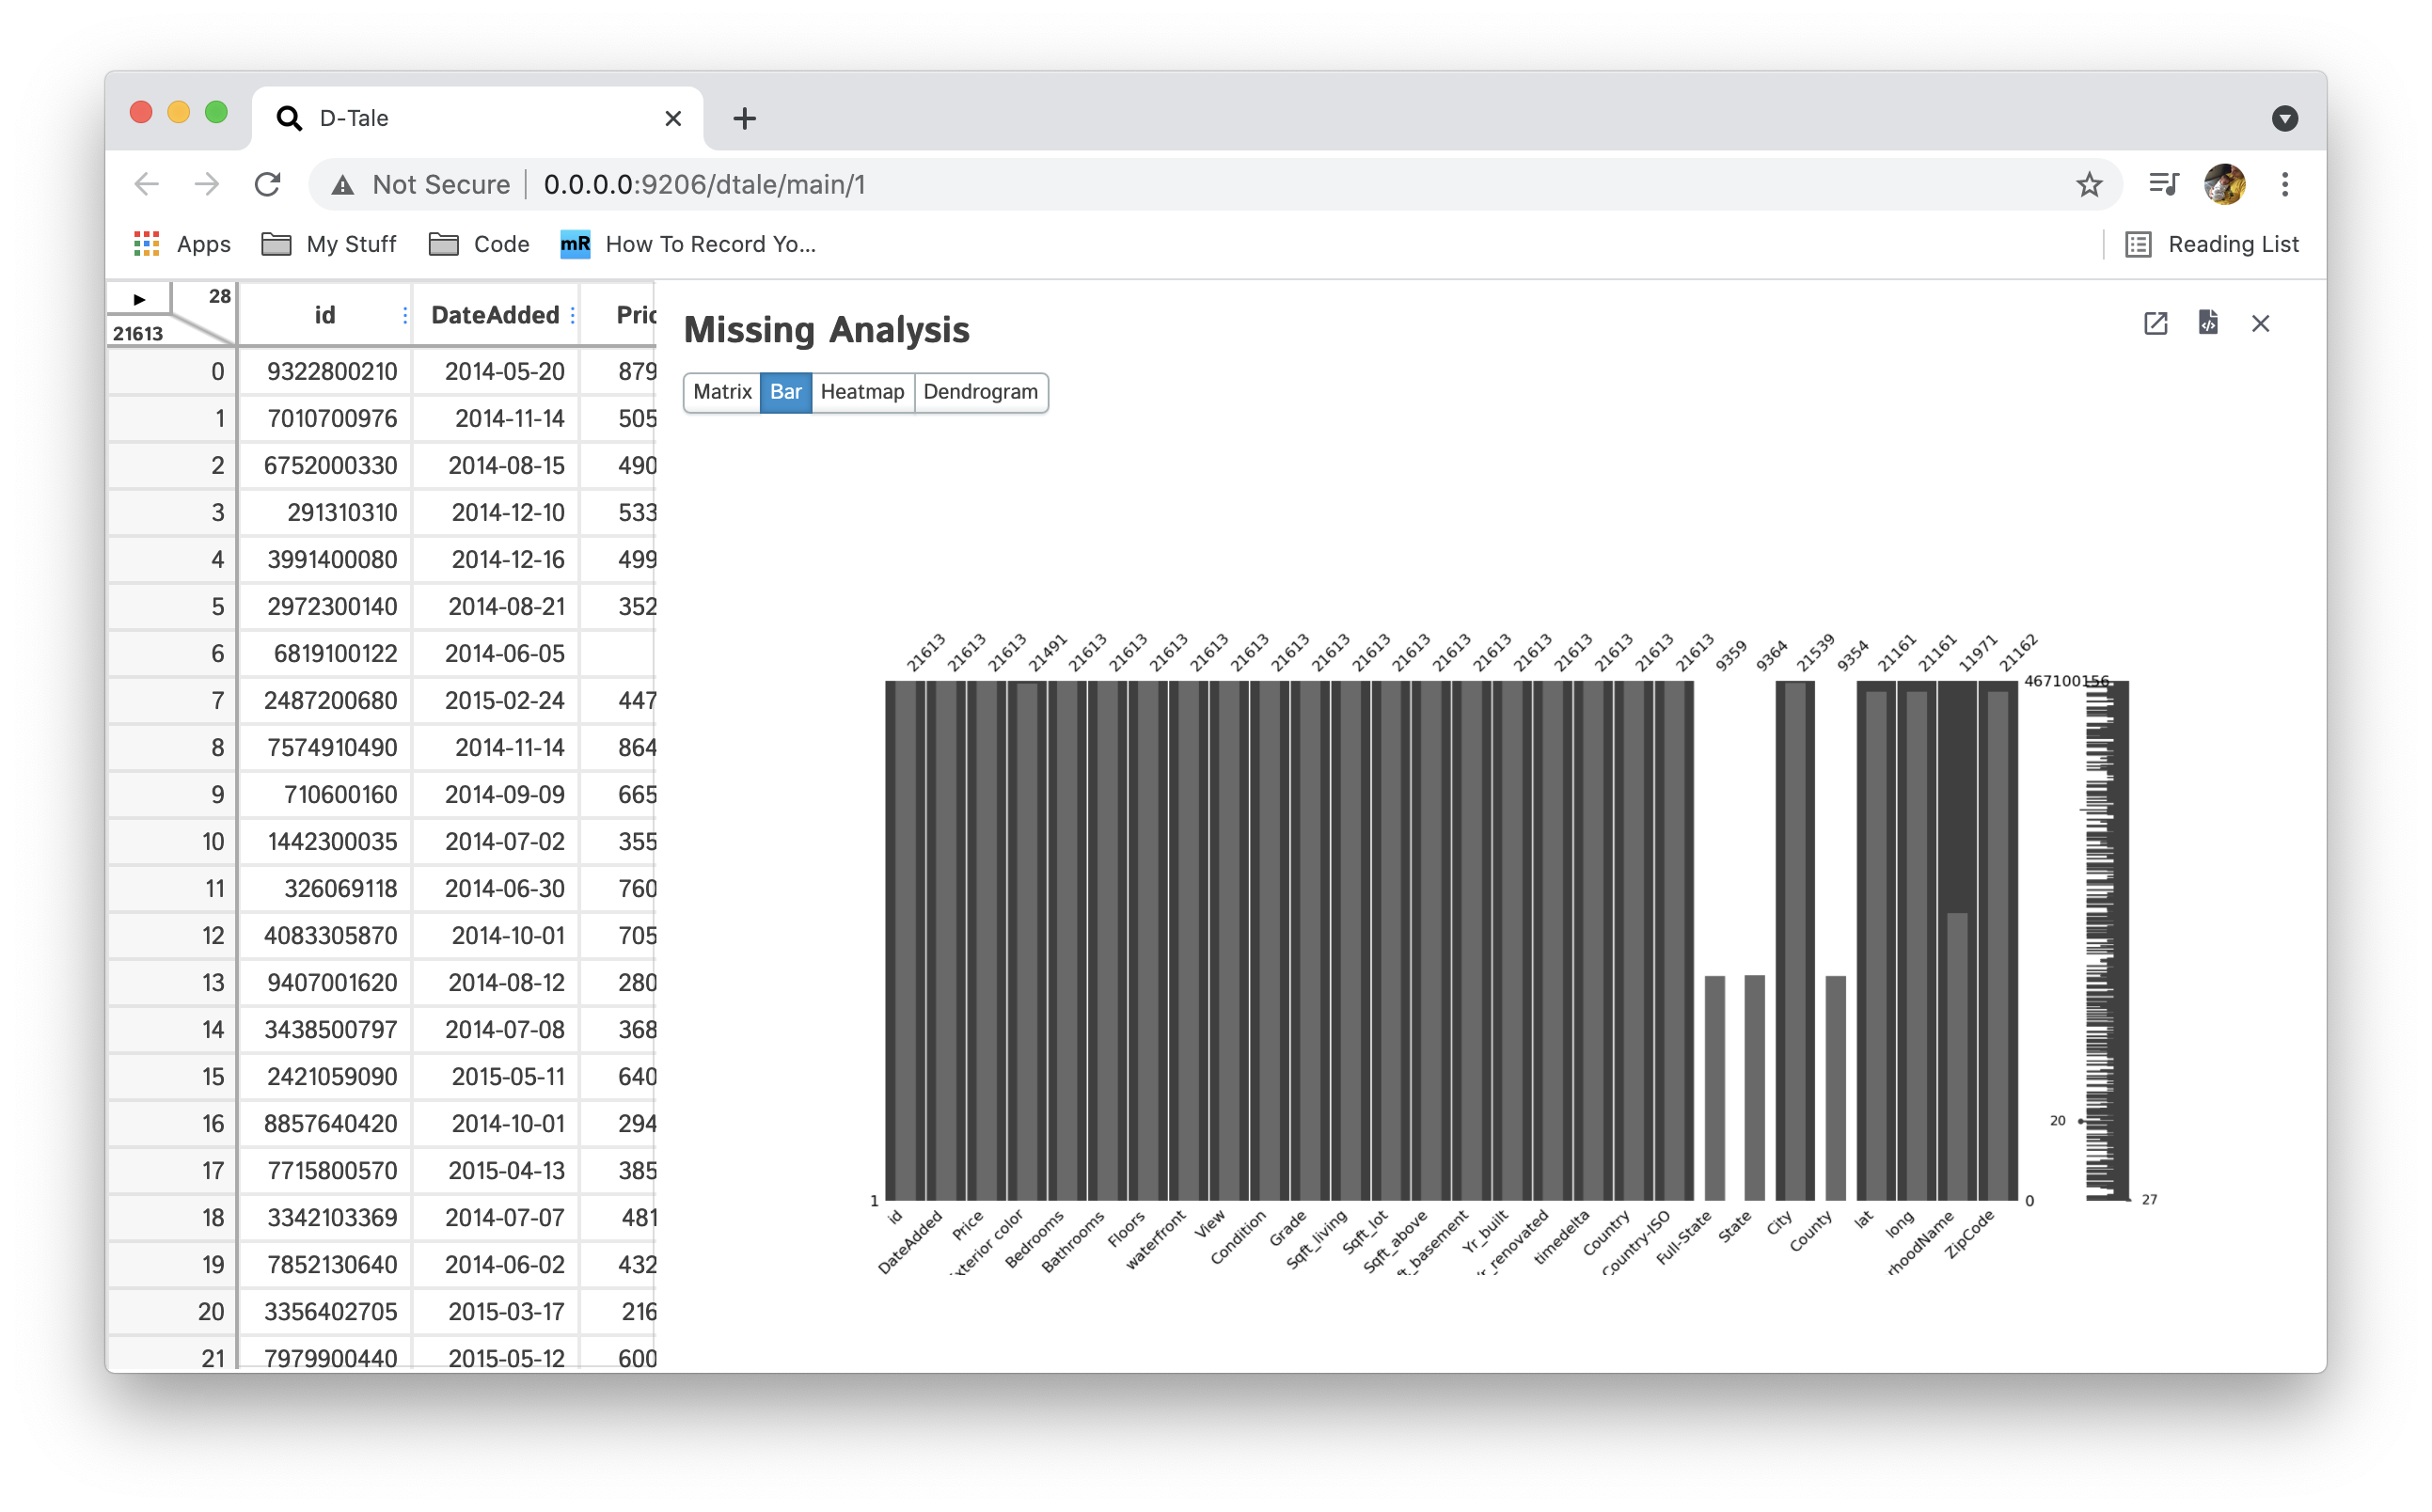 |
| Heatmap | 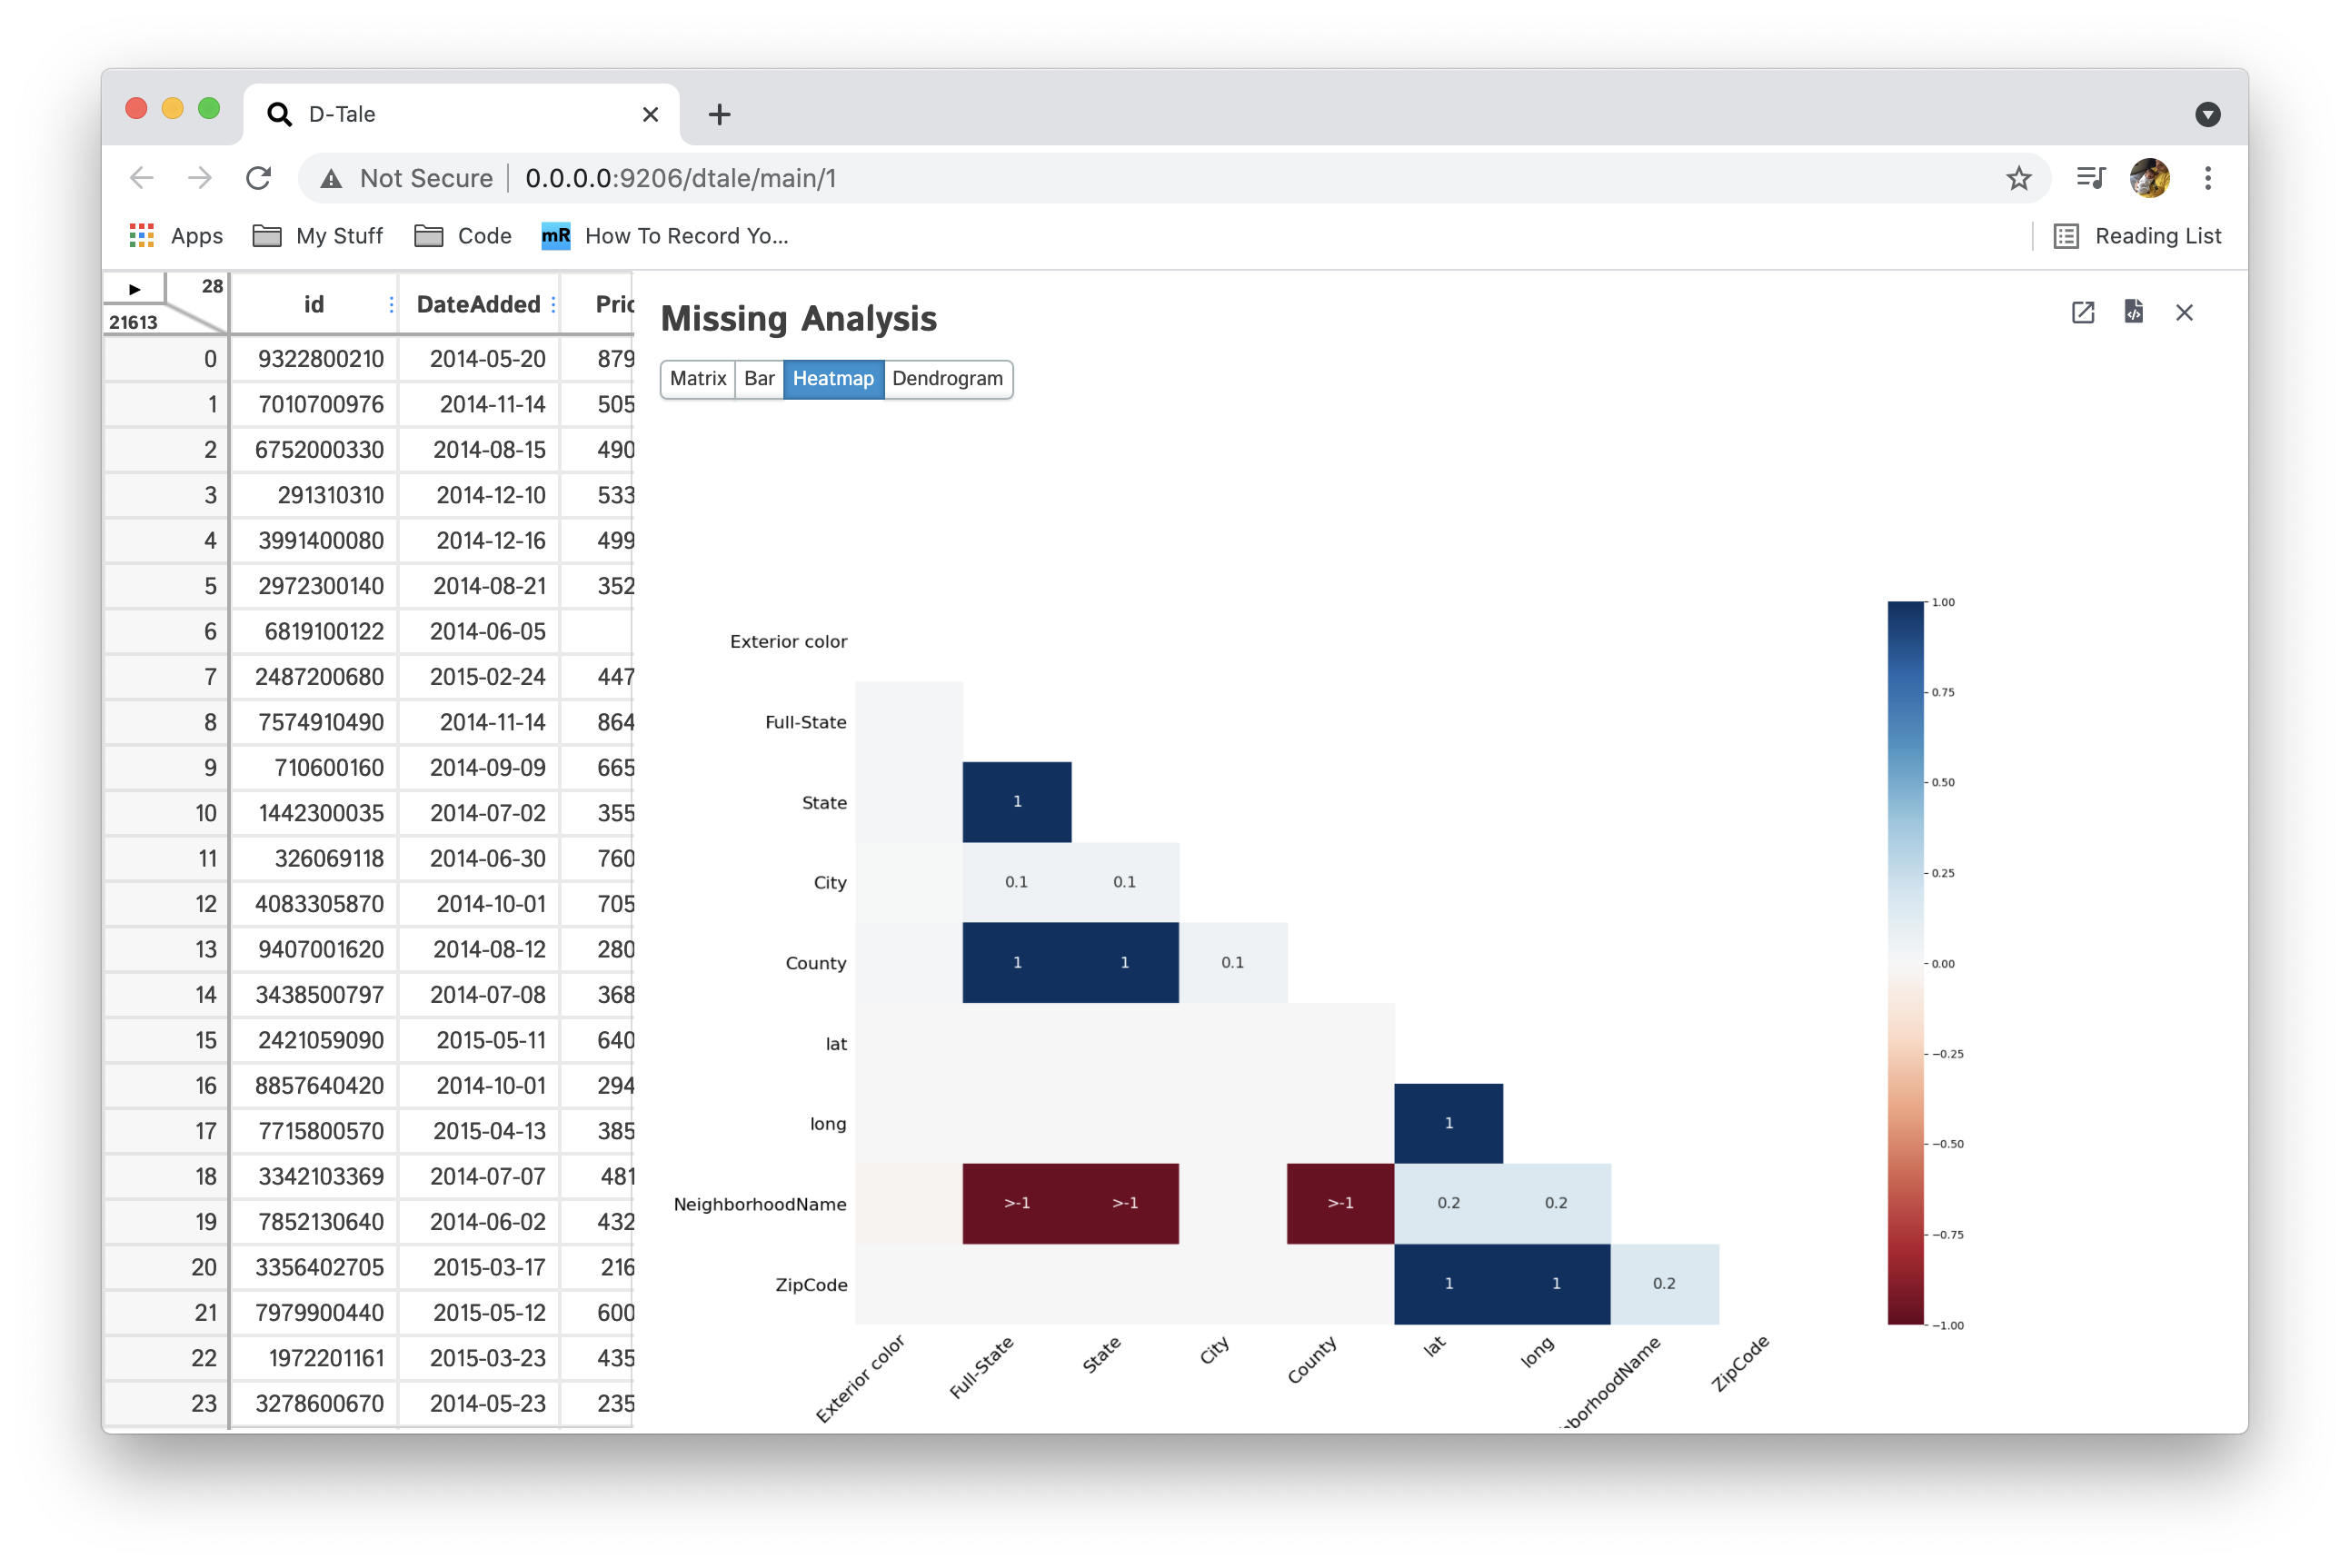 |
| Dendrogram | 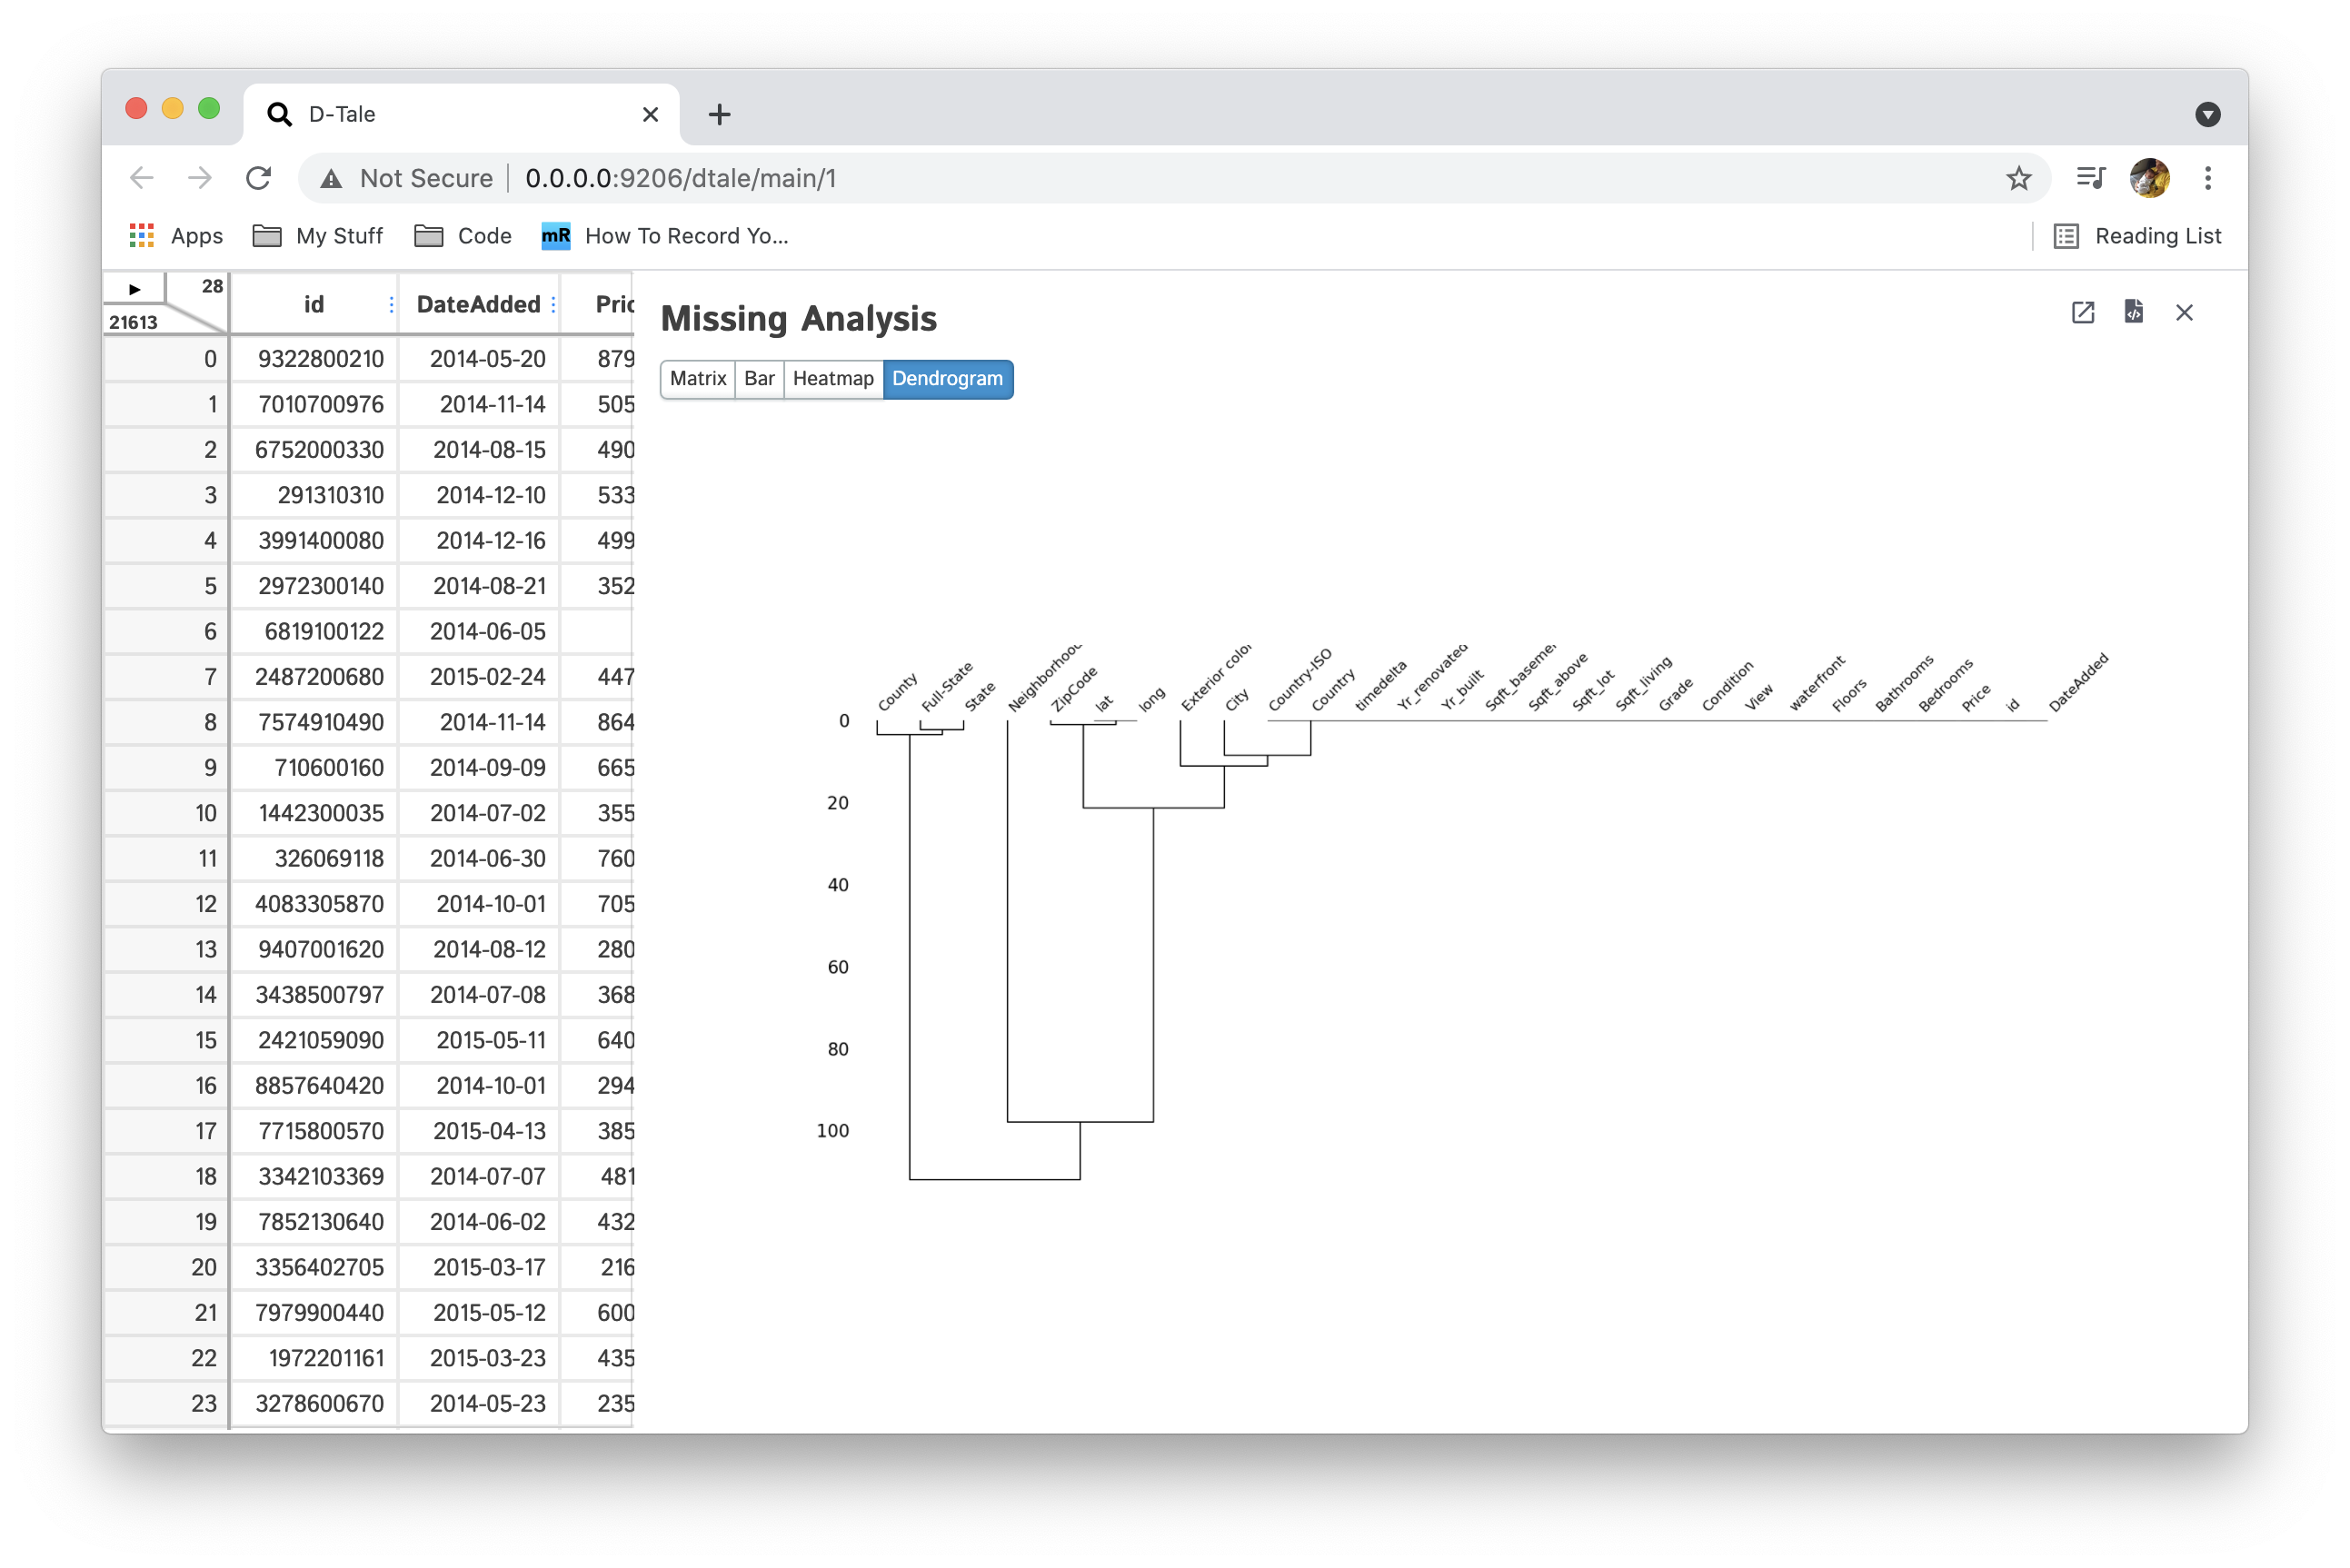 |
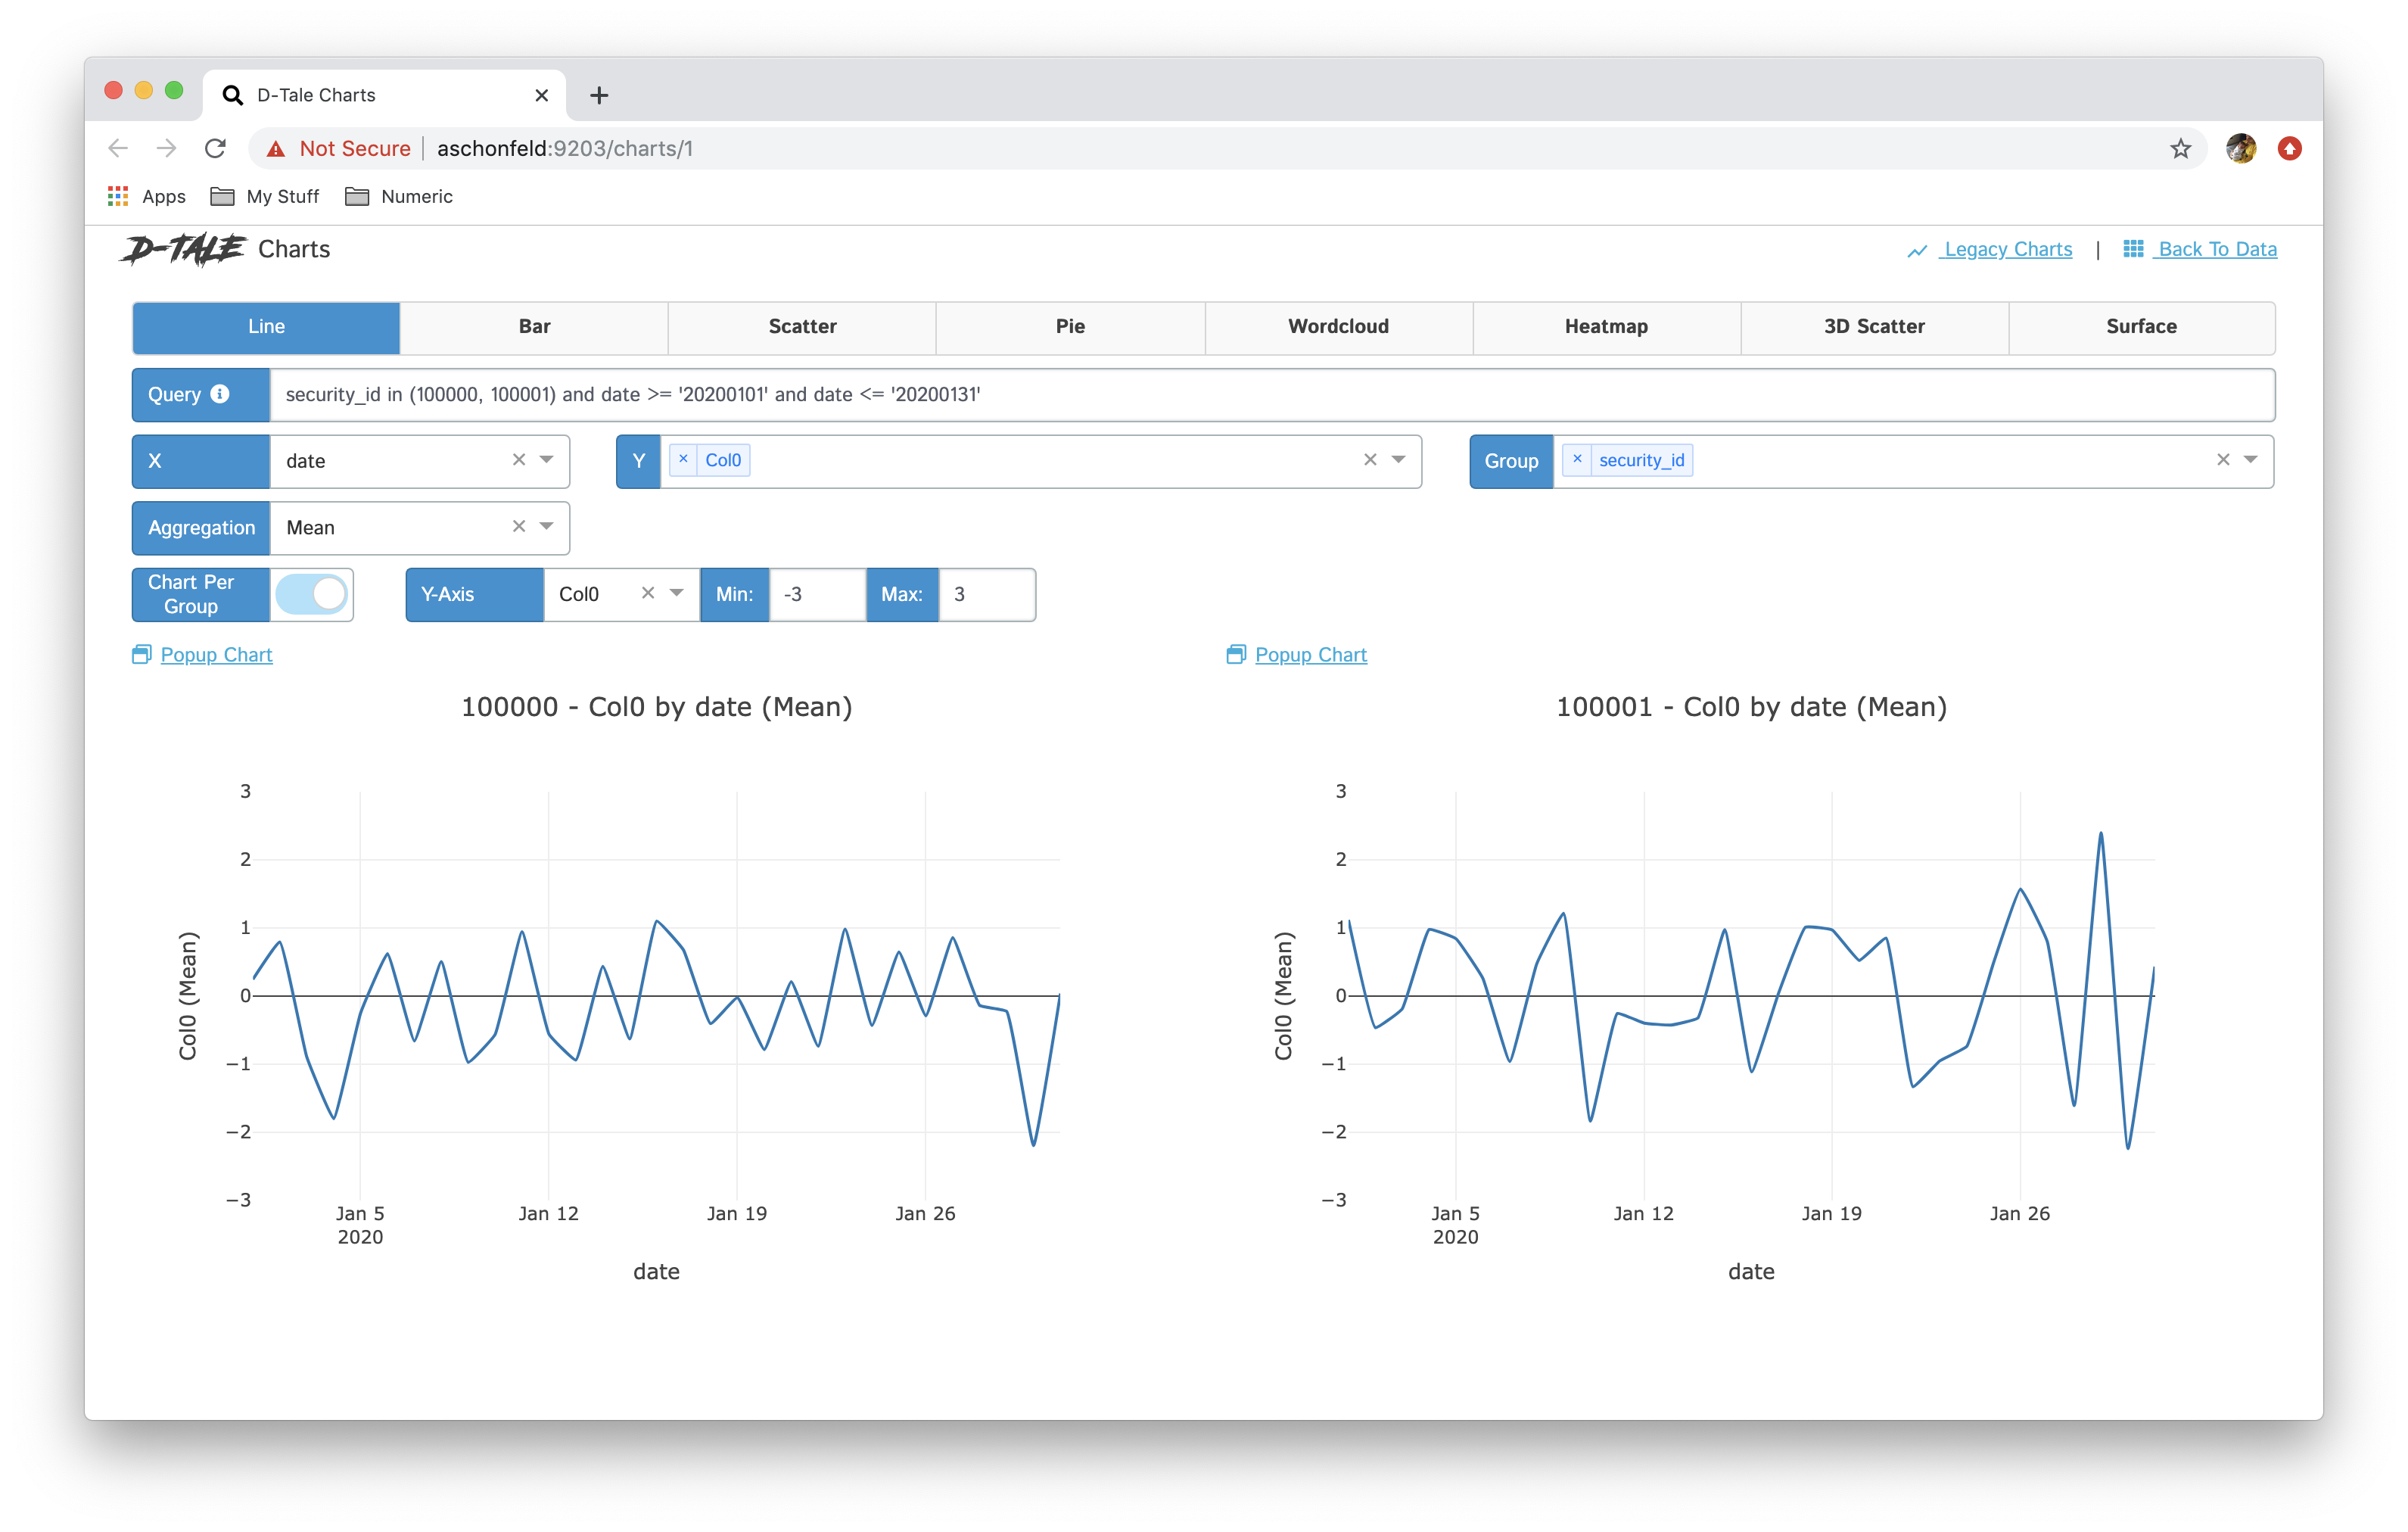
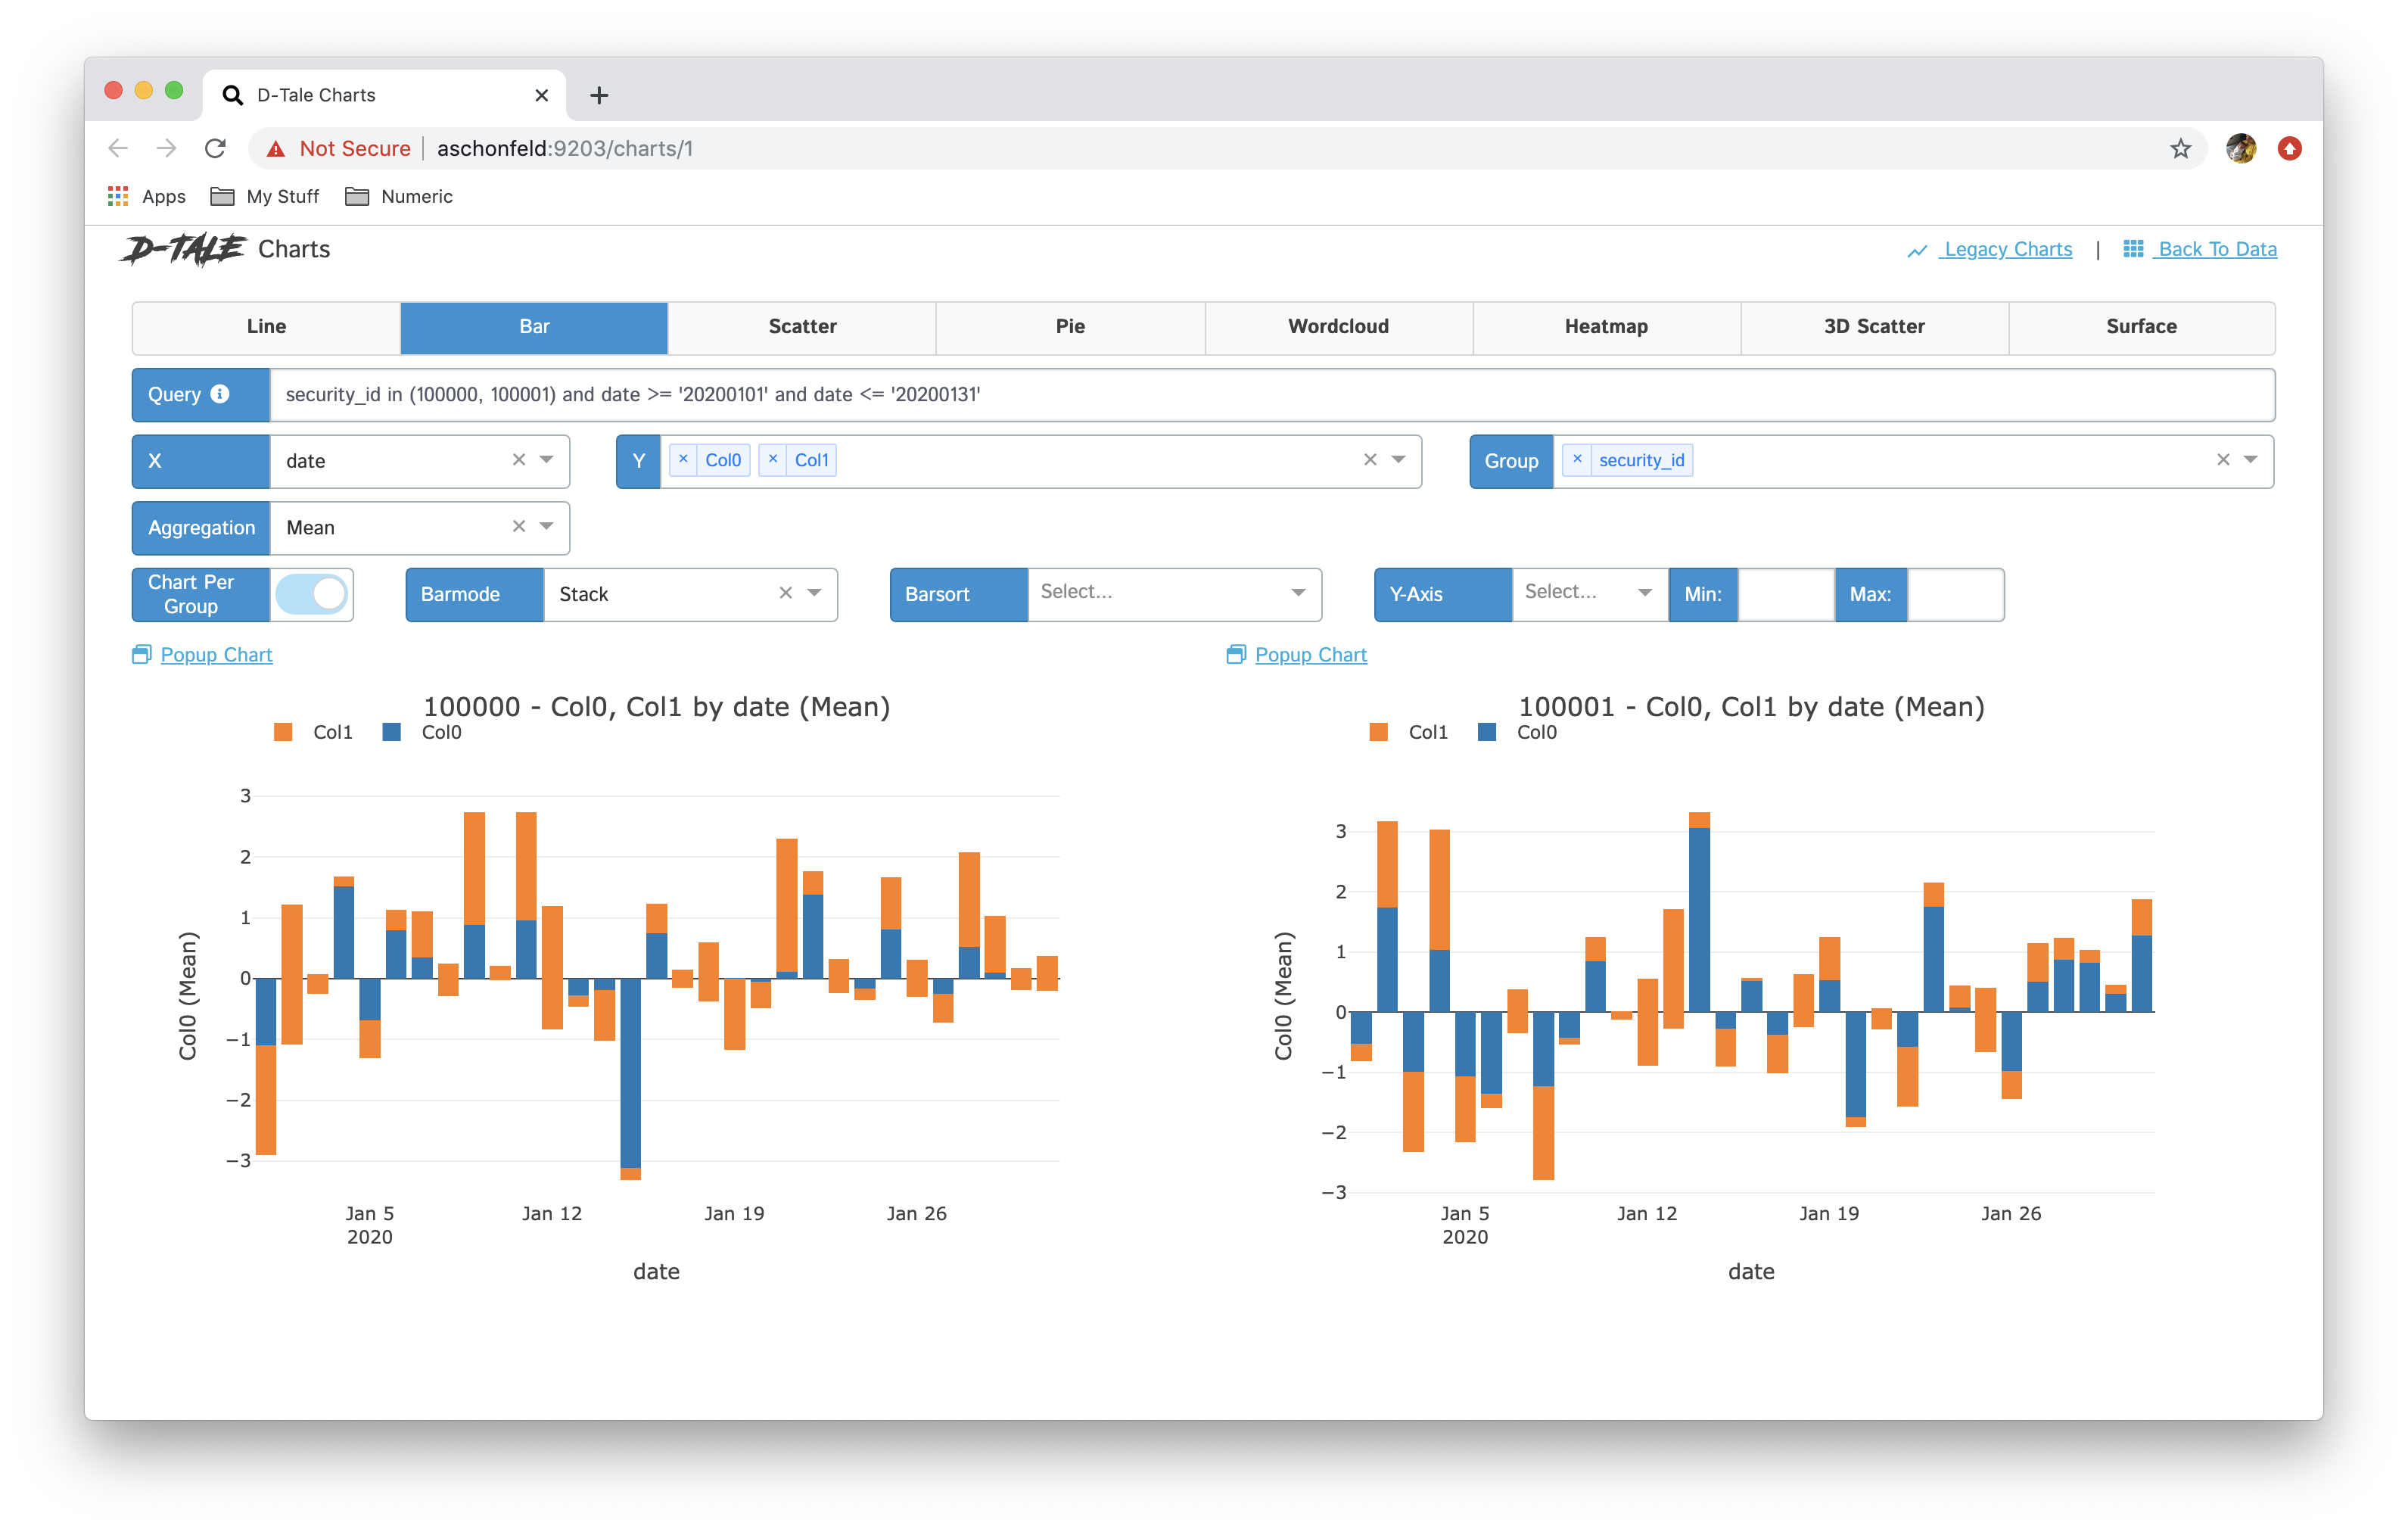
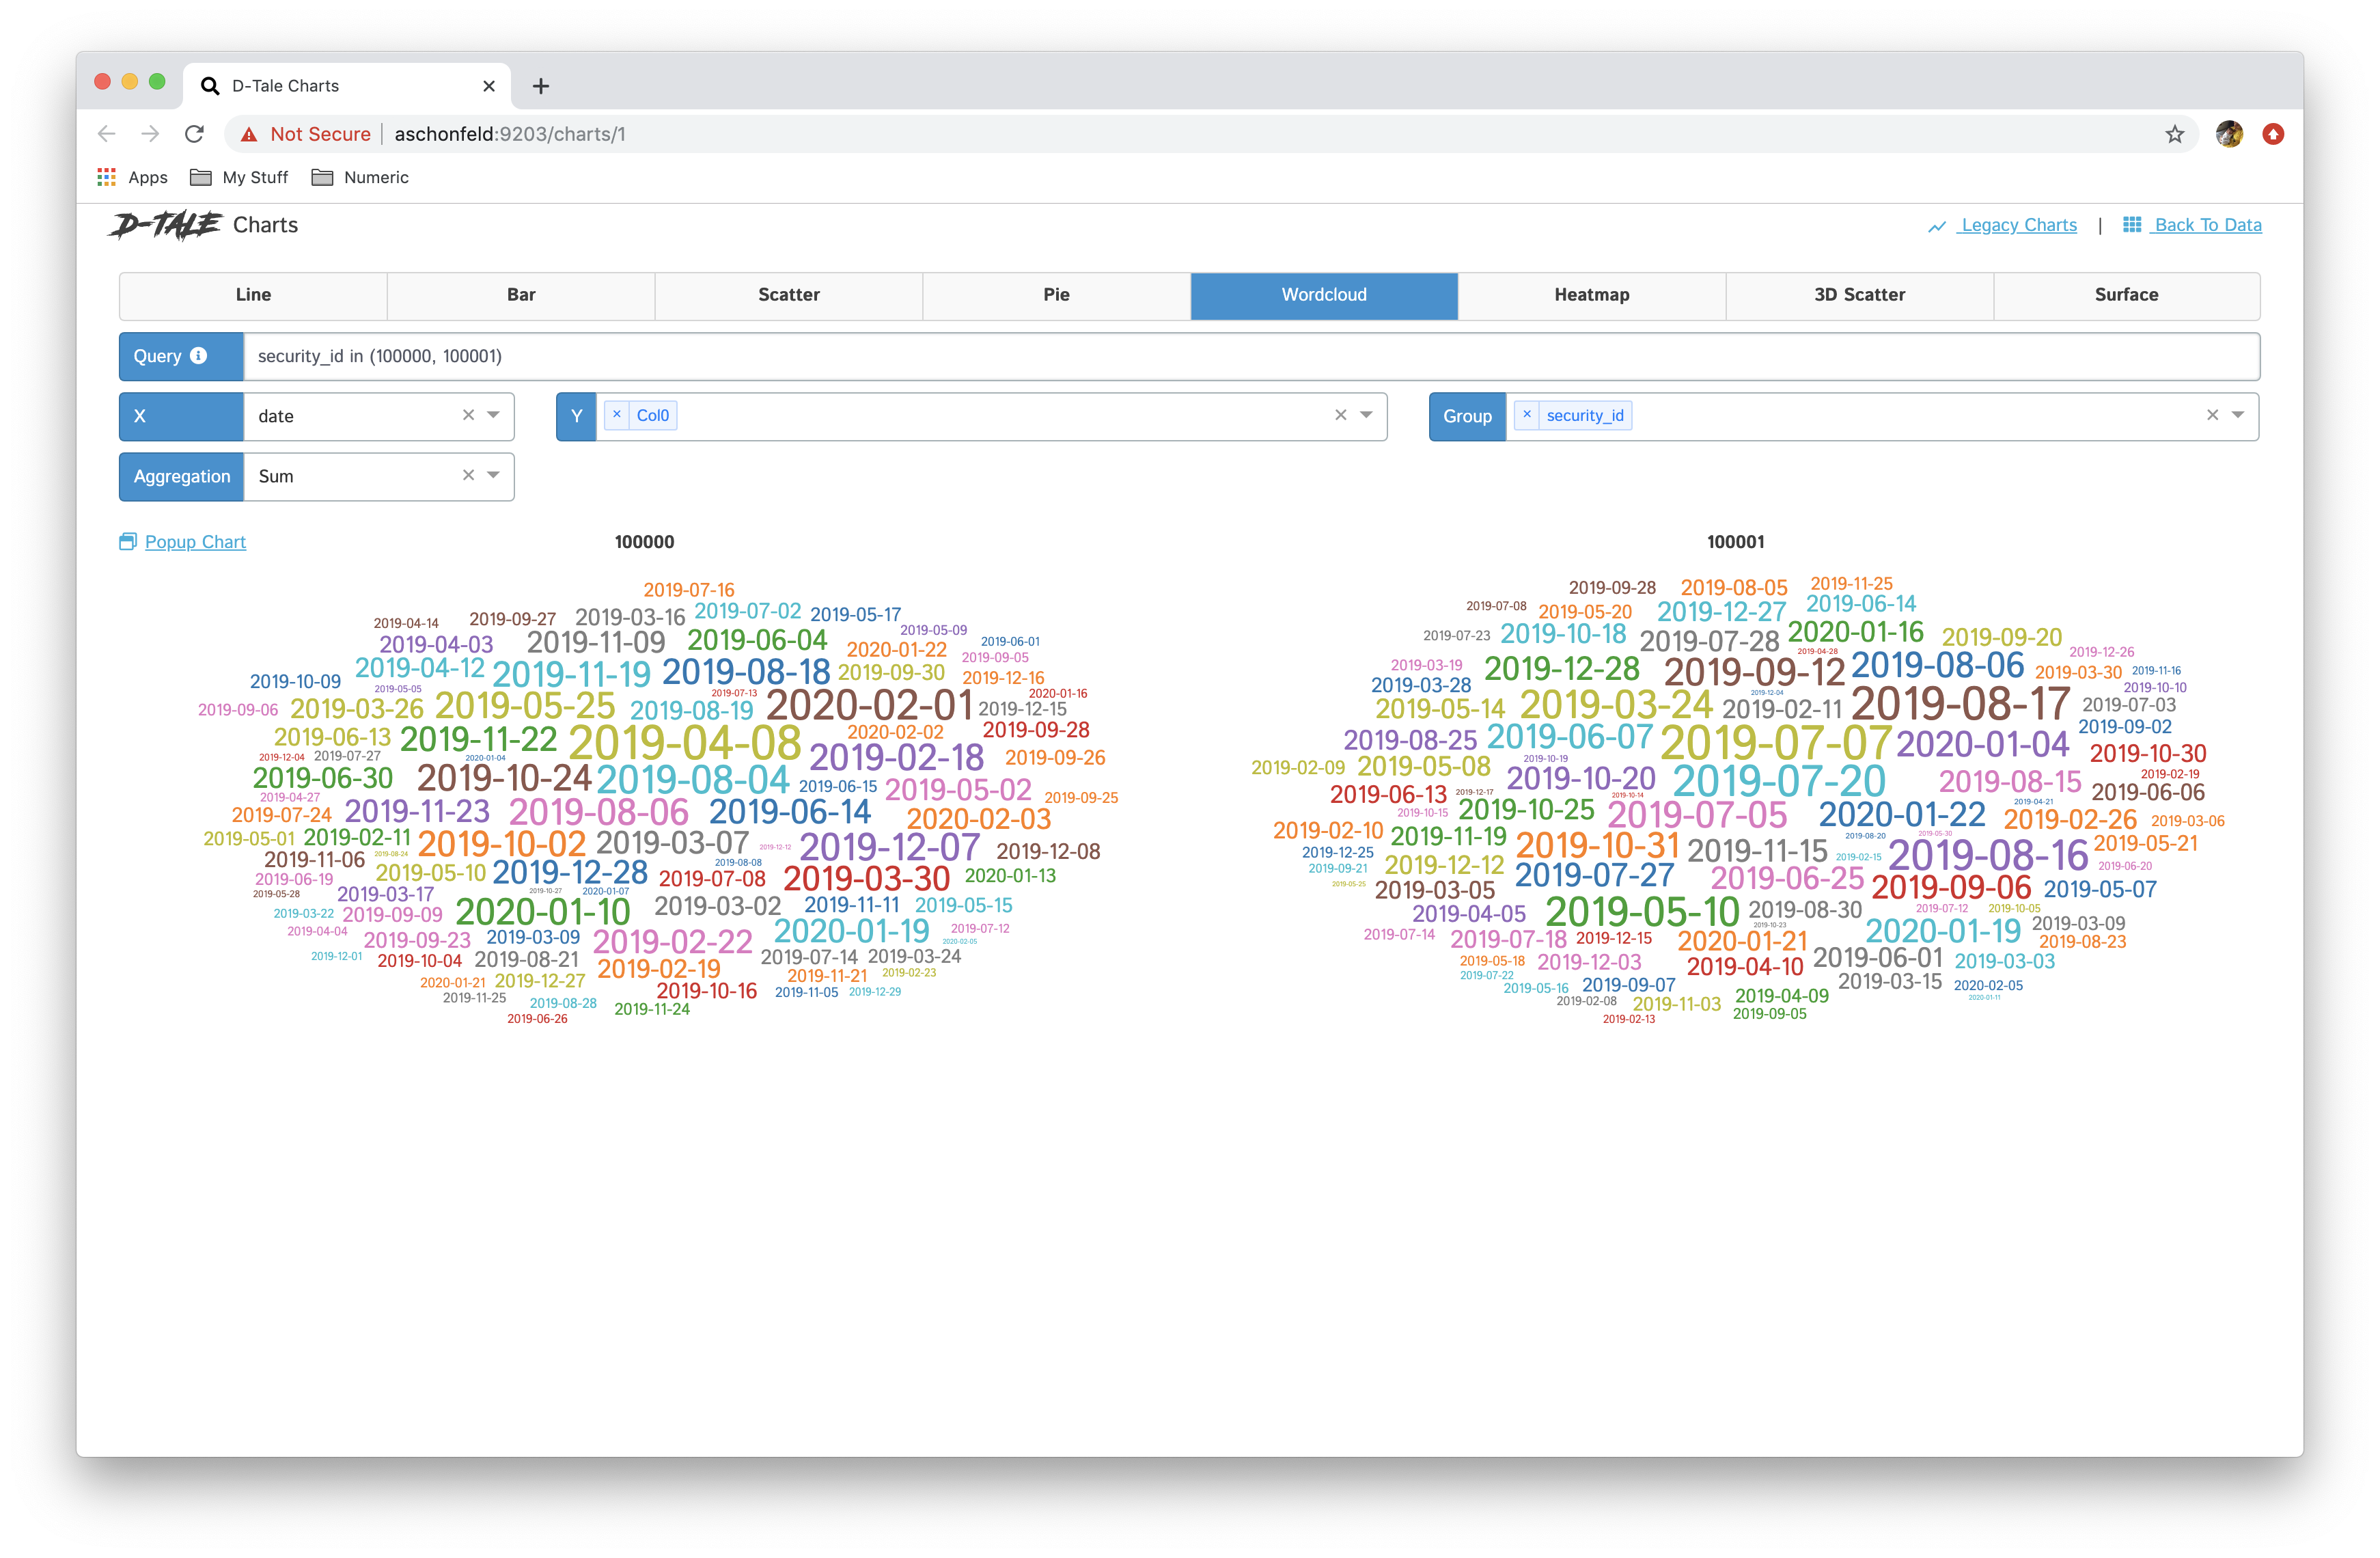
Build custom charts based off your data(powered by plotly/dash).
Here are some examples:
| Chart Type | Chart | Chart per Group |
|---|---|---|
| line | 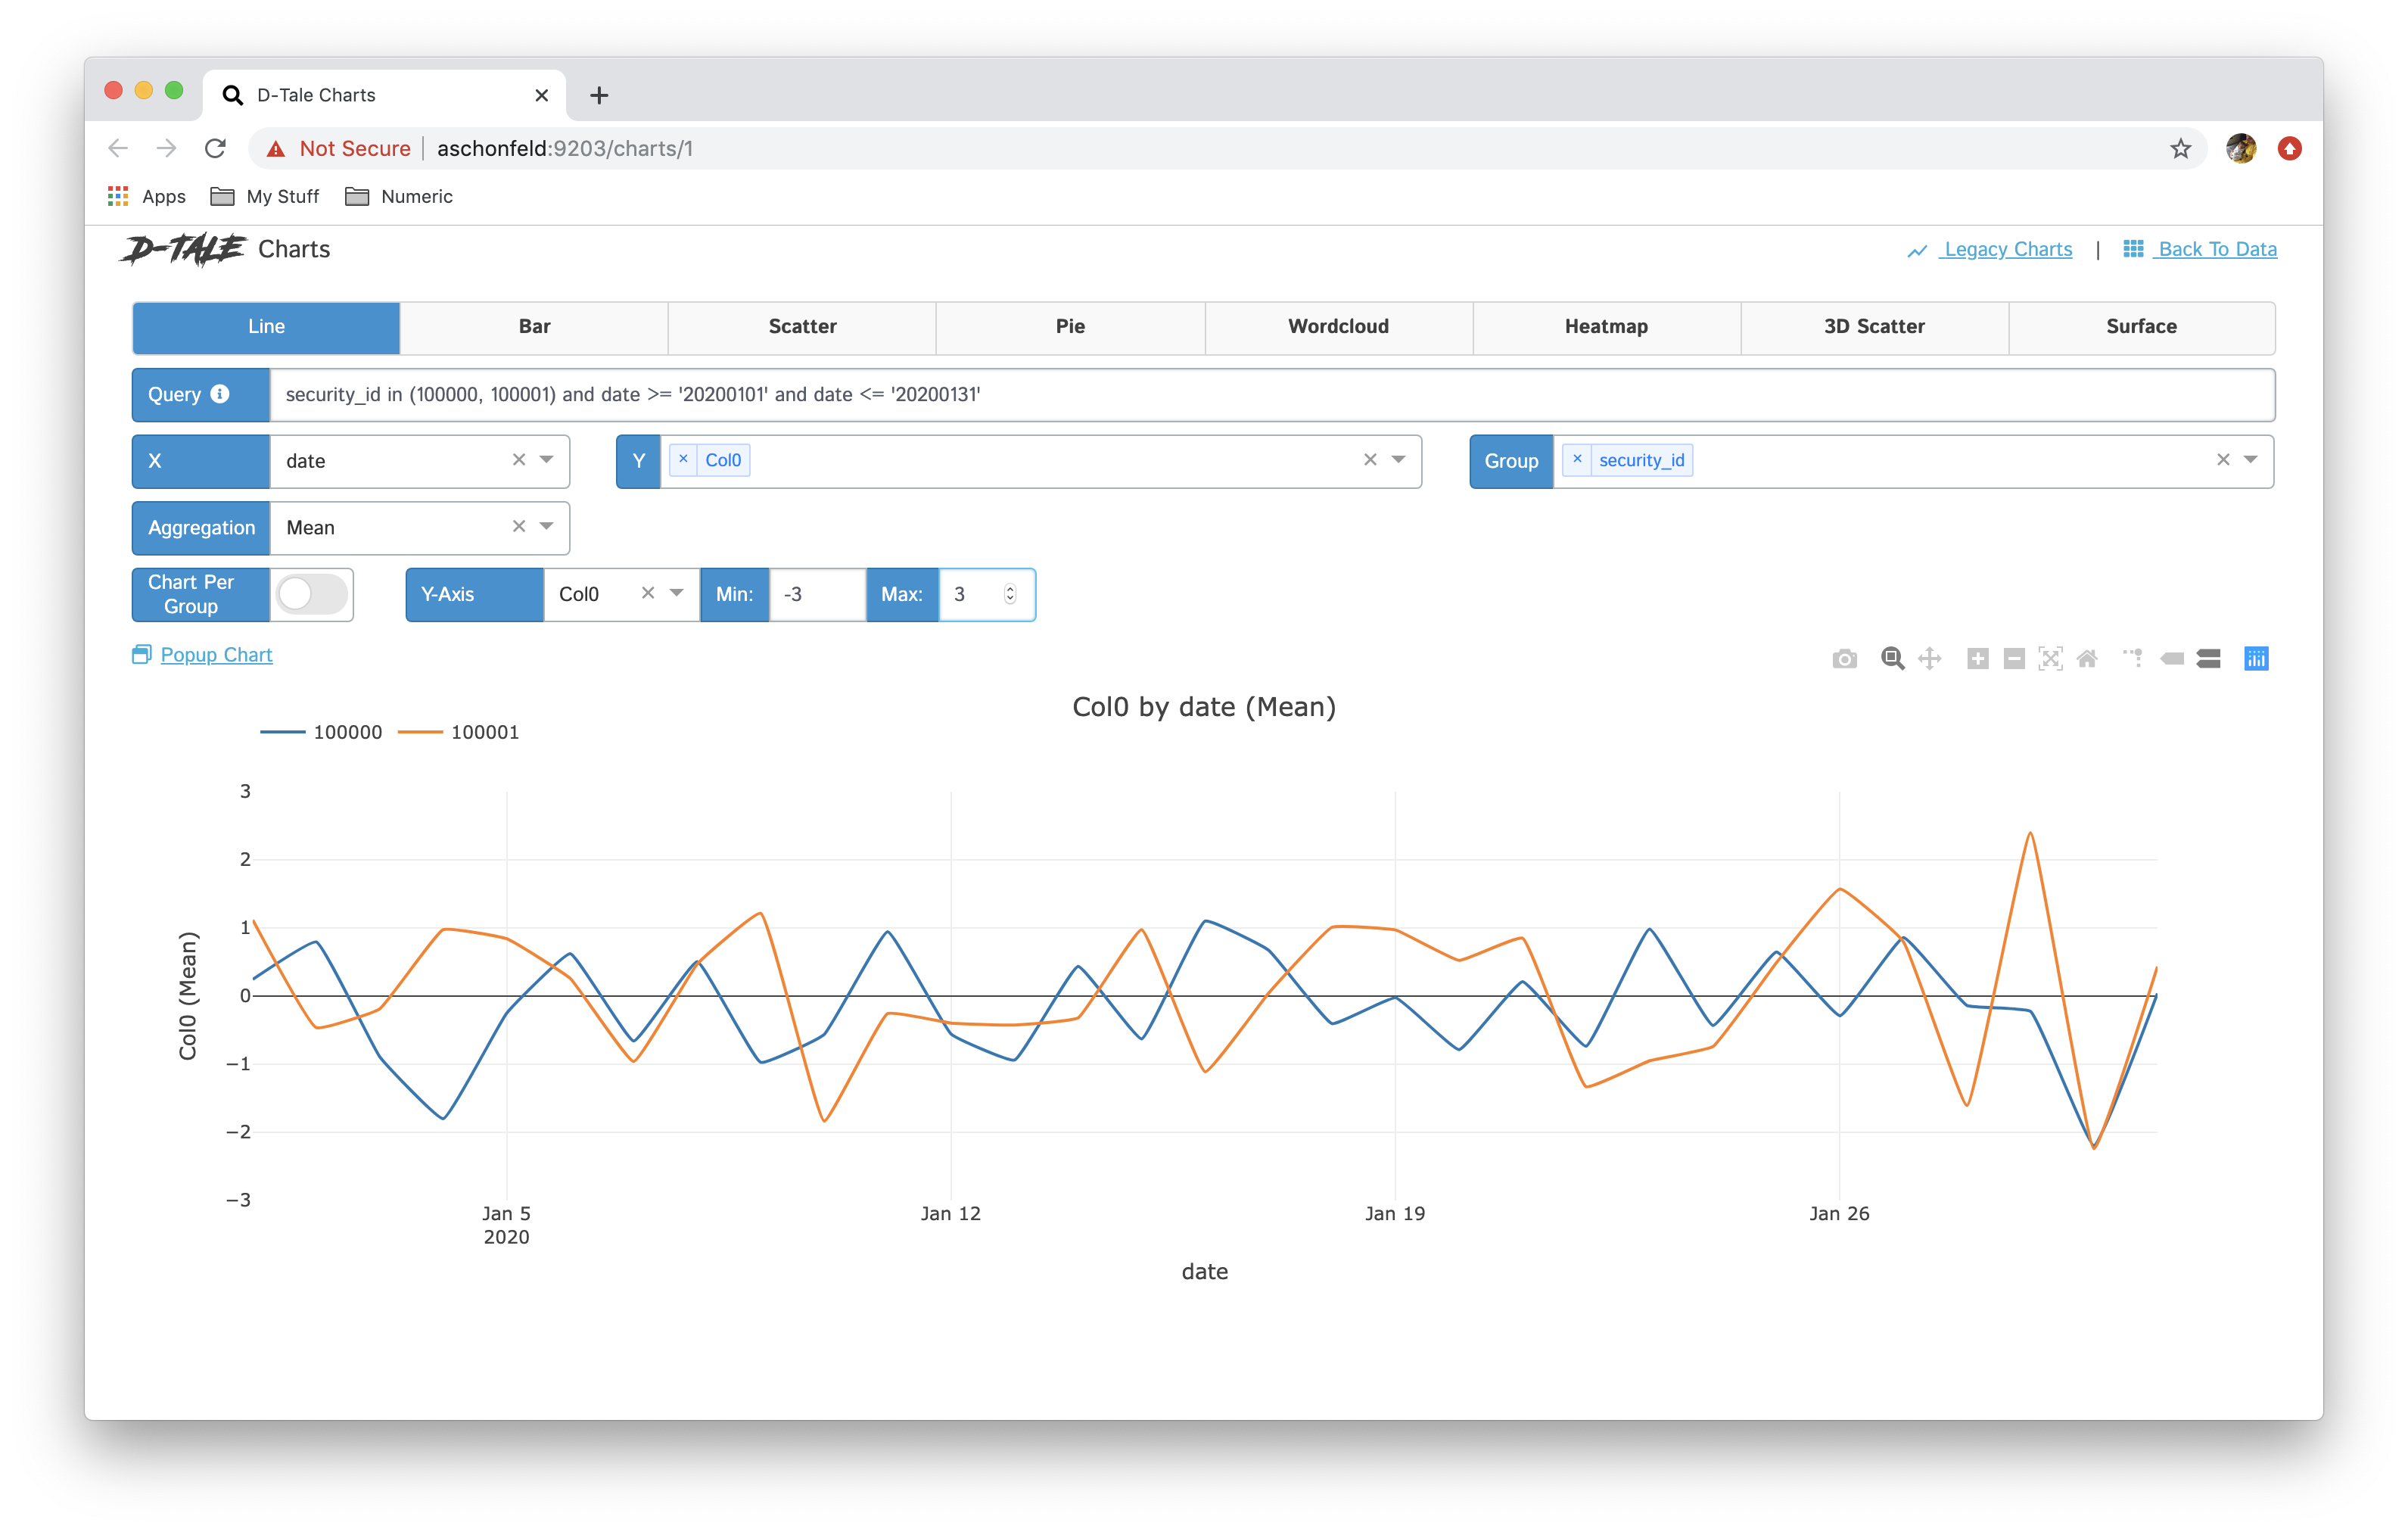 |
 |
| bar | 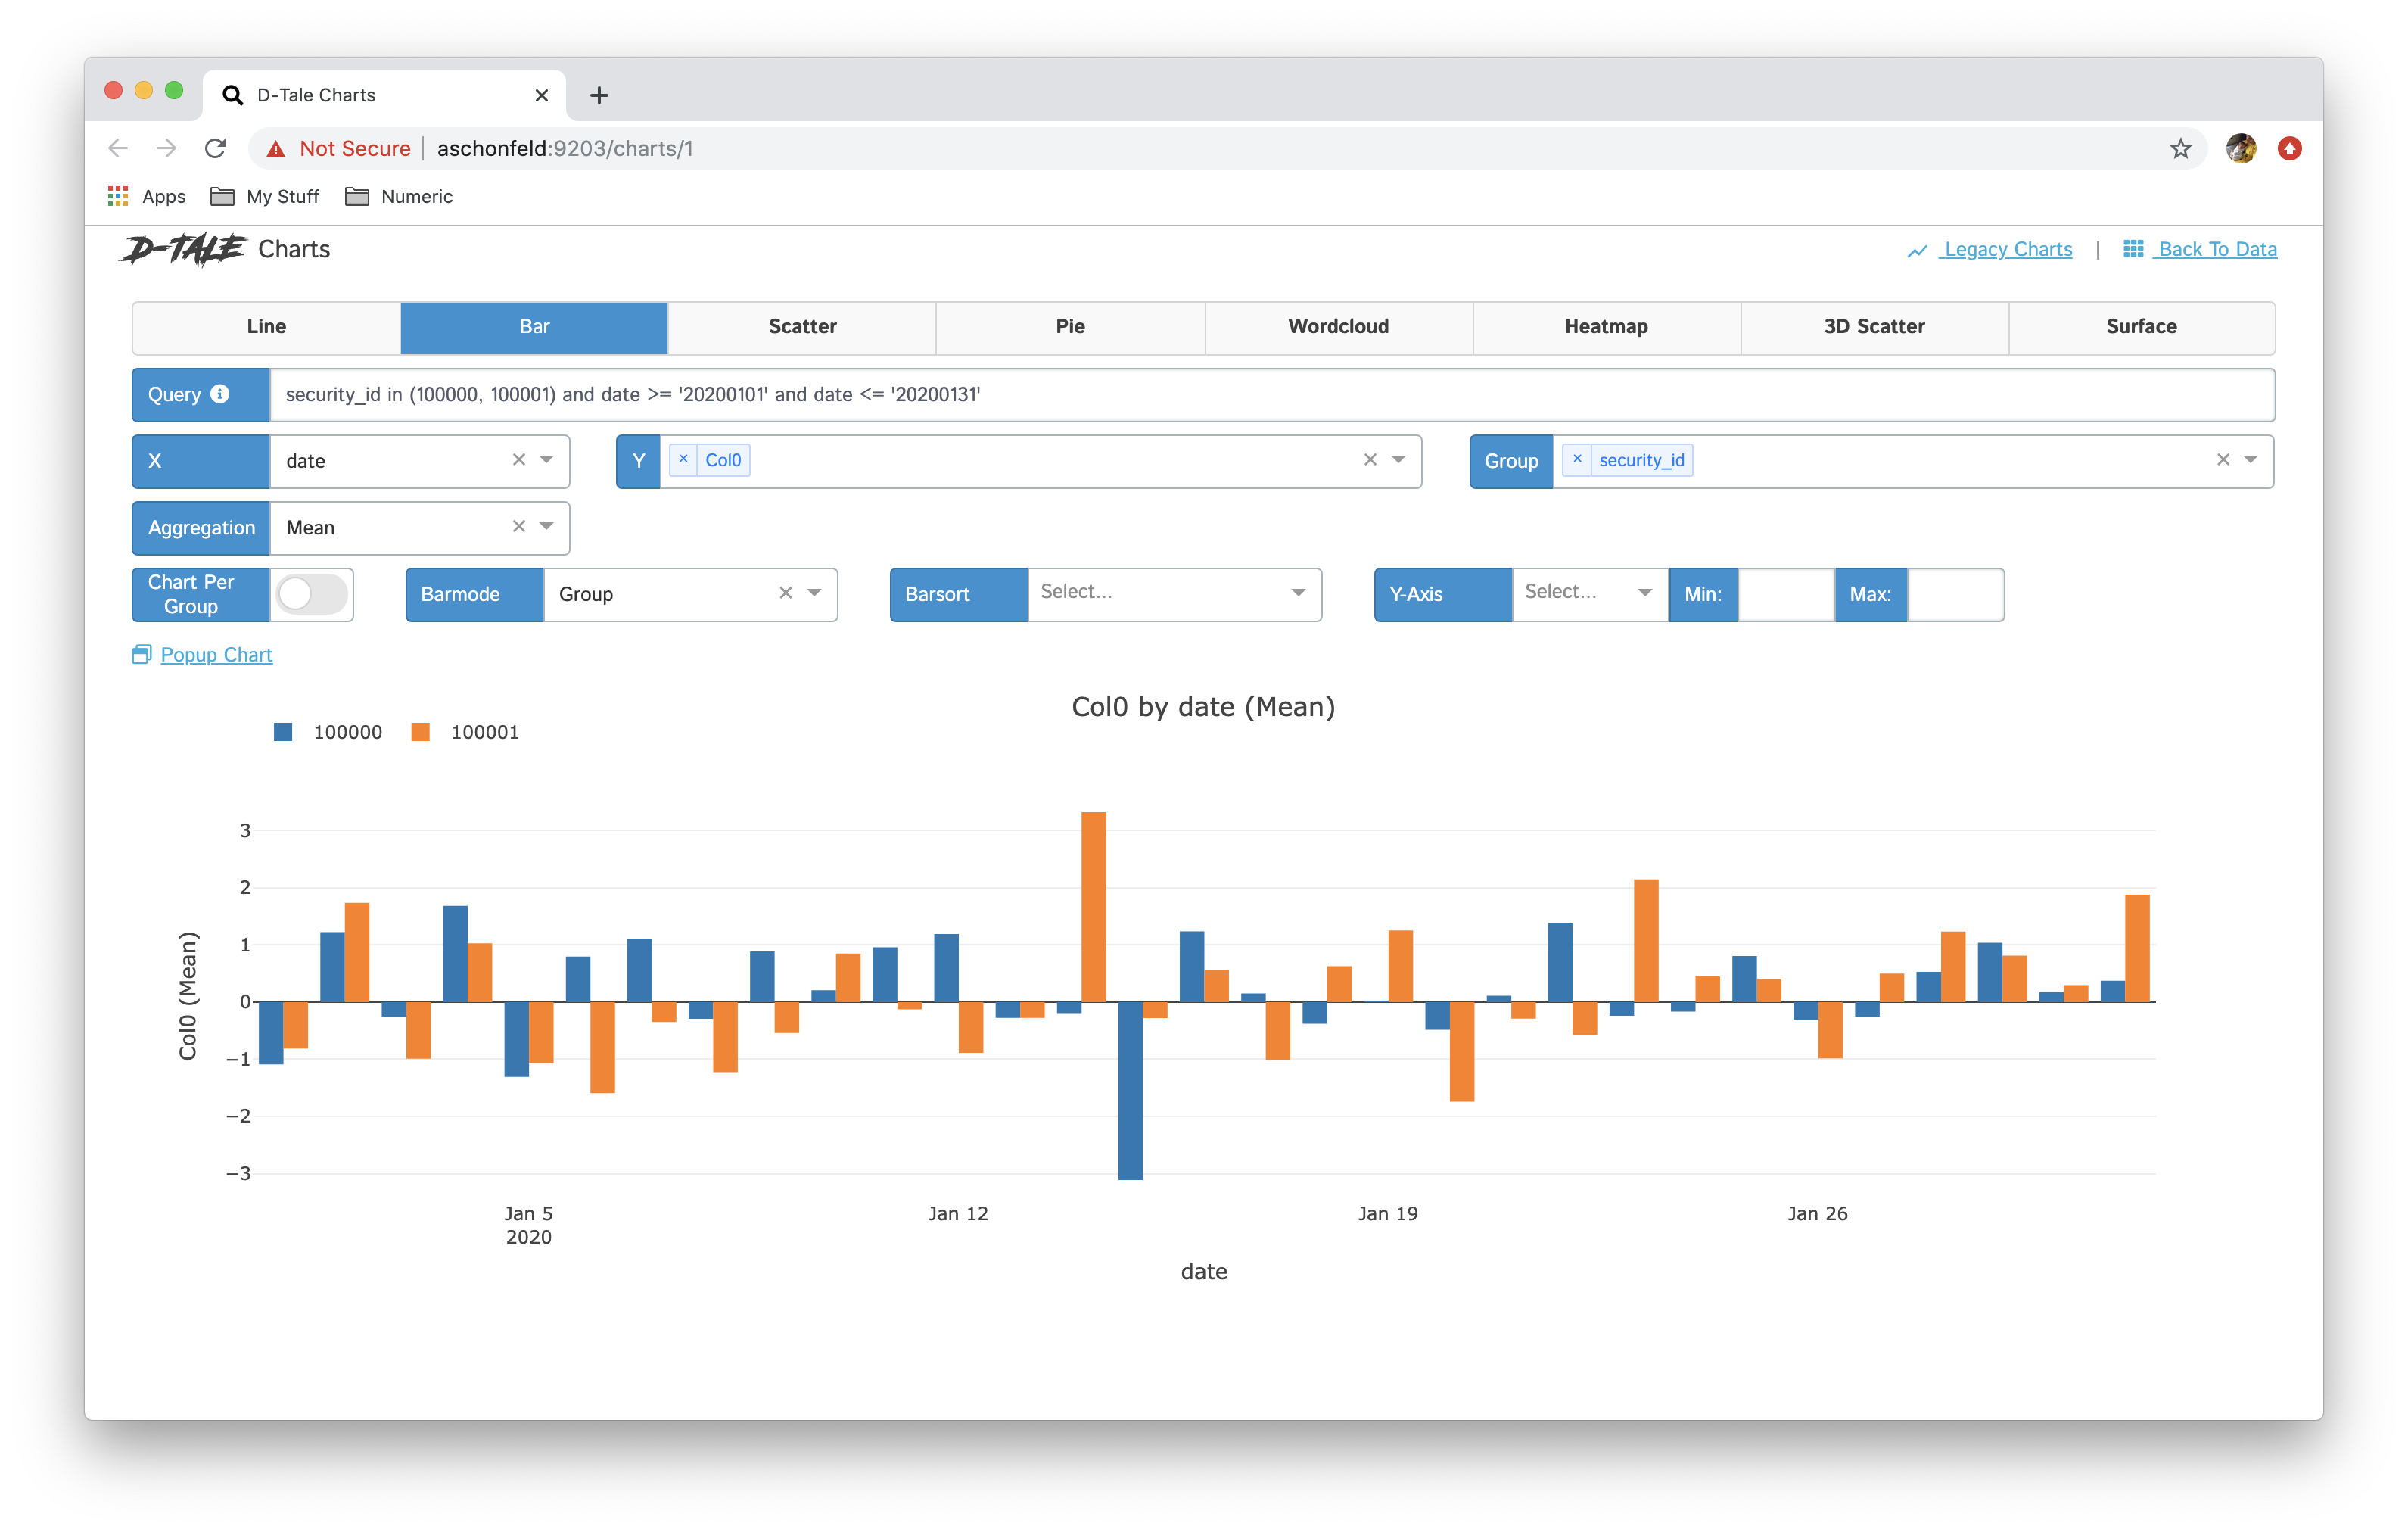 |
 |
| stacked | 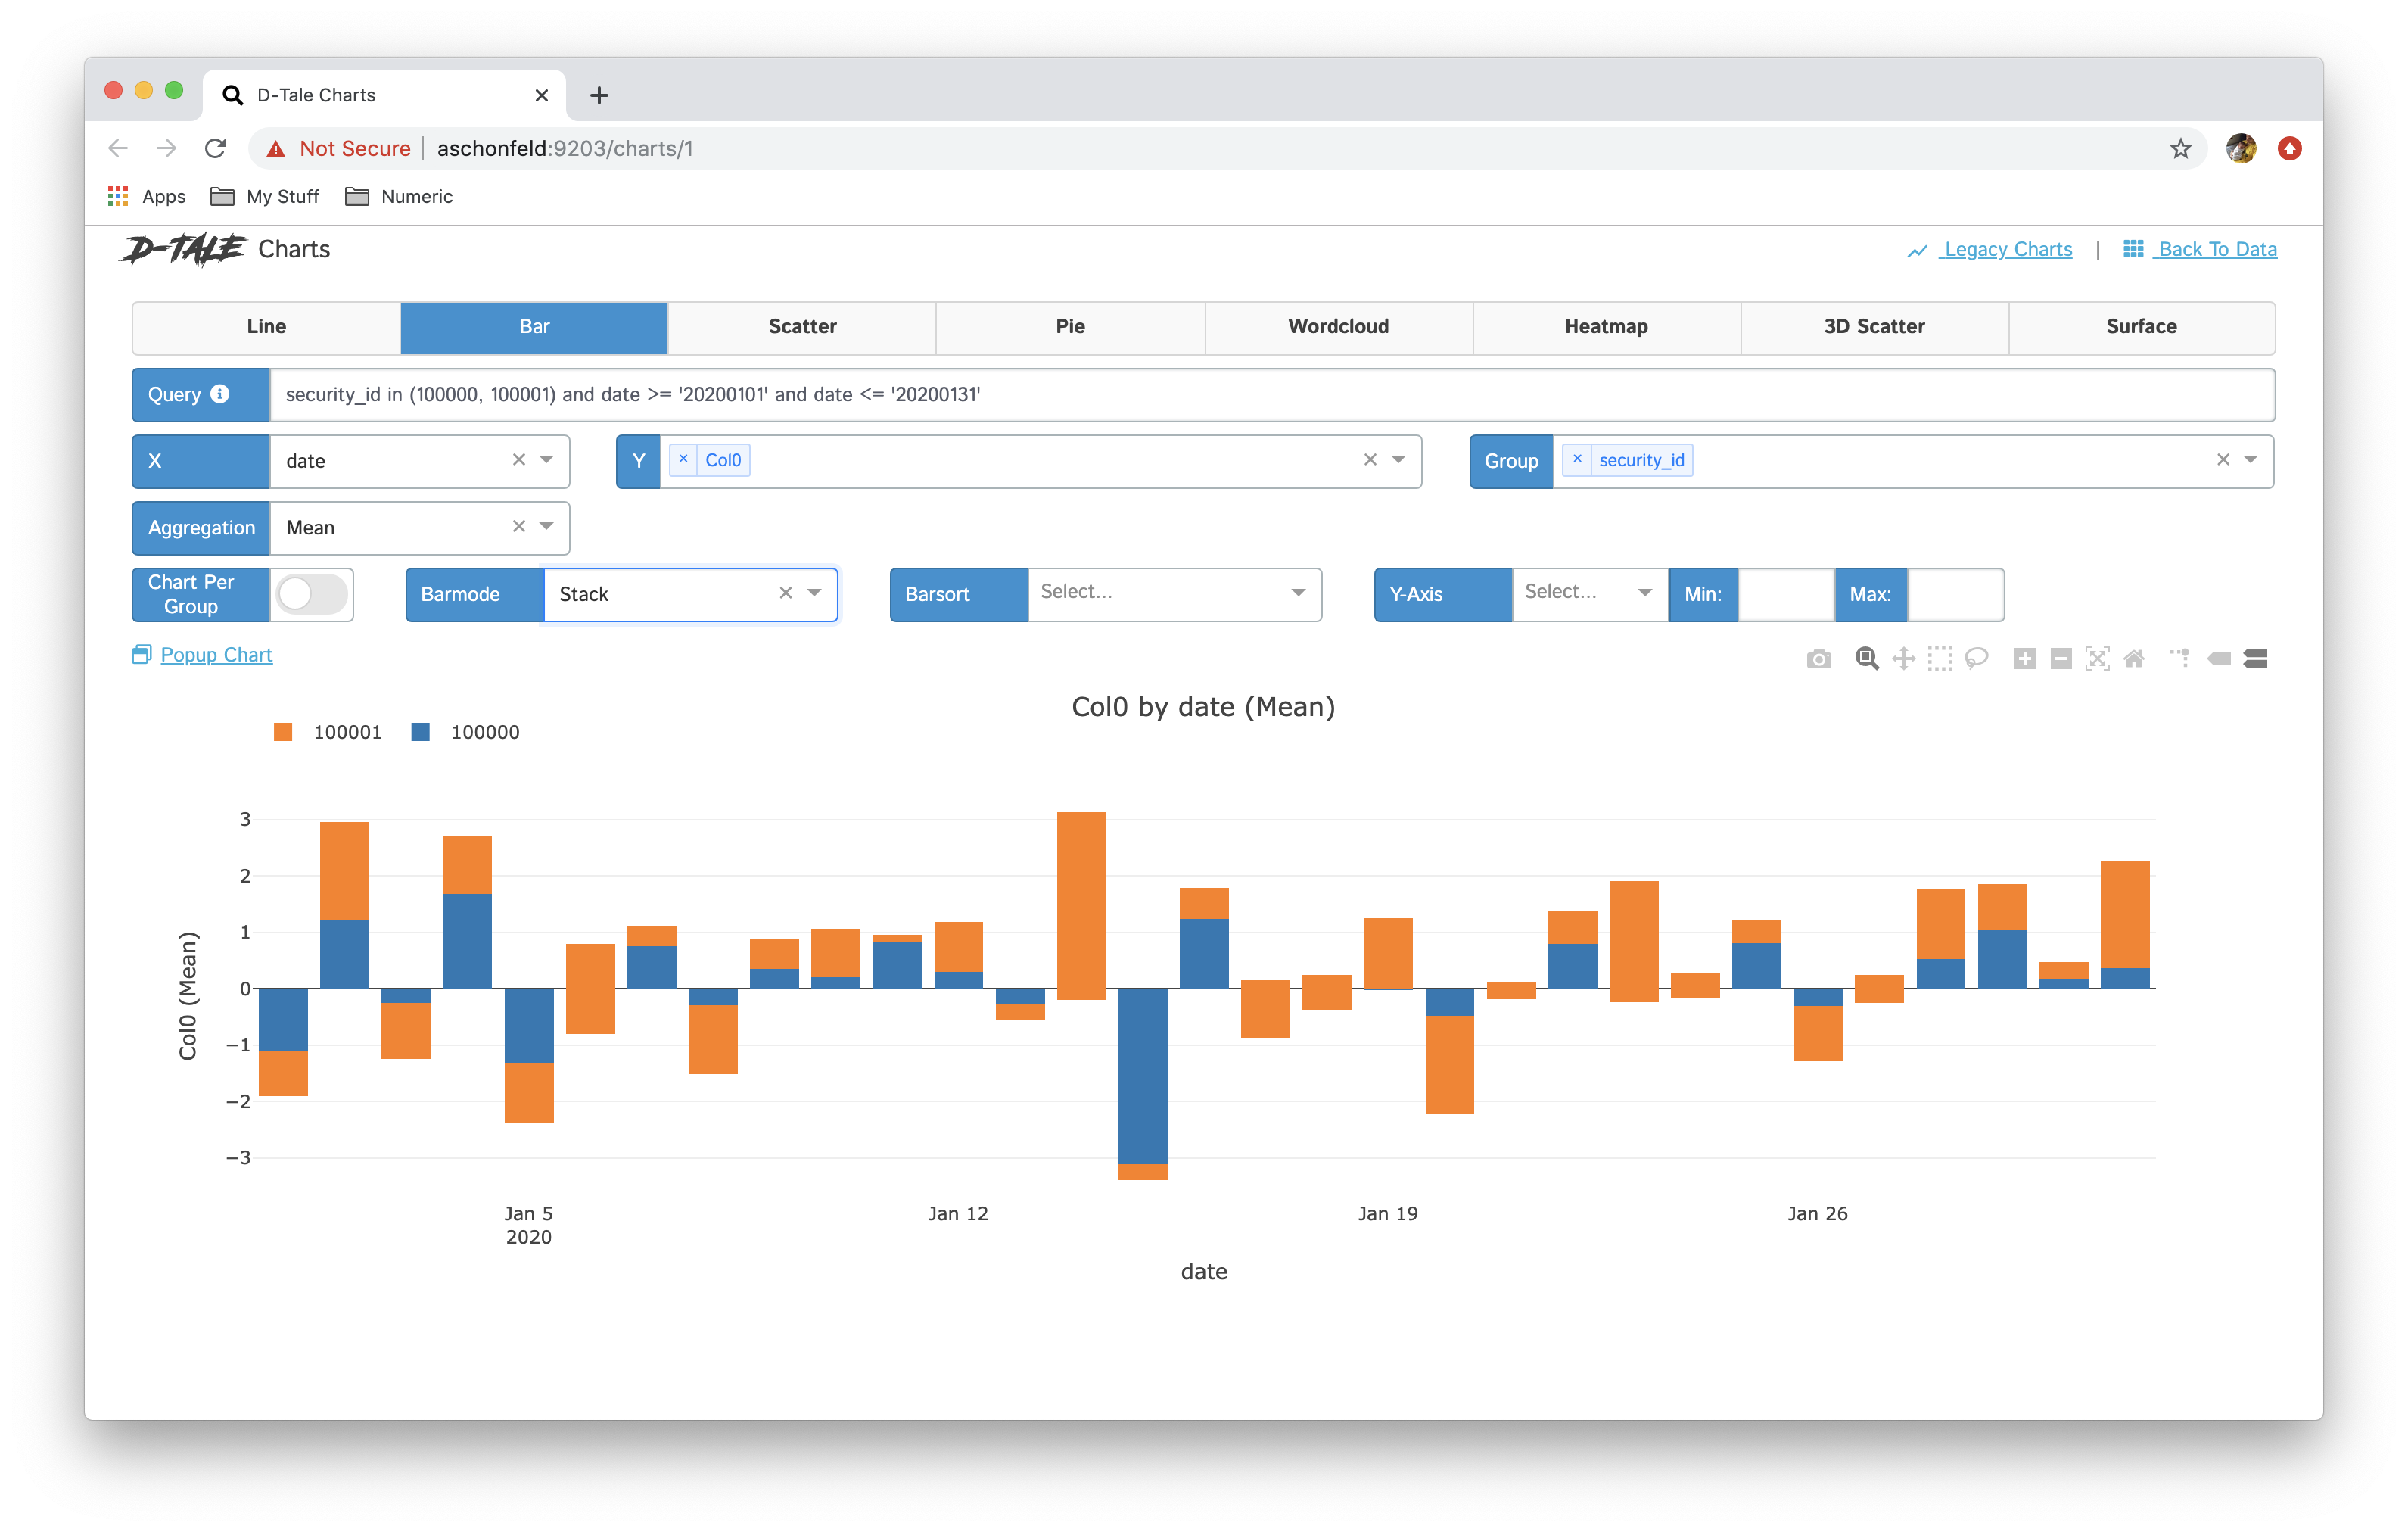 |
 |
| pie | 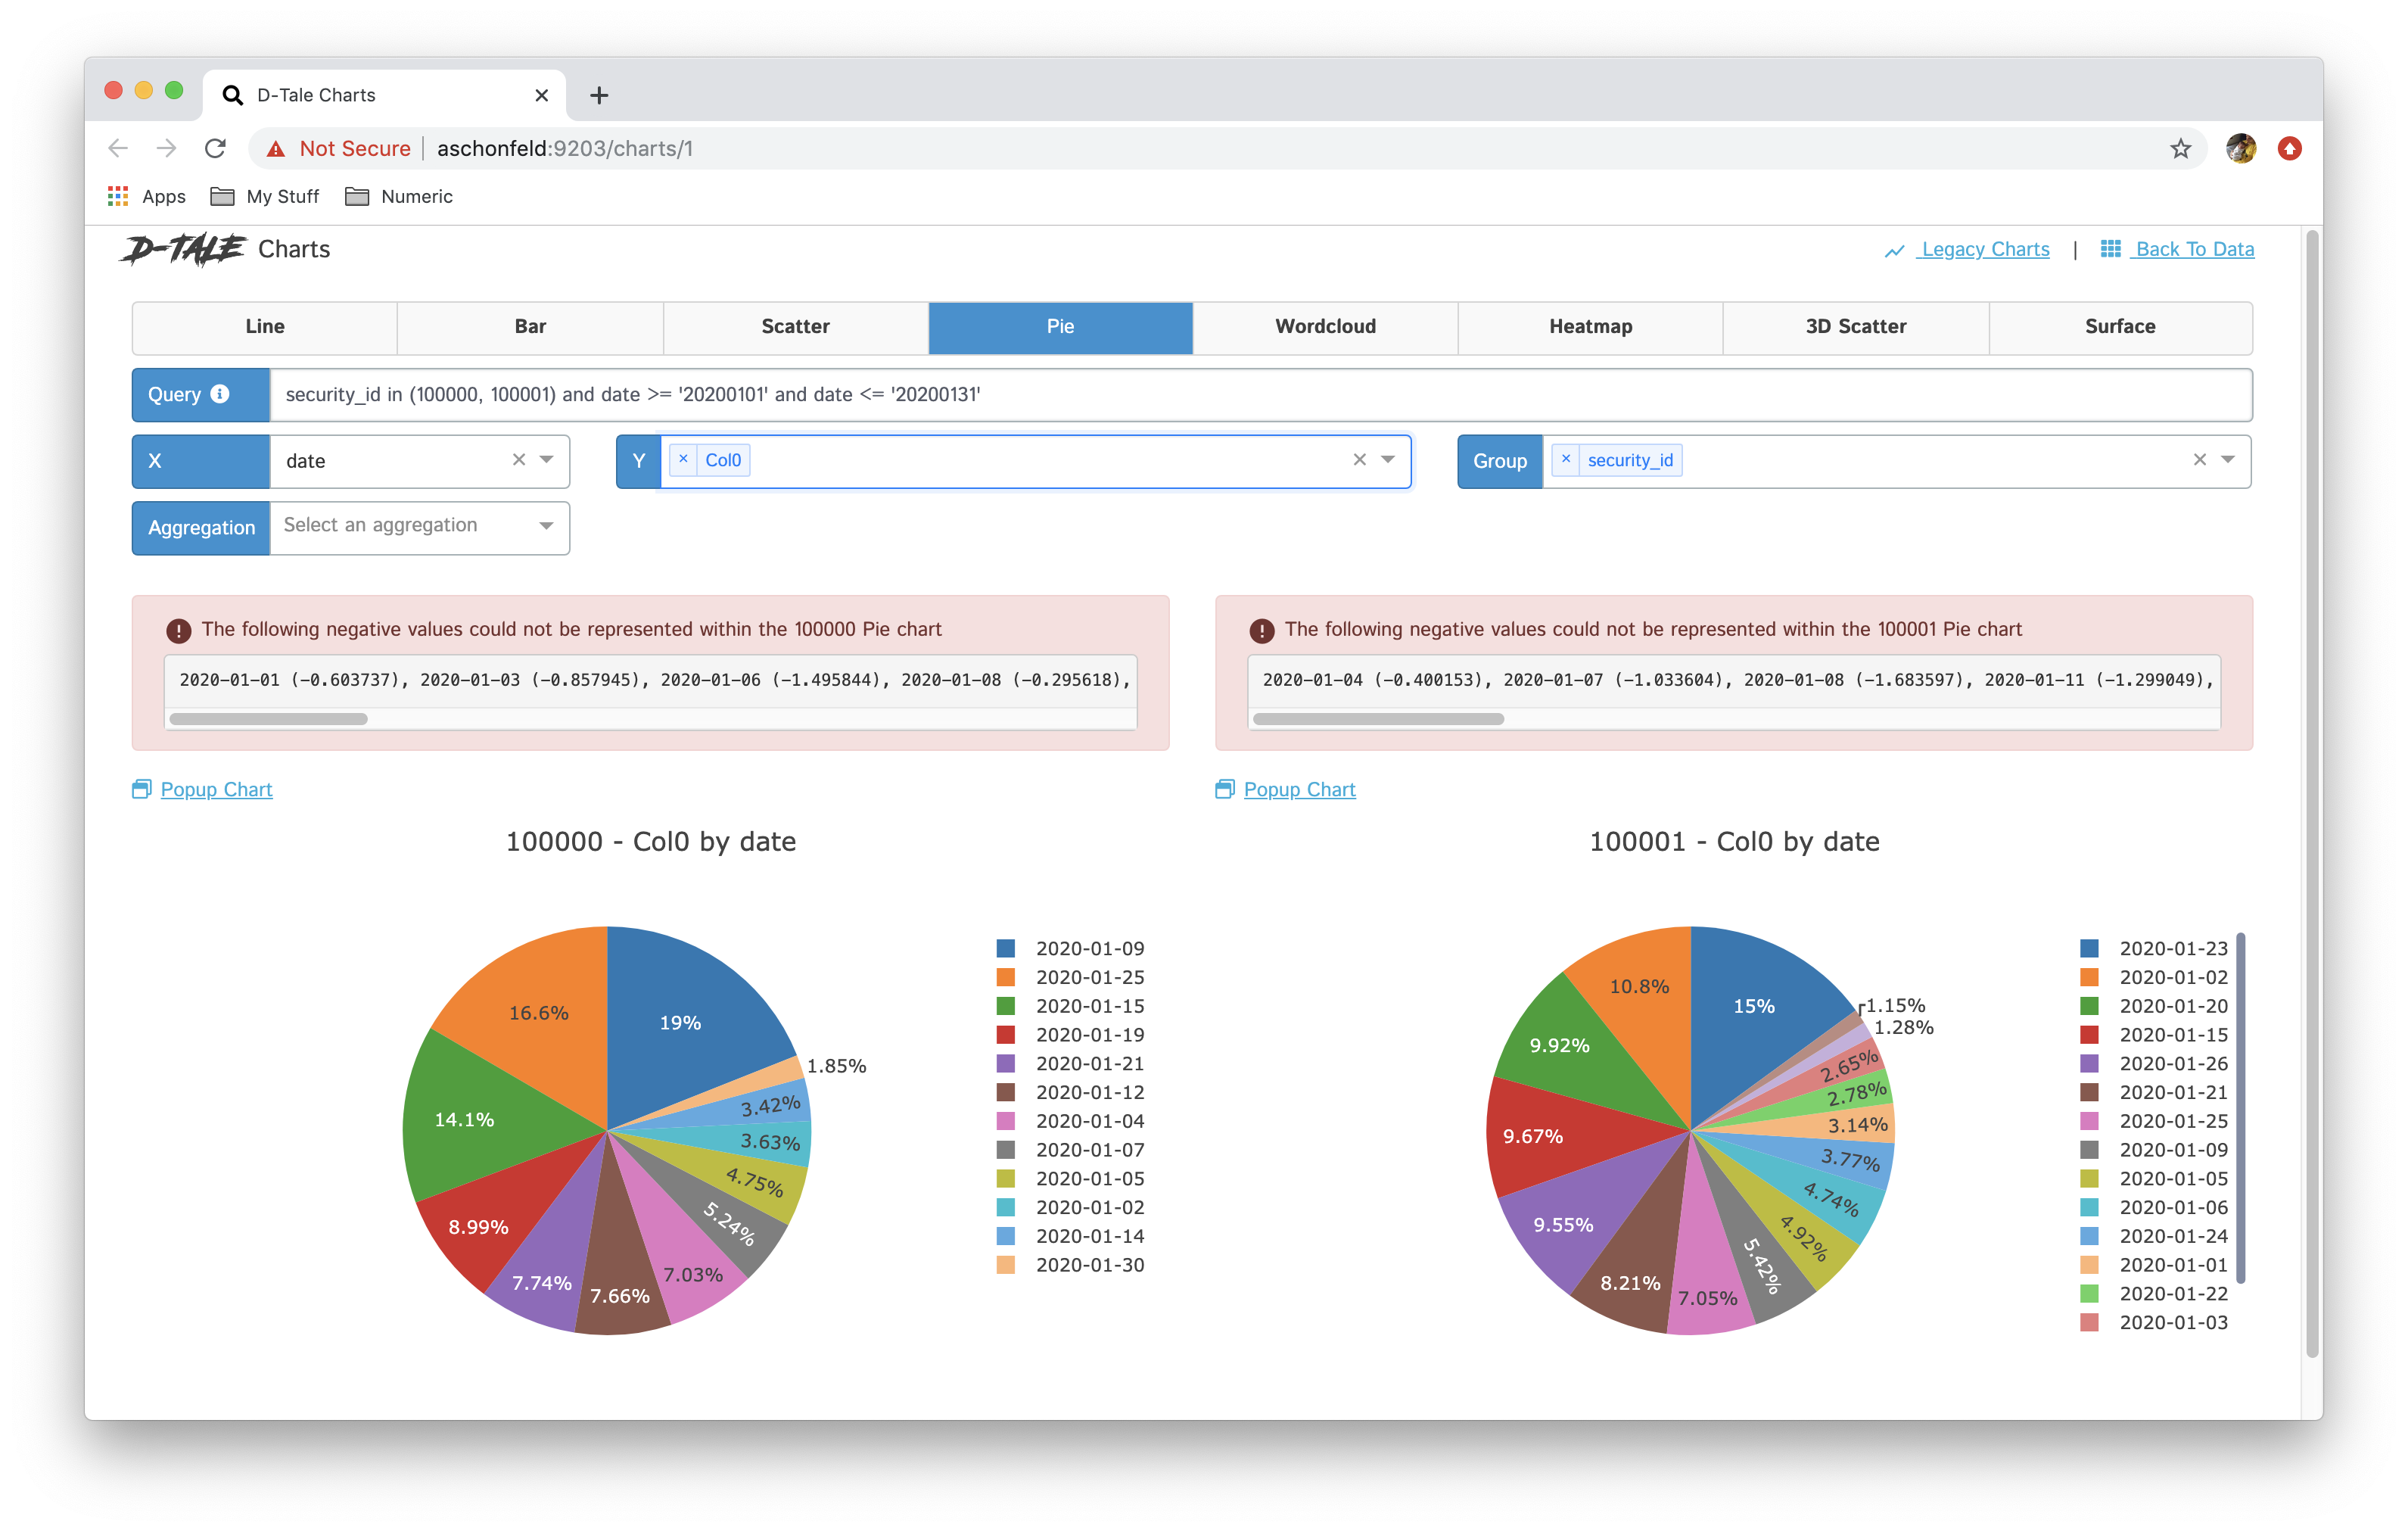 |
|
| wordcloud | 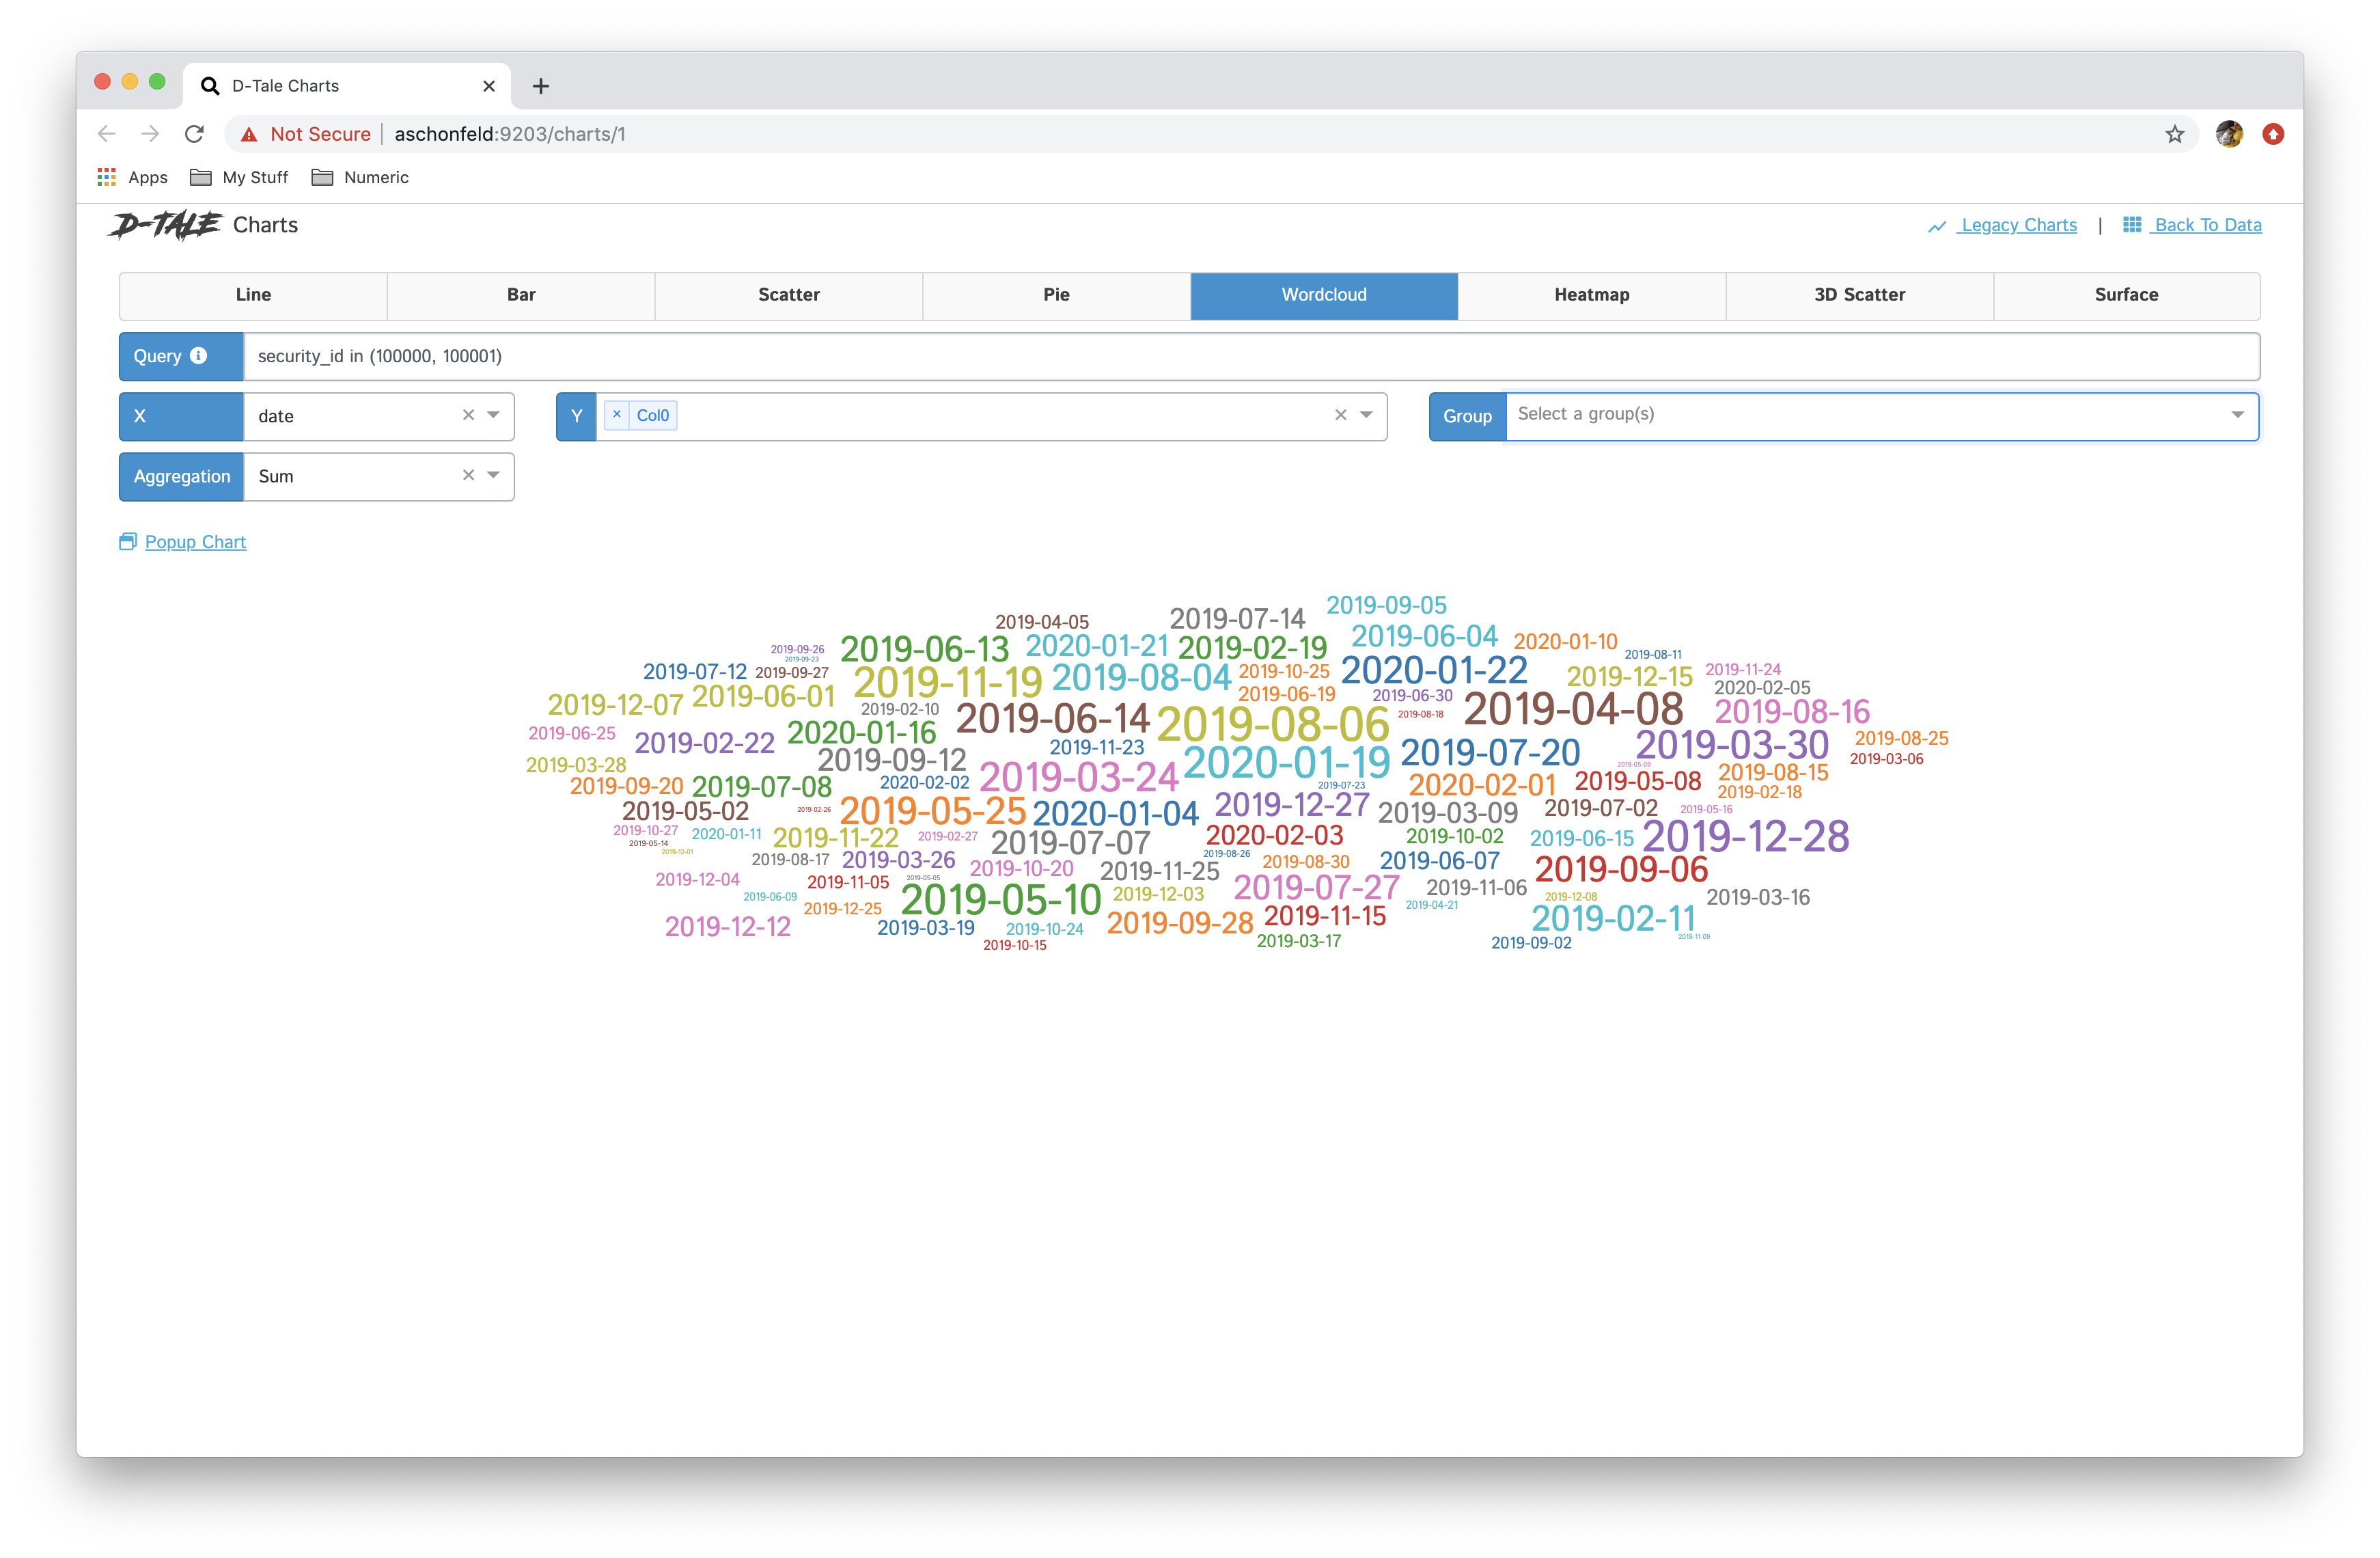 |
 |
| heatmap | 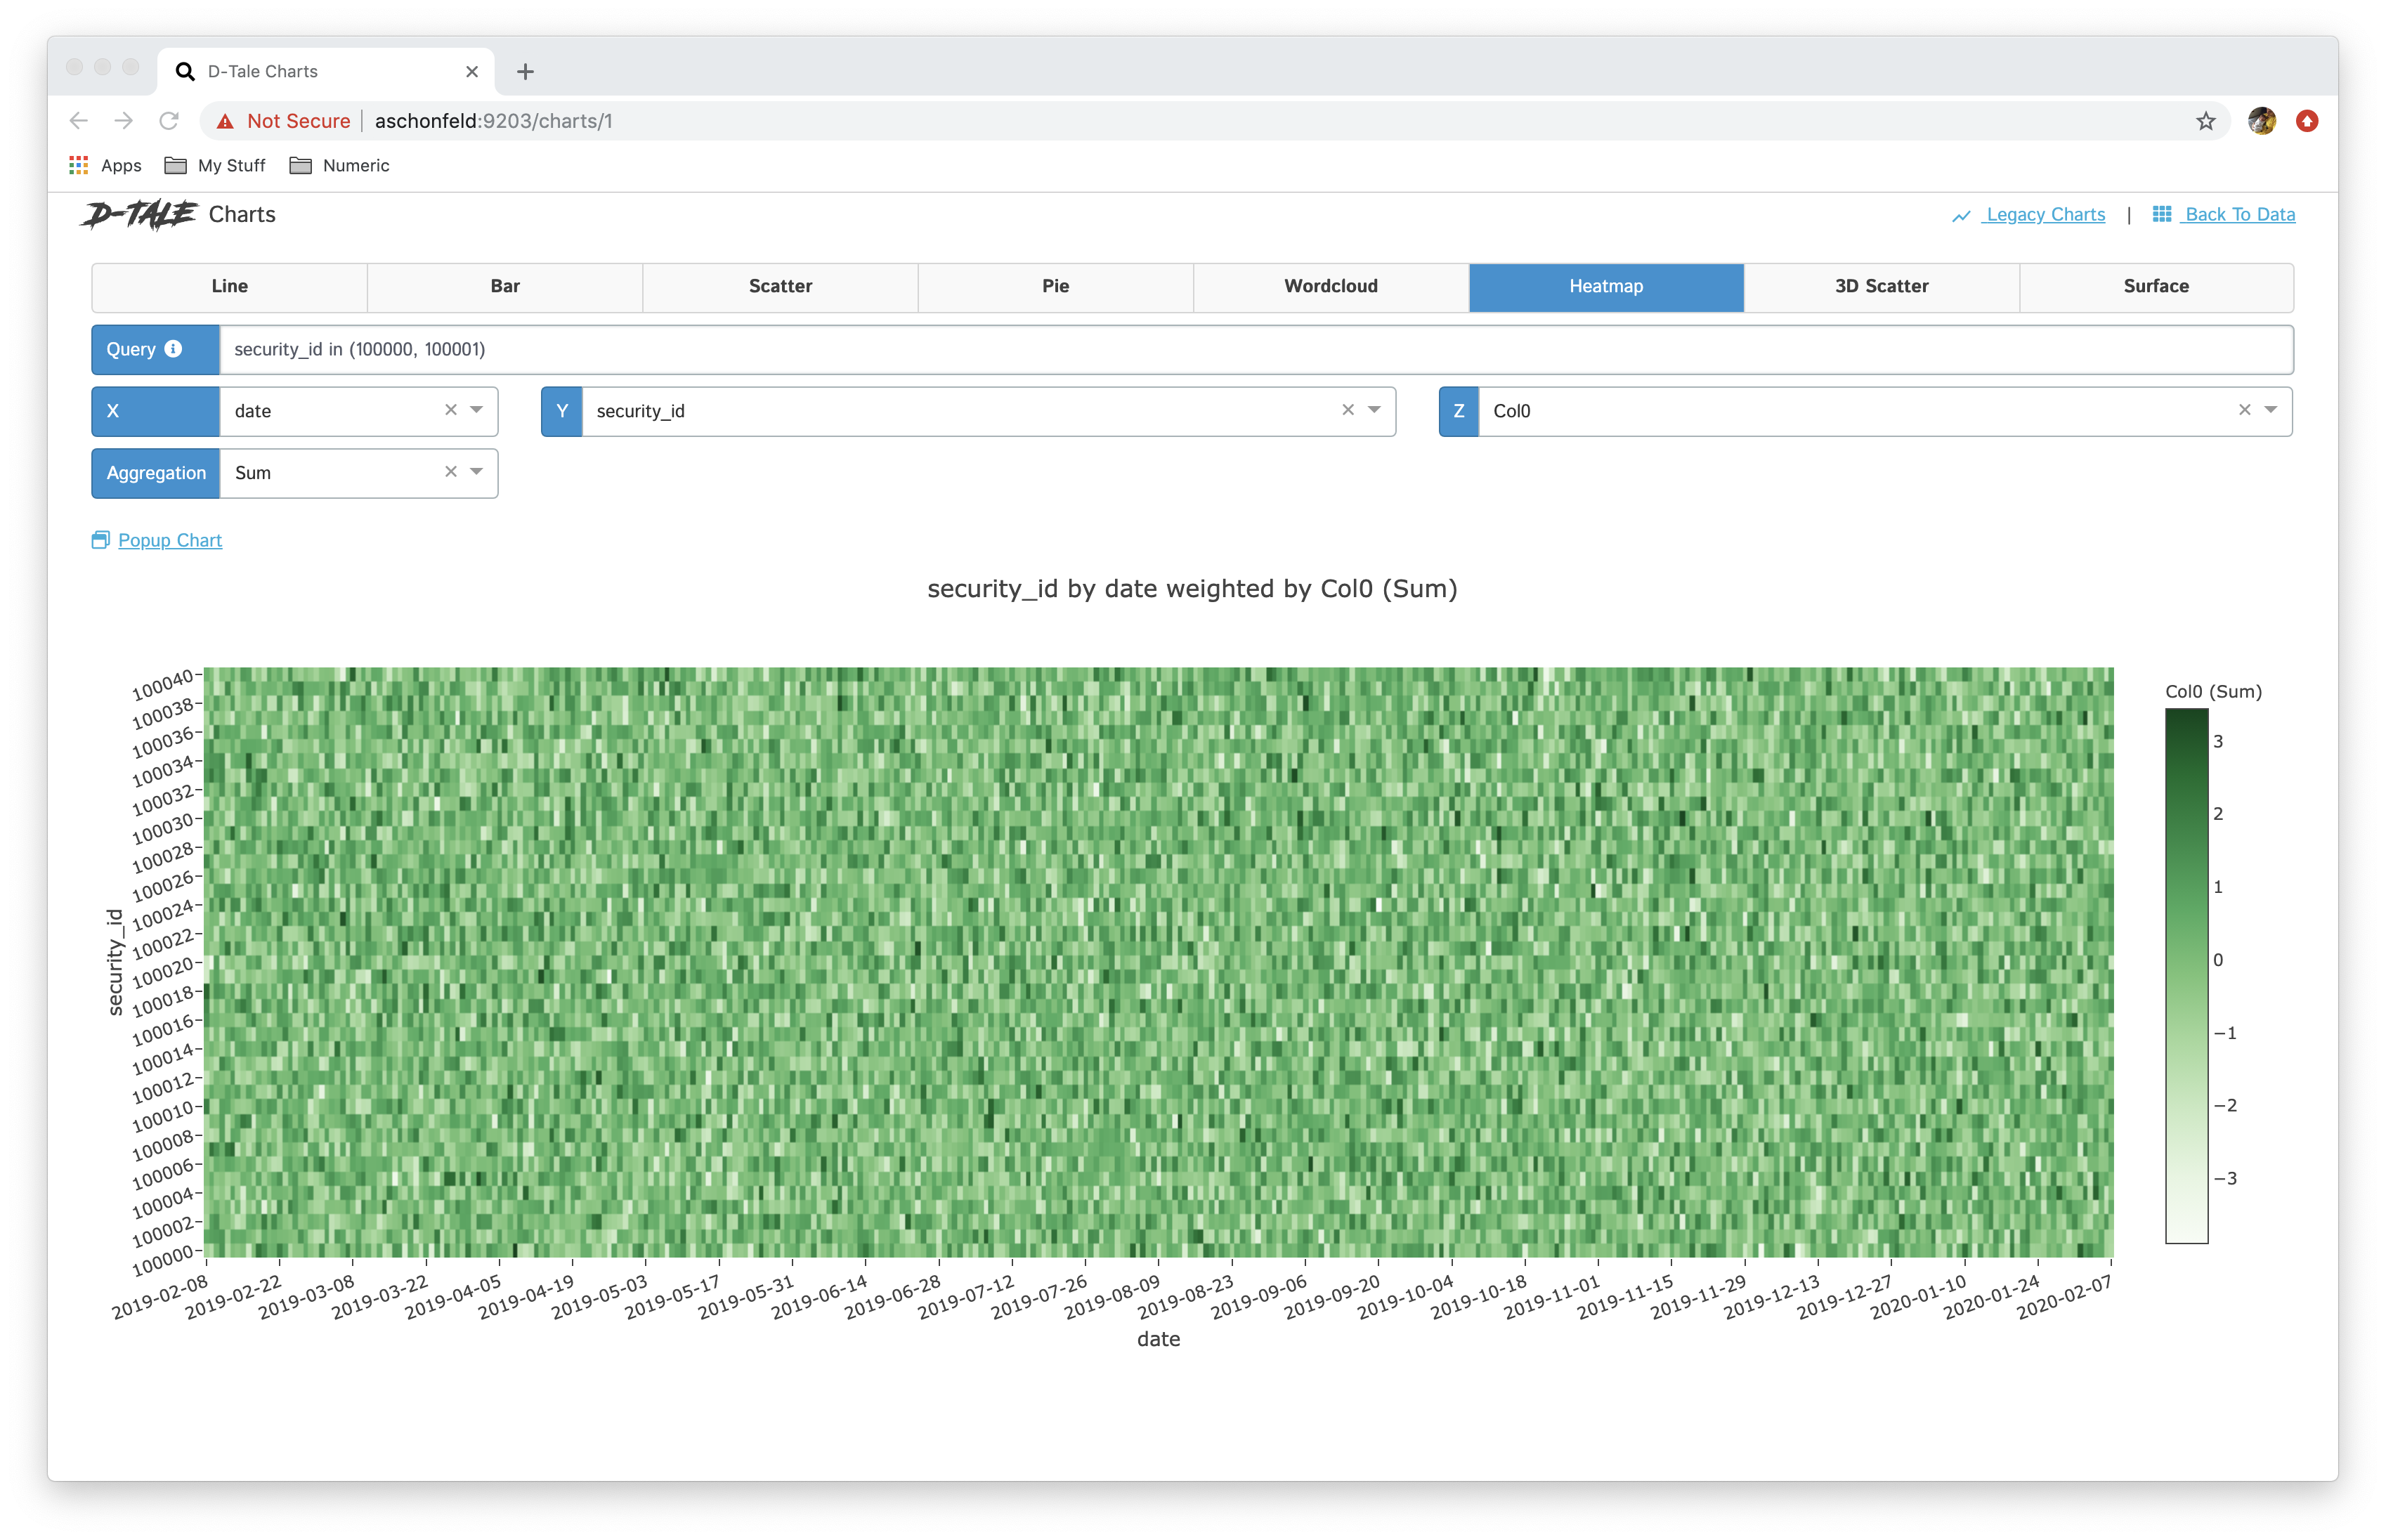 |
|
| 3D scatter |  |
|
| surface | 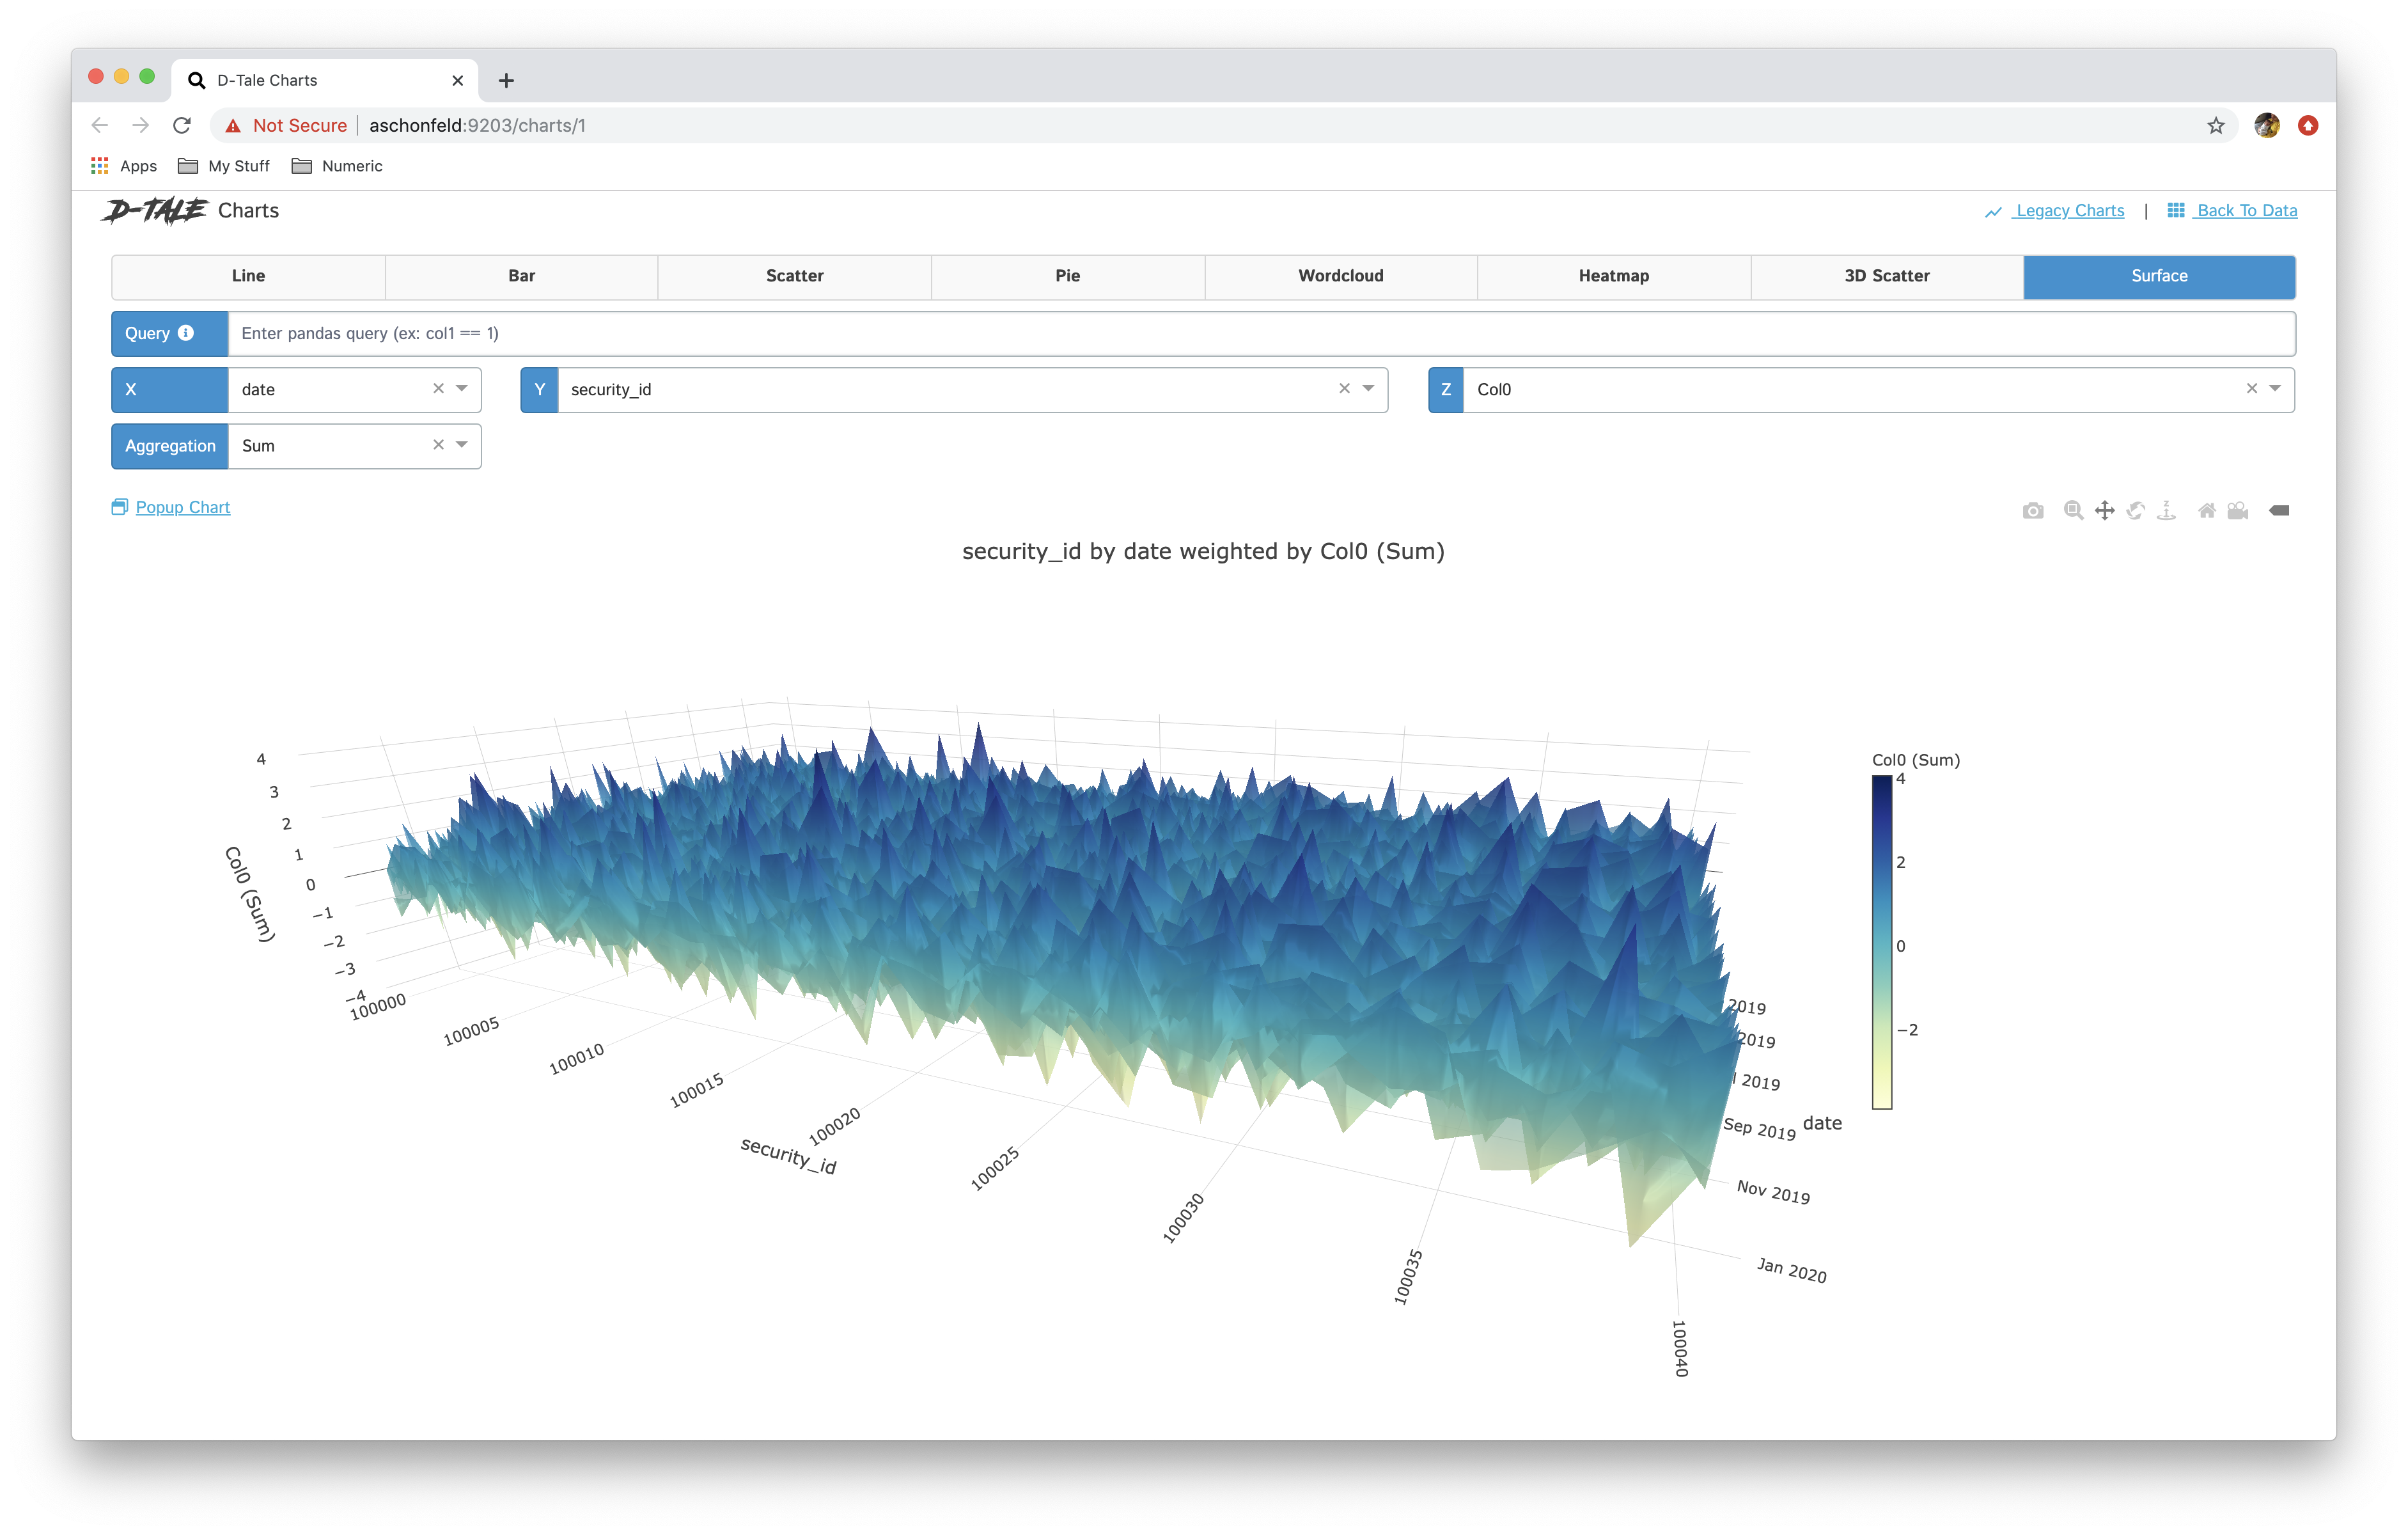 |
|
| Maps (Scatter GEO) |  |
|
| Maps (Choropleth) | 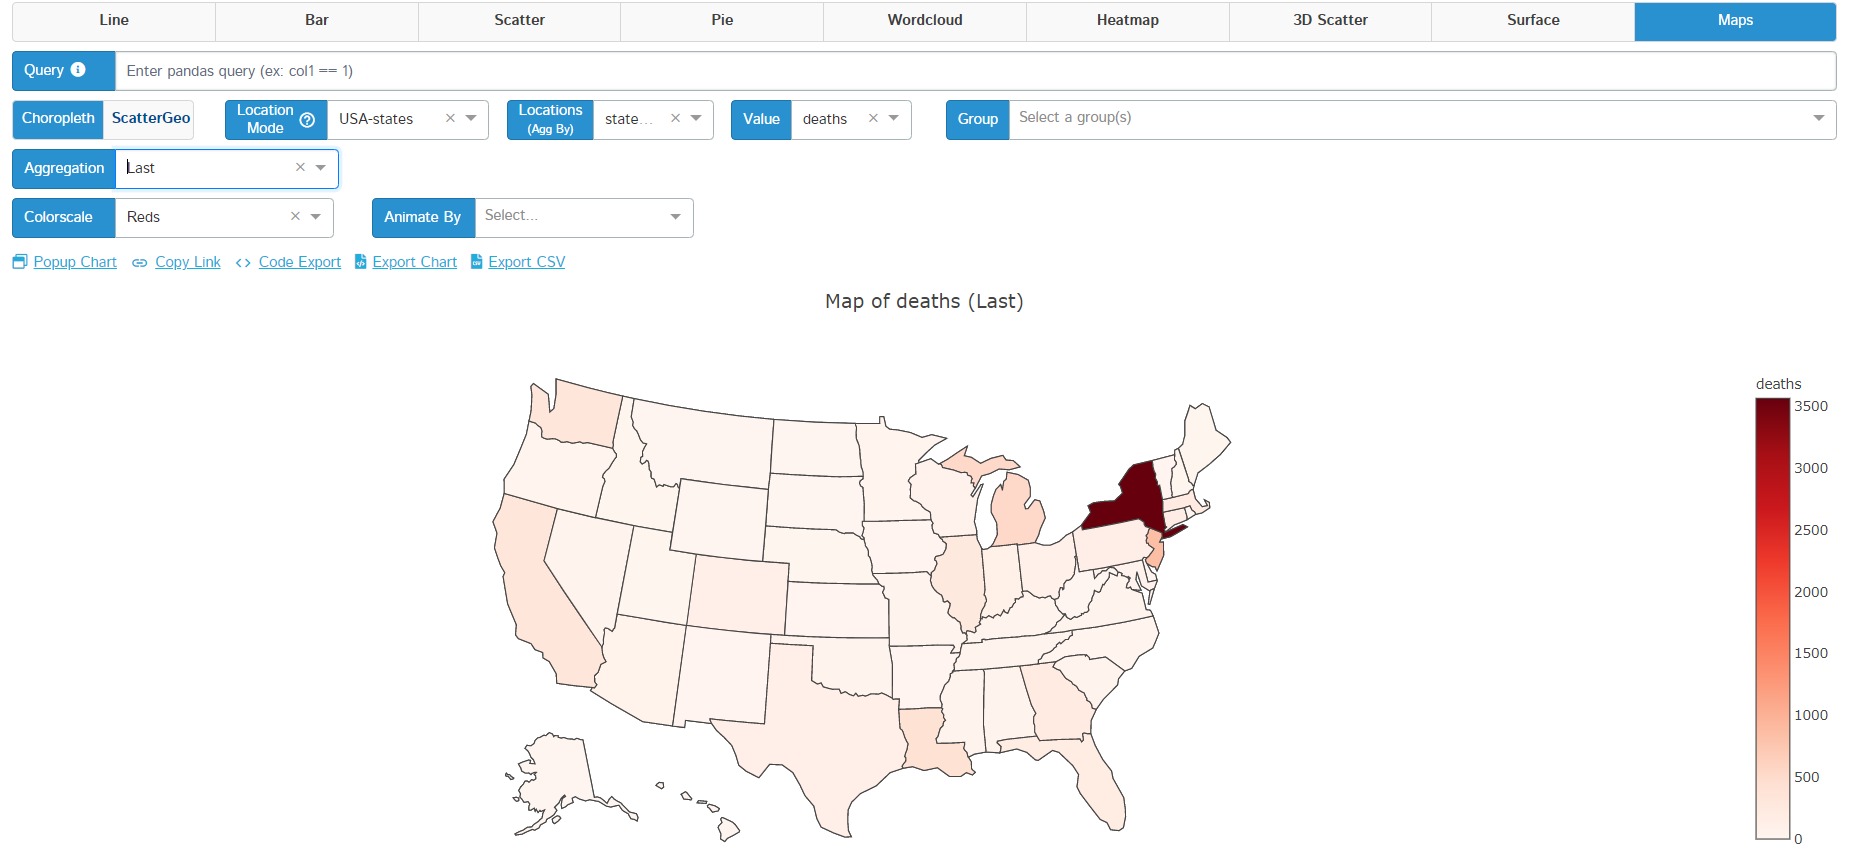 |
Y-Axis Toggling
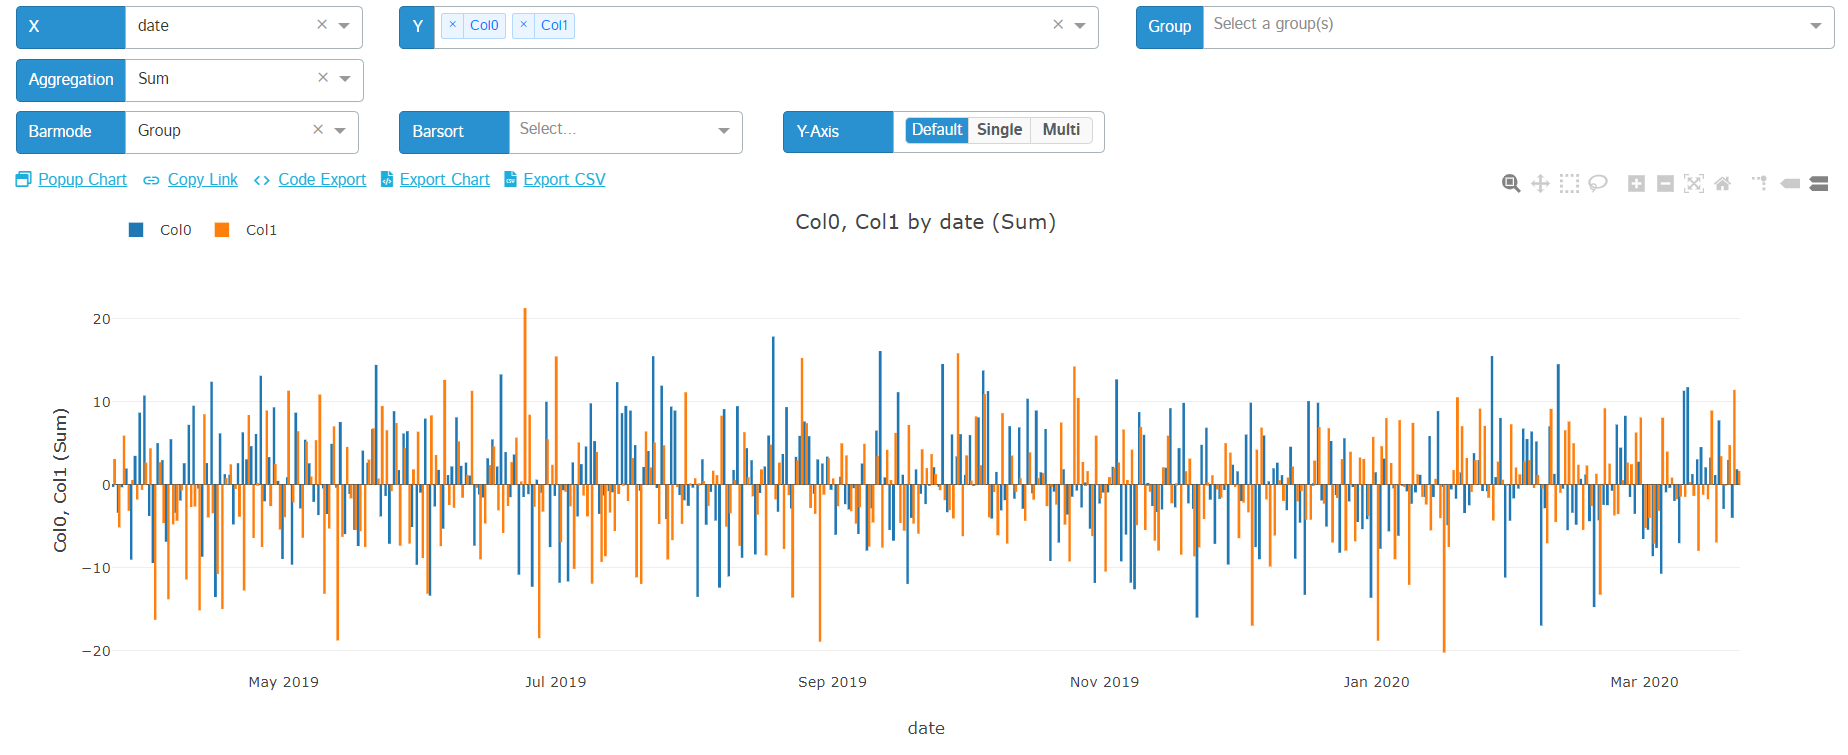
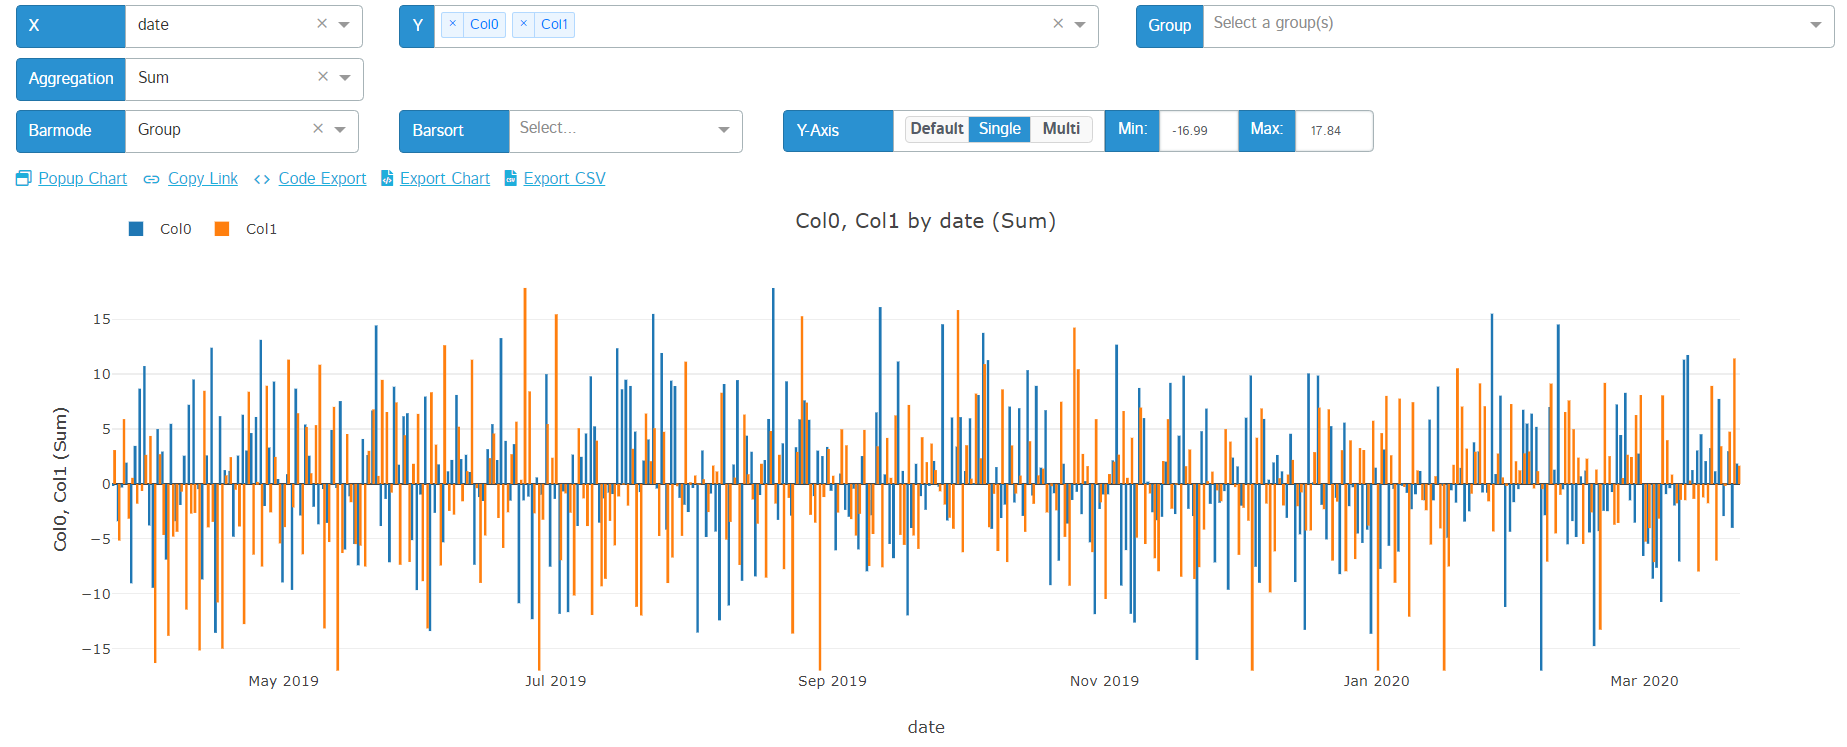
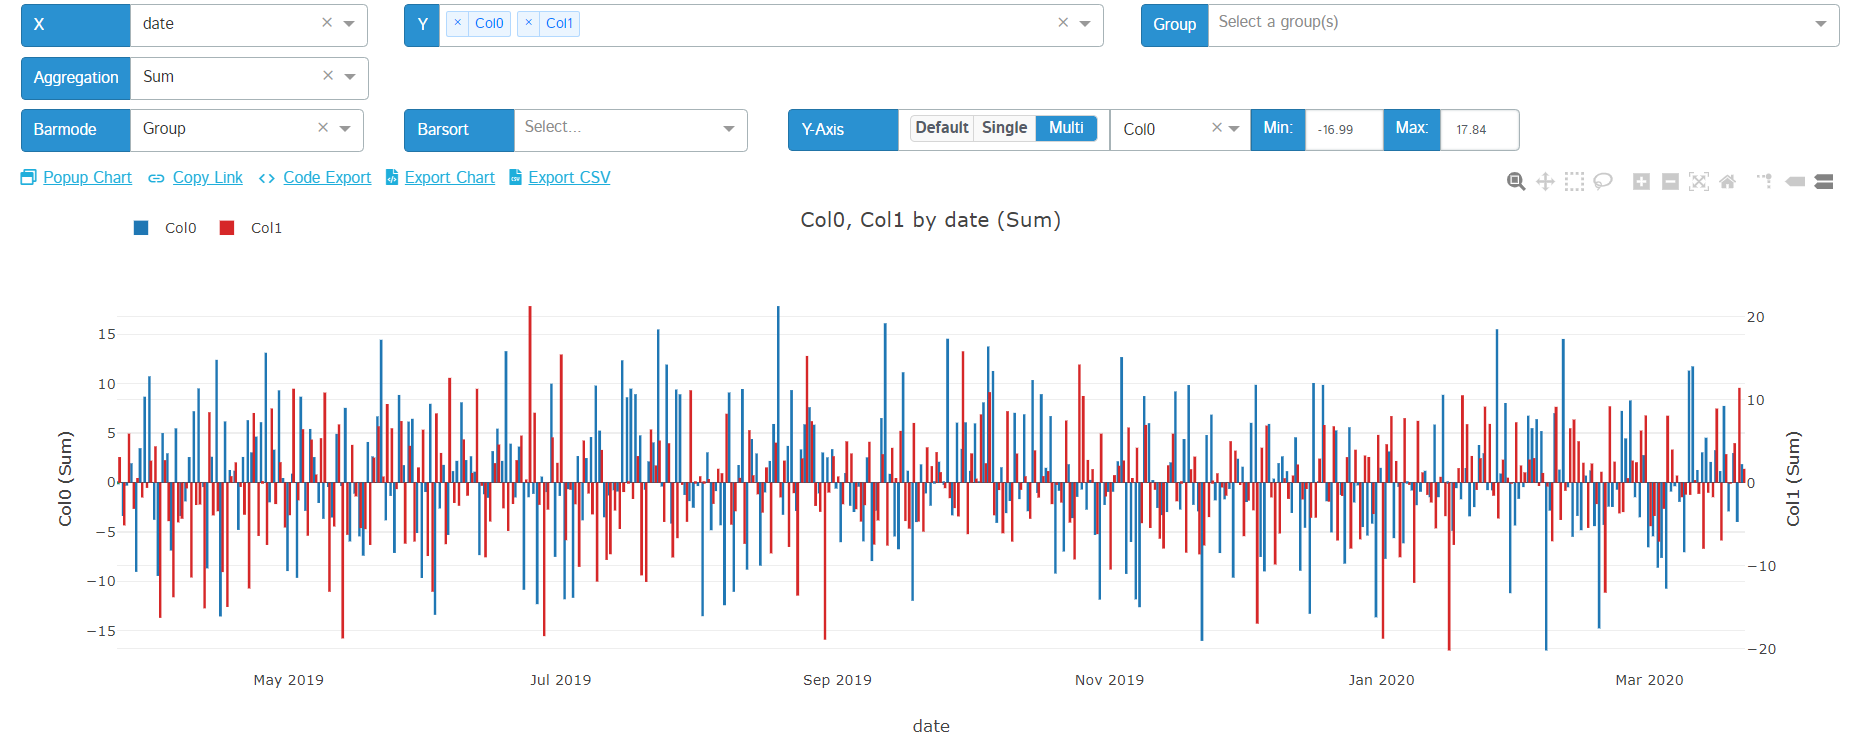
Users now have the ability to toggle between 3 different behaviors for their y-axis display:
Here's a quick tutorial:
And some screenshots:
| Default | Single | Multi |
|---|---|---|
 |
 |
 |
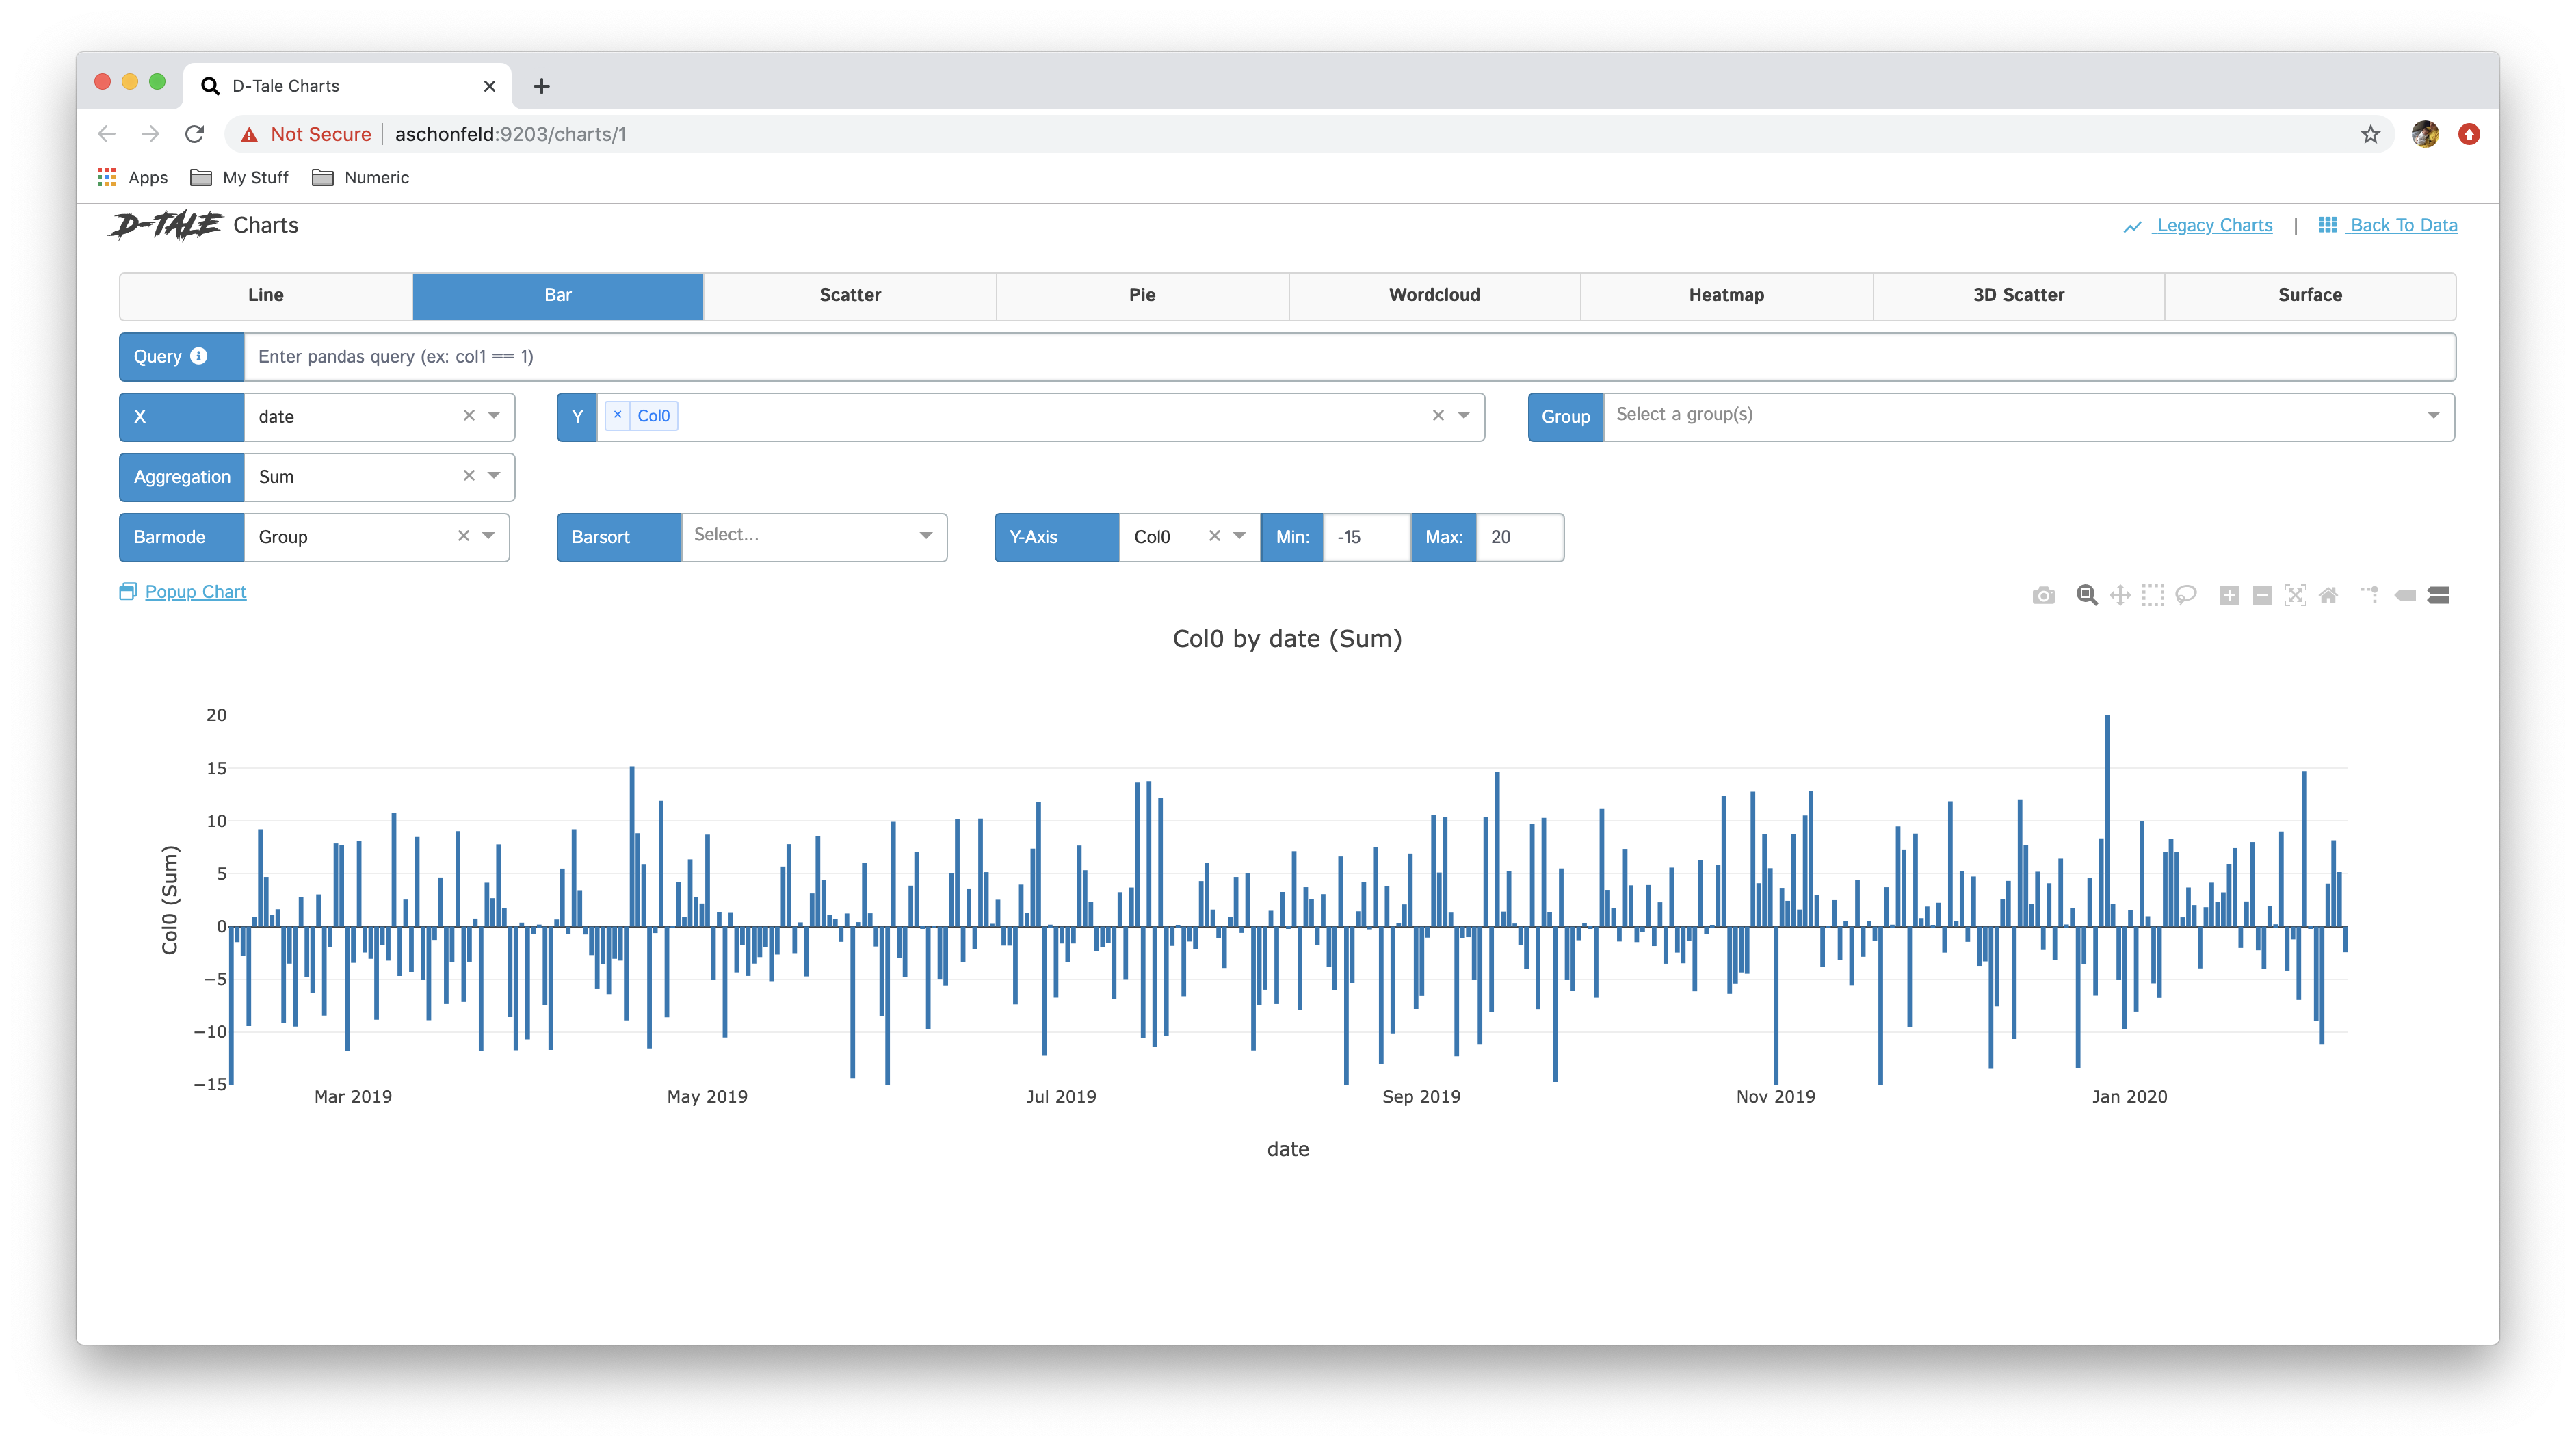
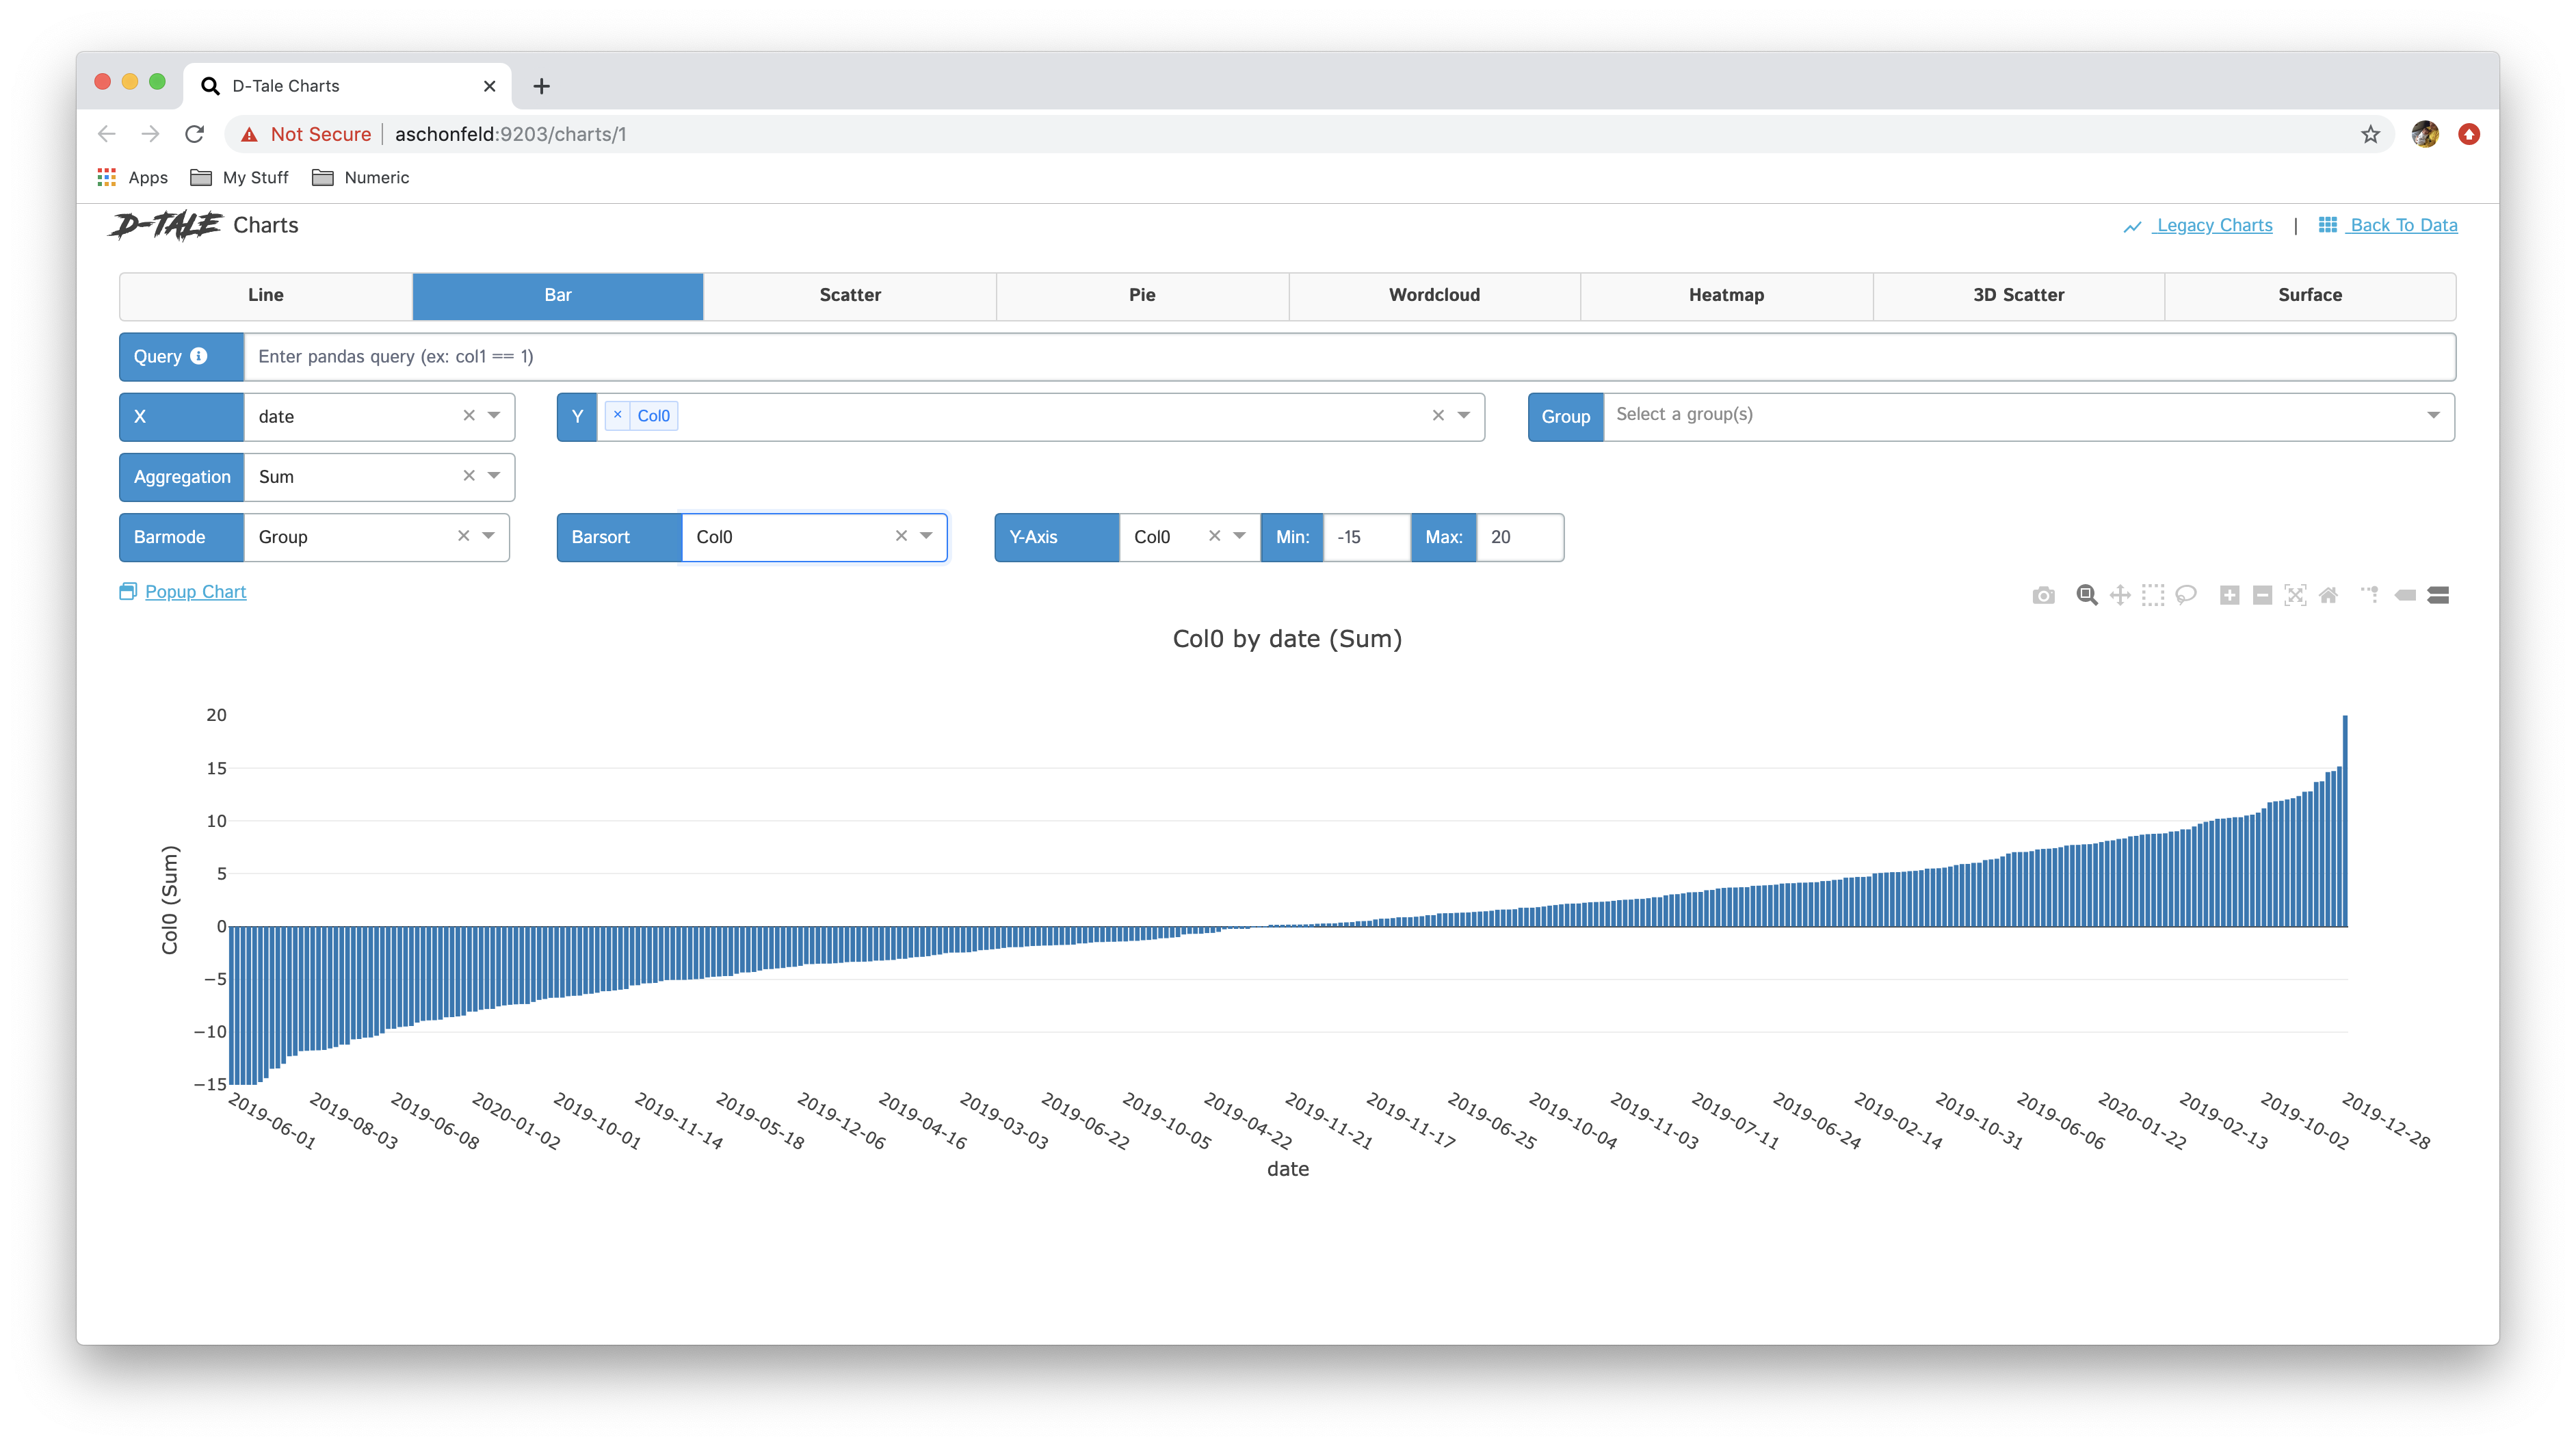
With a bar chart that only has a single Y-Axis you have the ability to sort the bars based on the values for the Y-Axis
| Pre-sort | Post-sort |
|---|---|
 |
 |
Popup Charts
Viewing multiple charts at once and want to separate one out into its own window or simply move one off to the side so you can work on building another for comparison? Well now you can by clicking the "Popup" button 😄
Copy Link
Want to send what you're looking at to someone else? Simply click the "Copy Link" button and it will save a pre-populated chart URL into your clipboard. As long as your D-Tale process is still running when that link is opened you will see your original chart.
Exporting Charts
You can now export your dash charts (with the exception of Wordclouds) to static HTML files which can be emailed to others or saved down to be viewed at a later time. The best part is that all of the javascript for plotly is embedded in these files so the nice zooming, panning, etc is still available! 💥
Exporting CSV
I've been asked about being able to export the data that is contained within your chart to a CSV for further analysis in tools like Excel. This button makes that possible.
Want to run D-Tale in a jupyter notebook and build a chart that will still be displayed even after your D-Tale process has shutdown? Now you can! Here's an example code snippet show how to use it:
import dtale

def test_data():
    import random
    import pandas as pd
    import numpy as np

    df = pd.DataFrame([
        dict(x=i, y=i % 2)
        for i in range(30)
    ])
    rand_data = pd.DataFrame(np.random.randn(len(df), 5), columns=['z{}'.format(j) for j in range(5)])
    return pd.concat([df, rand_data], axis=1)

d = dtale.show(test_data())
d.offline_chart(chart_type='bar', x='x', y='z3', agg='sum')
Pro Tip: If generating offline charts in jupyter notebooks and you run out of memory please add the fol
more like this
A synchronized watch party application for Emby media servers. Watch videos together with friends in real-time, no matt…
search projects, people, and tags