meine
meine 🌒 - A CLI file manager and system utility built with Textual. It combines intuitive command parsing with rich t…
Python★ 50
Draw pretty maps from OpenStreetMap data! Built with osmnx +matplotlib + shapely
 marceloprates
A minimal Python library to draw customized maps from OpenStreetMap created using the osmnx, matplotlib, shapely and vsketch packages.

This work is licensed under a GNU Affero General Public License v3.0 (you can make commercial use, distribute and modify this project, but must disclose the source code with the license and copyright notice)

Install prettymaps with:
pip install prettymaps
Install prettymaps with:
!pip install -e "git+https://github.com/marceloprates/prettymaps#egg=prettymaps"
Then restart the runtime (Runtime -> Restart Runtime) before importing prettymaps
After prettymaps is installed, you can run the front-end (streamlit) application from the prettymaps repository using:
streamlit run app.py
The full tutorial is at docs/tutorial.md — a markdown walkthrough with rendered images, the [Plot] dataclass fields, the layers/style parameters, presets, multiplot, hillshade, and keypoints.
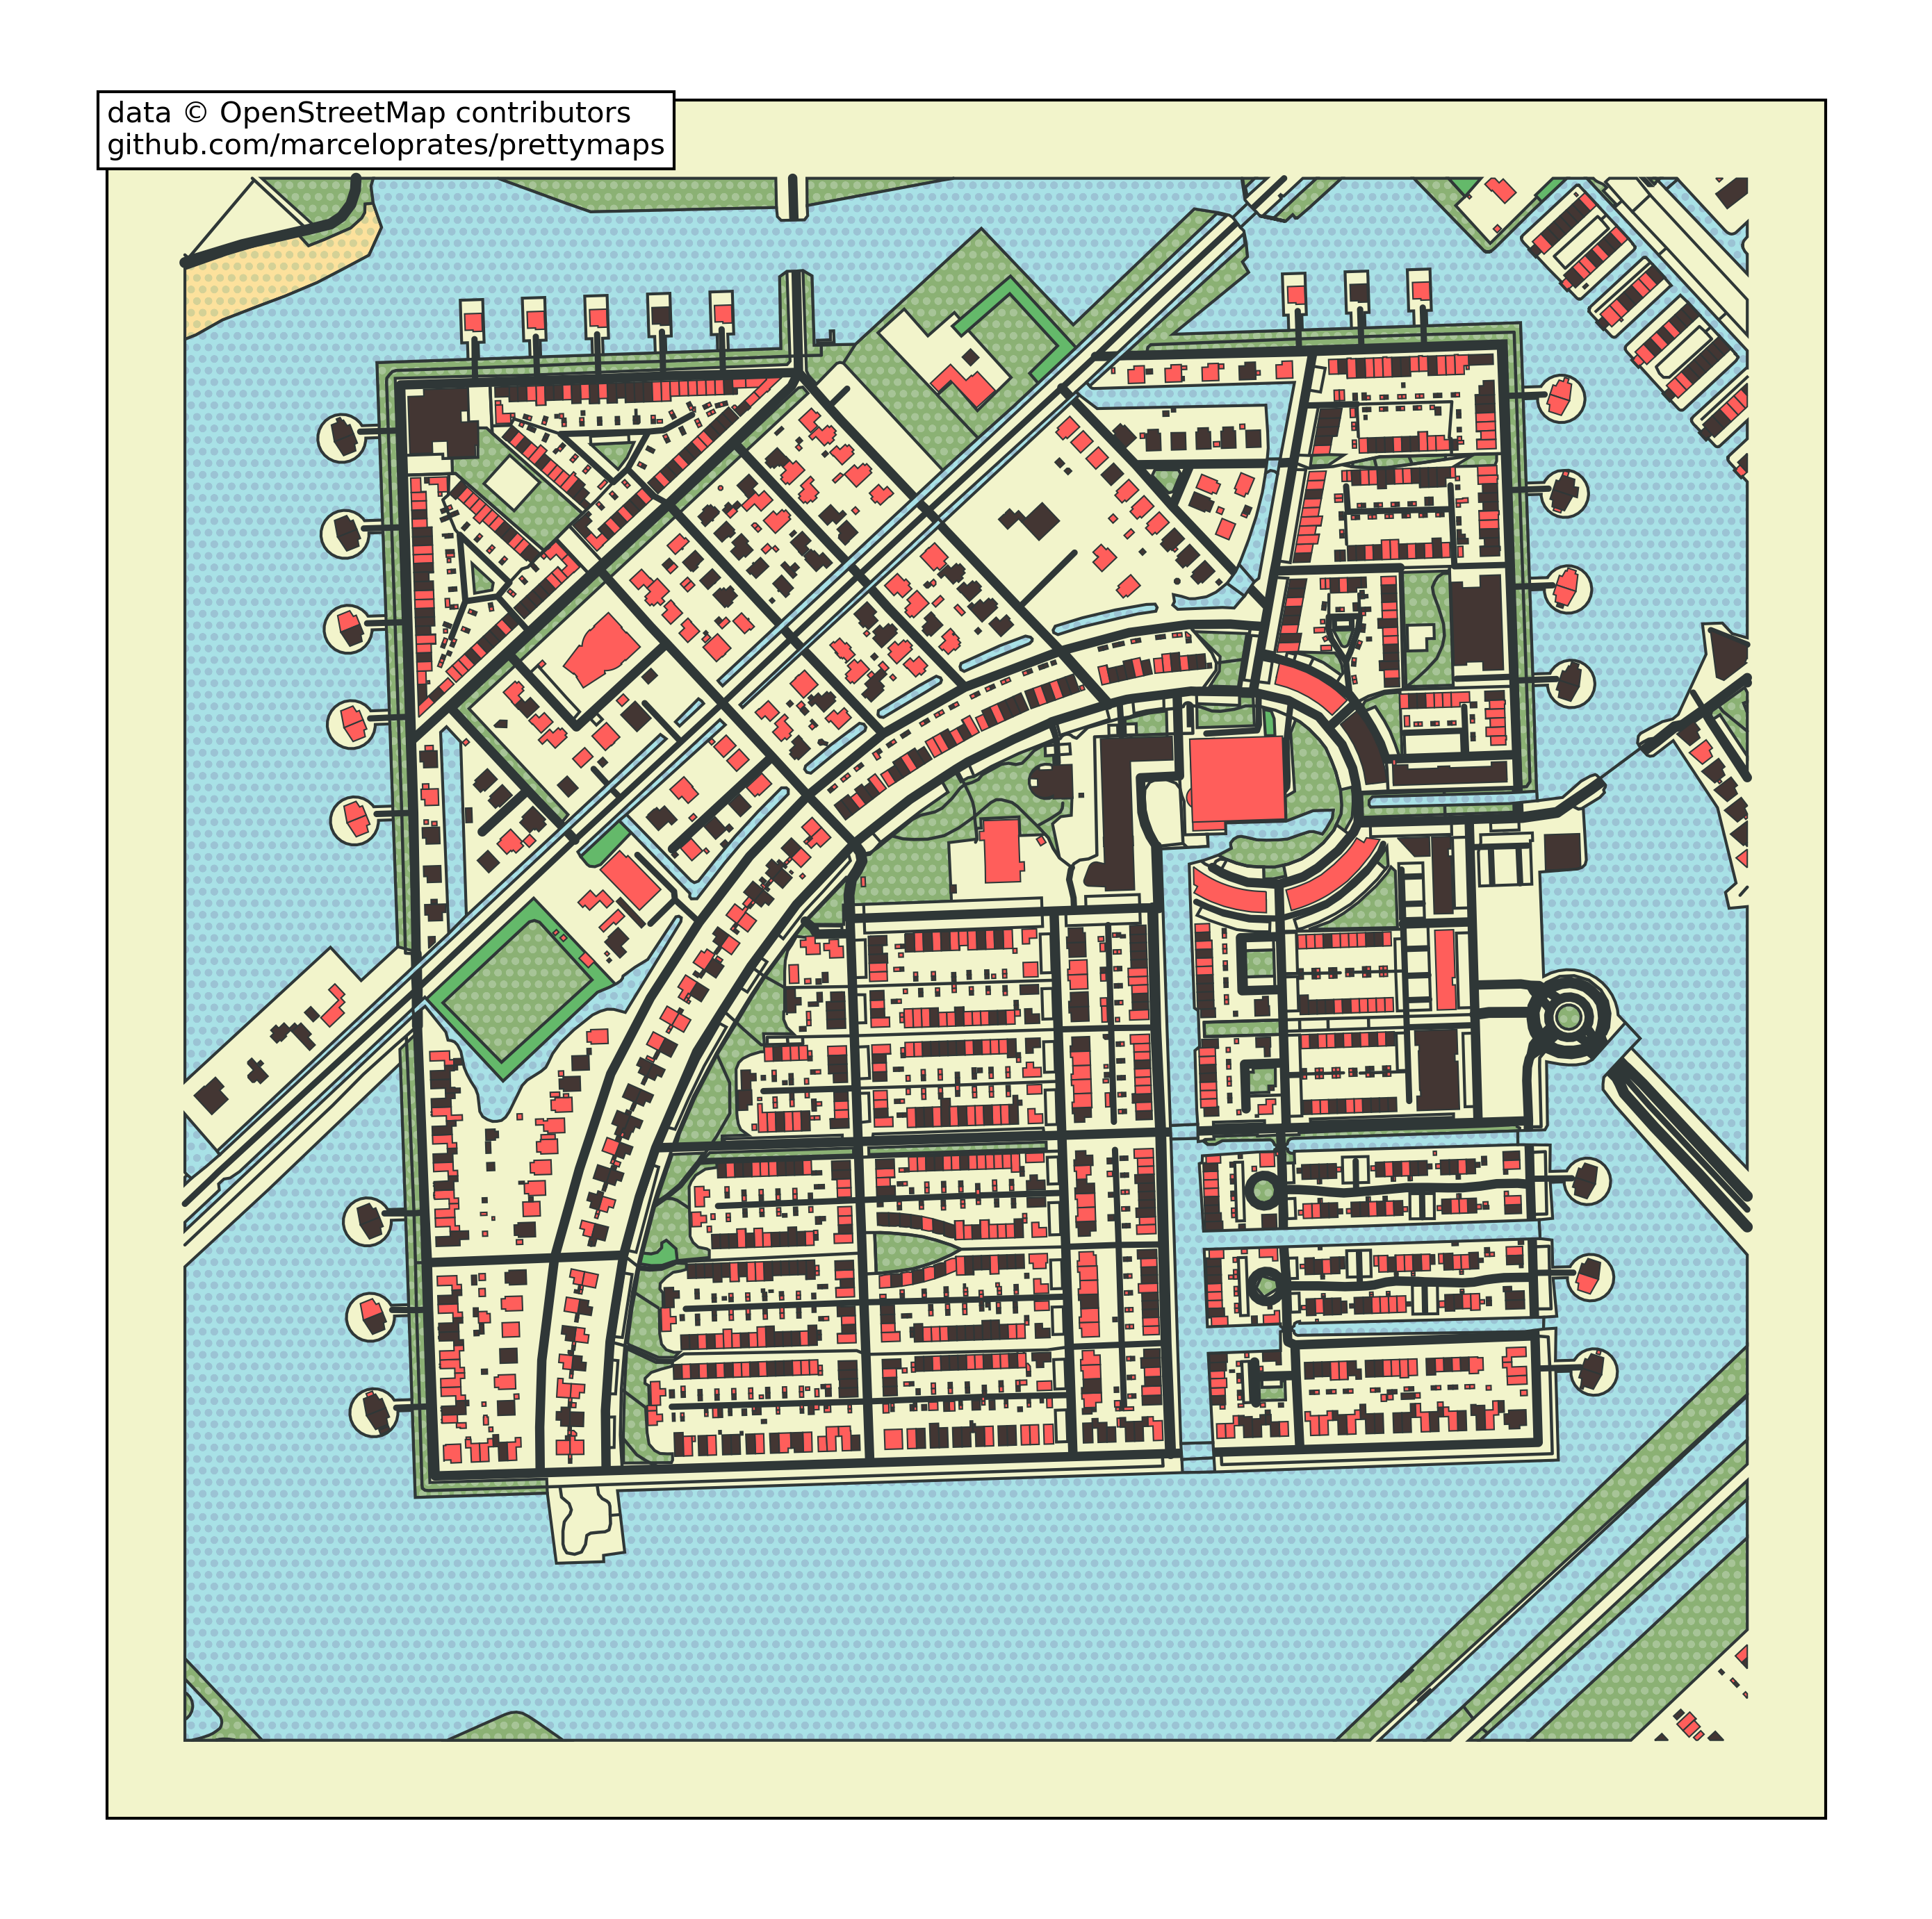
Quick start:
import prettymaps

plot = prettymaps.plot('Stad van de Zon, Heerhugowaard, Netherlands')
| Resource | Where to find it |
|---|---|
| Full tutorial (markdown + images) | docs/tutorial.md |
| Interactive marimo notebook (runnable) | notebooks/tutorial.py |
| Open in Google Colab | Open in Colab |
| Streamlit front-end | streamlit run app.py |
# Install marimo (already in requirements.txt)
pip install marimo

# Open the notebook in your browser
marimo edit notebooks/tutorial.py
The most important prettymaps.plot() parameters are:
layers — dict of OpenStreetMap layers to fetch.style — dict of matplotlib style parameters per layer.preset — load a JSON preset (e.g. 'default', 'minimal', 'macao', 'tijuca').circle / radius / dilate — boundary shape.plot is a dataclass with geodataframes (per-layer GeoDataFrames), fig, and ax.
plot = prettymaps.plot(
    'Praça Ferreira do Amaral, Macau',
    circle=True,
    radius=1100,
    layers={
        "water": {"tags": {"natural": ["water", "bay"]}},
        "building": {"tags": {"building": True}},
    },
    style={
        "water": {"fc": "#a1e3ff", "ec": "#2F3737"},
        "building": {"palette": ["#FFC857", "#E9724C", "#C5283D"]},
    },
)
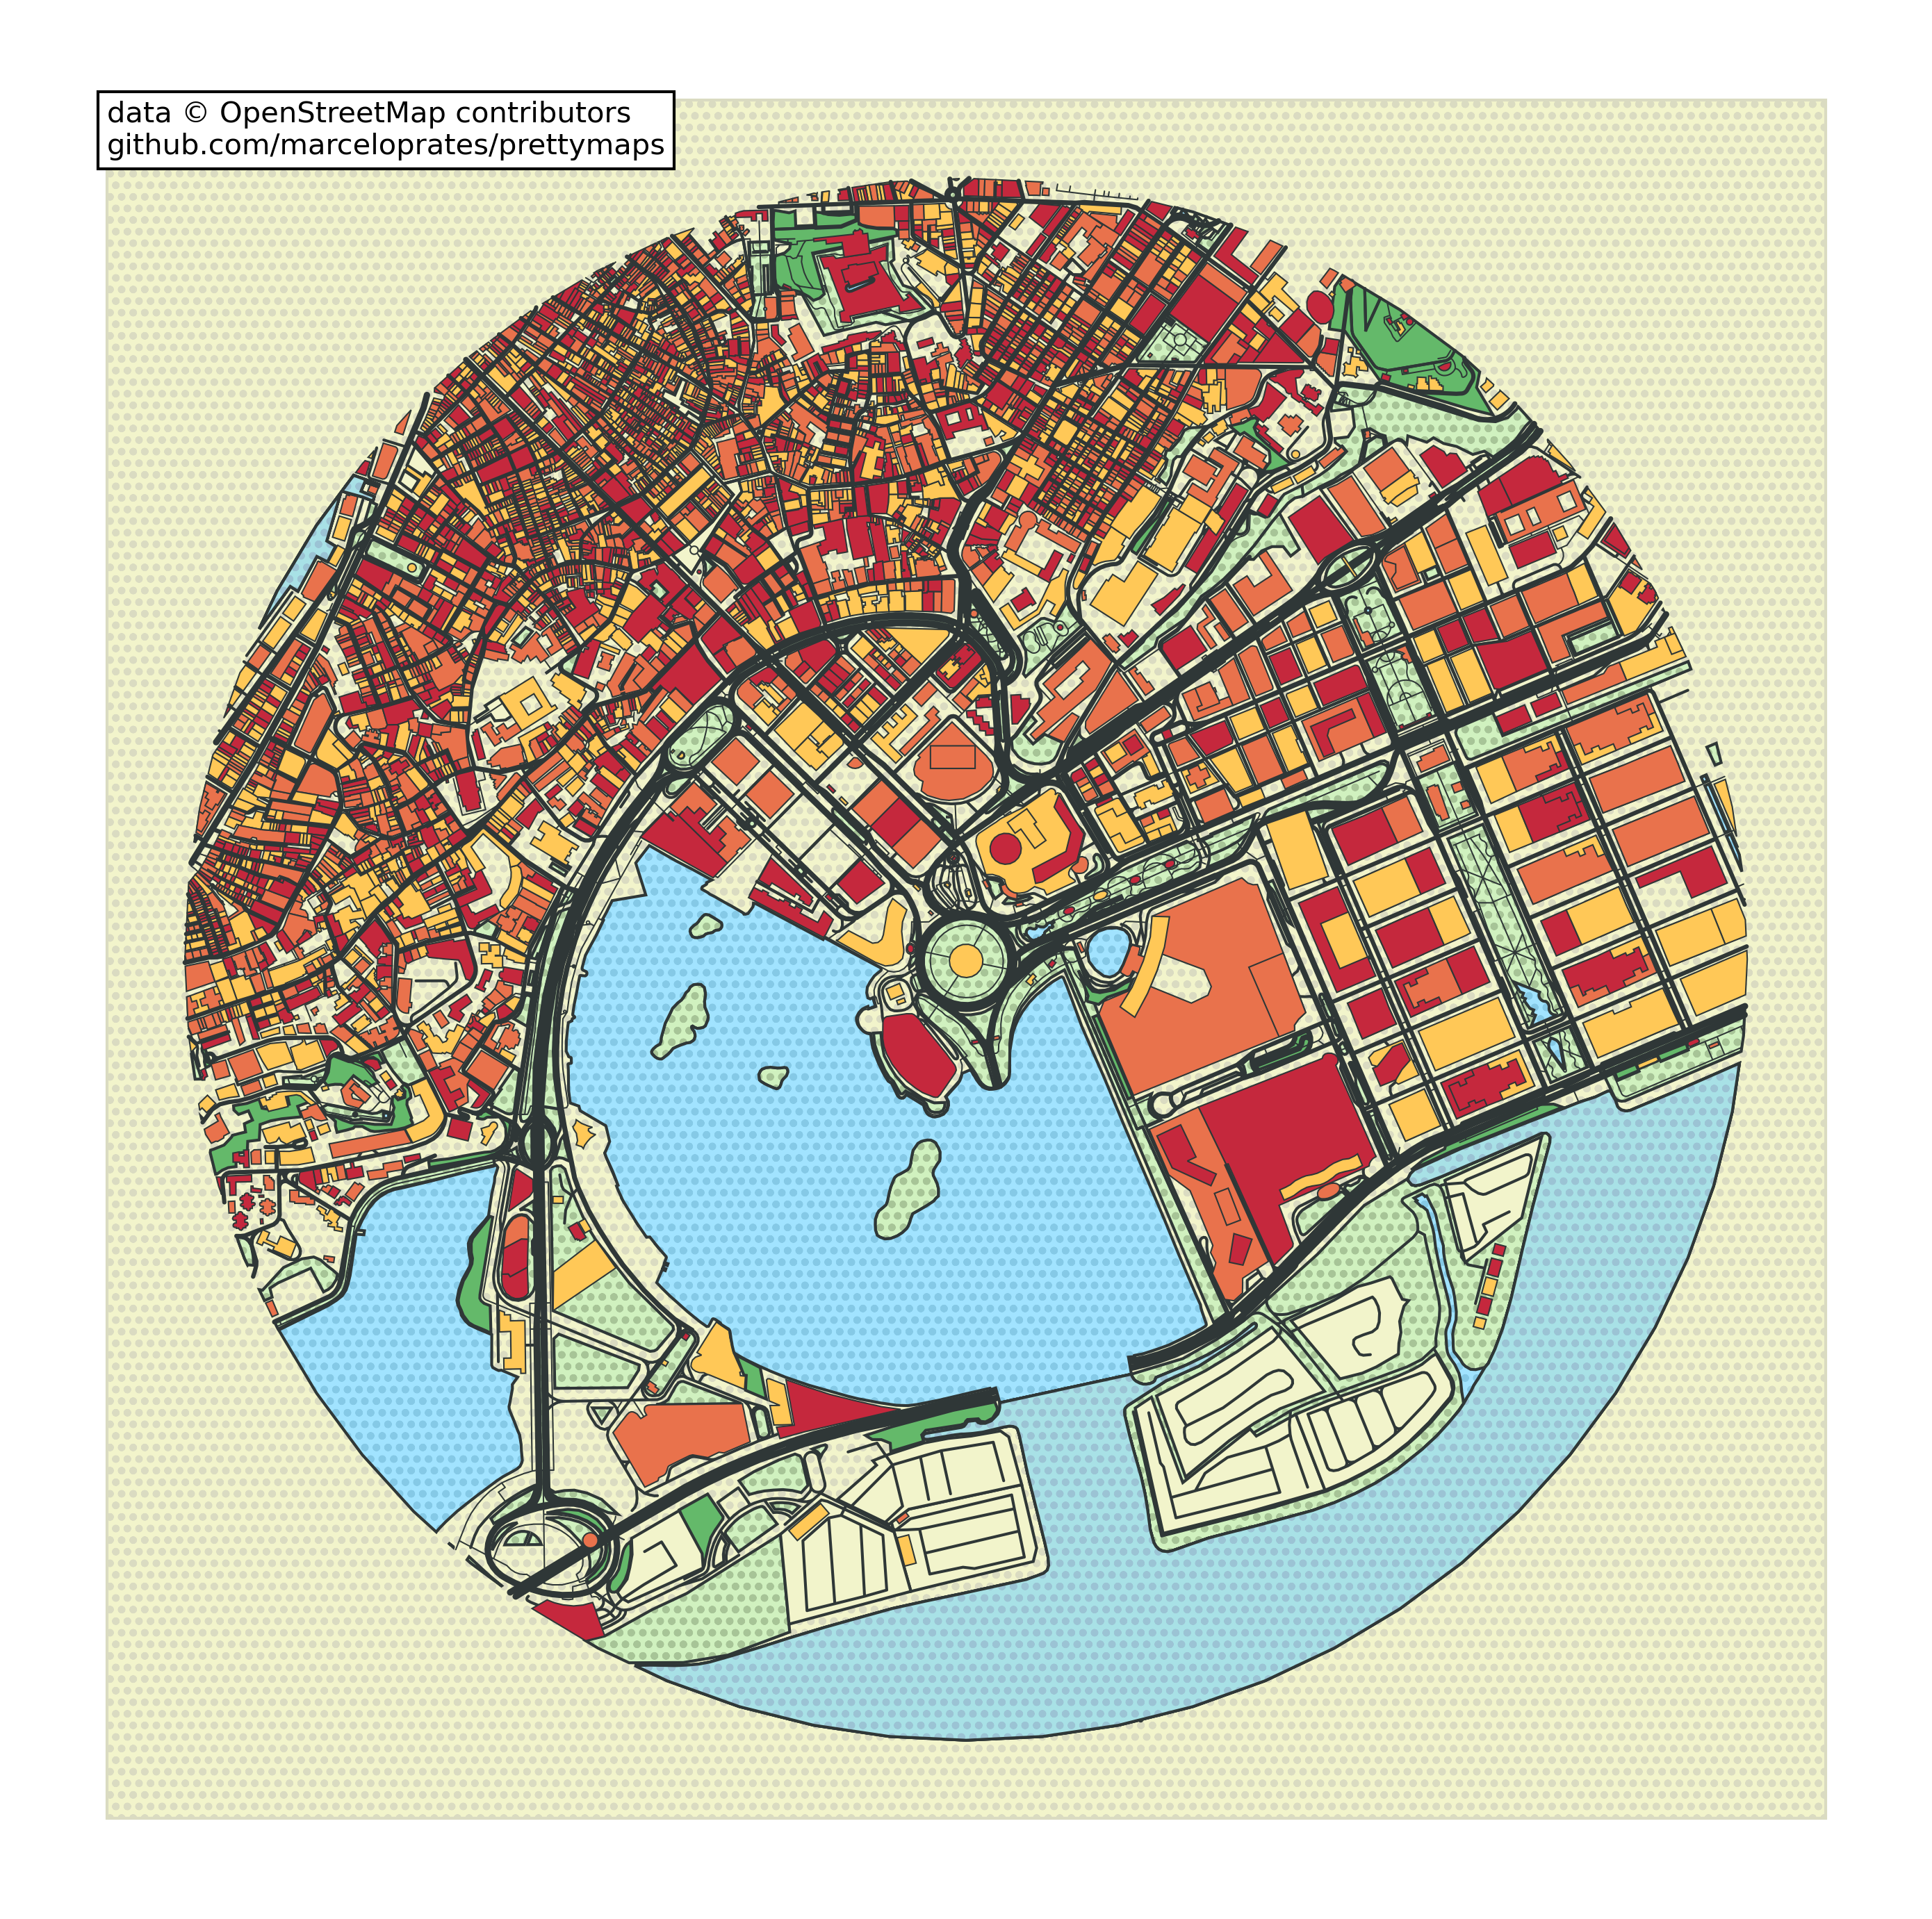
See docs/tutorial.md for the full set of examples (Macau, Bom Fim, mosaic, Barcelona plotter, Tijuca, multiplot, hillshade, Garopaba keypoints).
more like this
meine 🌒 - A CLI file manager and system utility built with Textual. It combines intuitive command parsing with rich t…
Create and add progress bars, Office365 Files and Dropbox Paper papers by labels and link them to your Todoist tasks.
search projects, people, and tags