fridge_tracker
鲜知贴:可复刻的 ESP32 墨水屏食材保鲜提醒器,包含 H5/Node.js/SQLite 服务端、C3/S3 固件、三色/四色屏渲染和 3D 打印外壳,支持公共托管、本地与自托管部署。
JavaScript★ 69
A beautiful weather dashboard for any colour E-Paper Display
 mt-empty
git clone https://github.com/mt-empty/pi-inky-weather-epd.gitmt-empty/pi-inky-weather-epd
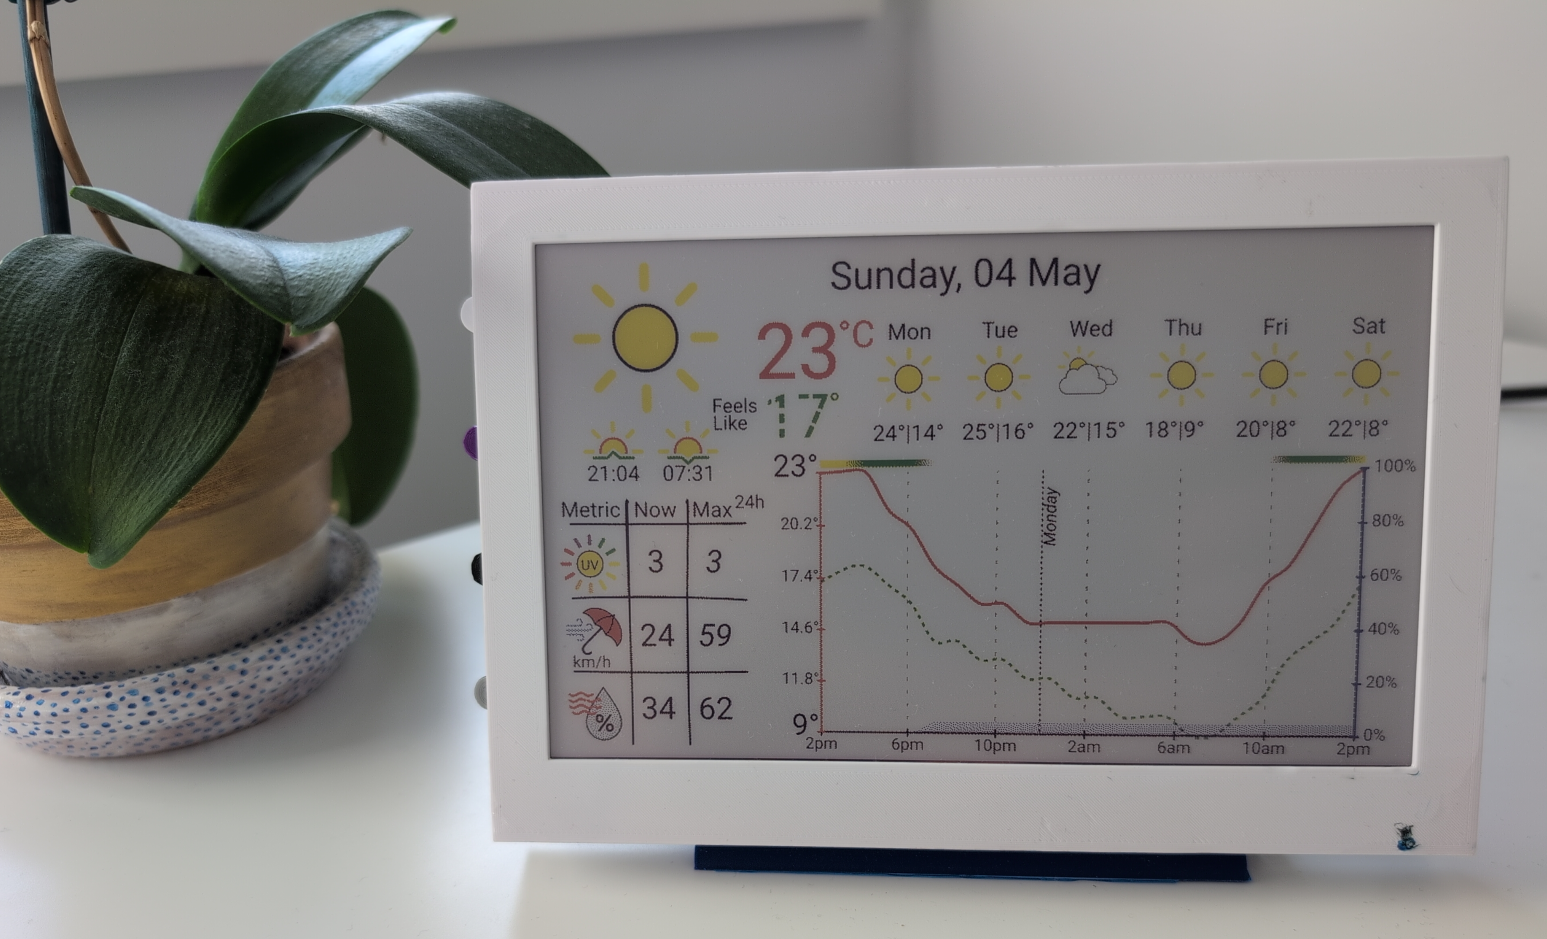
A beautiful weather dashboard for Raspberry Pi with 7.3" e-paper display
Features • Quick Start • Hardware • Configuration • Development
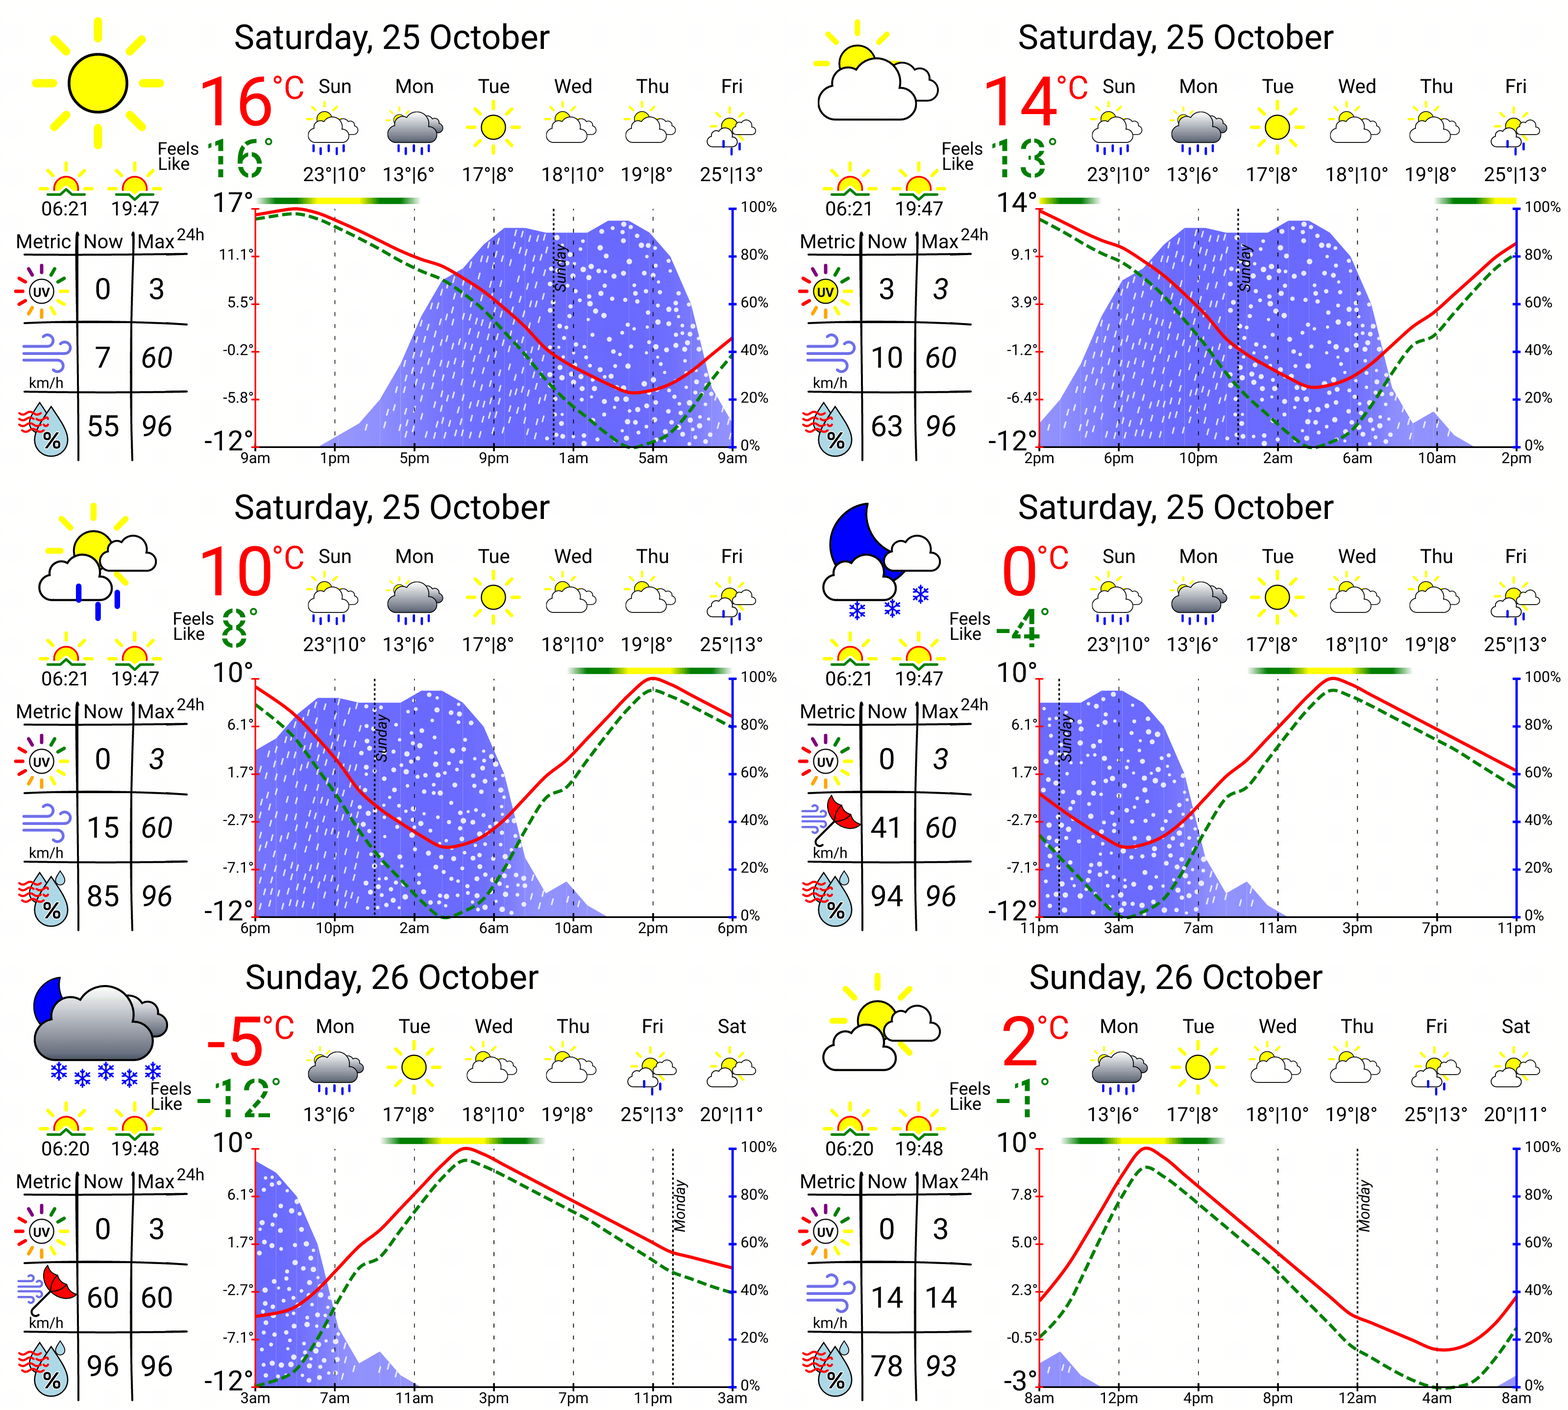
The generation of the image is abstracted away from the hardware, so it can be used on any hardware stack.
Install the Inky library:
curl https://get.pimoroni.com/inky | bash
For detailed installation steps, refer to the official documentation.
Download the latest release:
Download the latest release for your architecture from the releases page and extract it:
| Raspberry Pi Model | Architecture | Download |
|---|---|---|
| Pi 1, Zero, Zero W | arm-unknown-linux-gnueabihf |
ARMv6 |
| Pi 2, 3, 4, Zero 2 W (32-bit OS) | armv7-unknown-linux-gnueabihf |
ARMv7 |
| Pi 3, 4, 5 (64-bit OS) | aarch64-unknown-linux-gnu |
ARMv8 |
| x86 Linux | x86_64-unknown-linux-gnu |
x64 |
 # Download and extract
 wget https://github.com/mt-empty/pi-inky-weather-epd/releases/latest/download/pi-inky-weather-epd-<architecture>.zip
 unzip pi-inky-weather-epd-<architecture>.zip
 chmod +x pi-inky-weather-epd
Configure your weather data provider and location:
Get your latitude and longitude from https://www.latlong.net/ and create a configuration file:
mkdir -p ~/.config
cat > ~/.config/pi-inky-weather-epd.toml << EOF
[api]
latitude = YOUR_LATITUDE   # e.g., -33.8727 # Sydney
longitude = YOUR_LONGITUDE # e.g., 151.2057
provider = "open_meteo"    # "open_meteo" (worldwide) or "bom" (Australia only)
EOF
See ./config/default.toml for more configuration examples.
Set up an hourly cron job to update the display:
(crontab -l 2>/dev/null; echo "0 * * * * cd /path/to/extracted/files && ./pi-inky-weather-epd && sudo <PYTHON_PATH> <IMAGE_SCRIPT_PATH> --file dashboard.png --saturation <SATURATION>") | crontab -
Replace:
/path/to/extracted/files with your installation directory<PYTHON_PATH> with path to Python (e.g., /usr/bin/python3)<IMAGE_SCRIPT_PATH> with path to Inky's image.py (e.g., /home/pi/Pimoroni/inky/examples/7color/image.py)<SATURATION> with the desired saturation level depending on your display (e.g., 1.0). If using the Inky Impression 7 colours, it is not recommended to change this for current iconsExample of complete cron command:
0 * * * * cd /home/pi/pi-inky-weather-epd && ./pi-inky-weather-epd && sudo /home/dietpi/env/bin/python3 /home/dietpi/Pimoroni/inky/examples/7color/image.py --file dashboard.png --saturation 1.0
You can override the default configs located at ./config/ by creating a file at:
~/.config/pi-inky-weather-epd.toml
Here are example configurations.
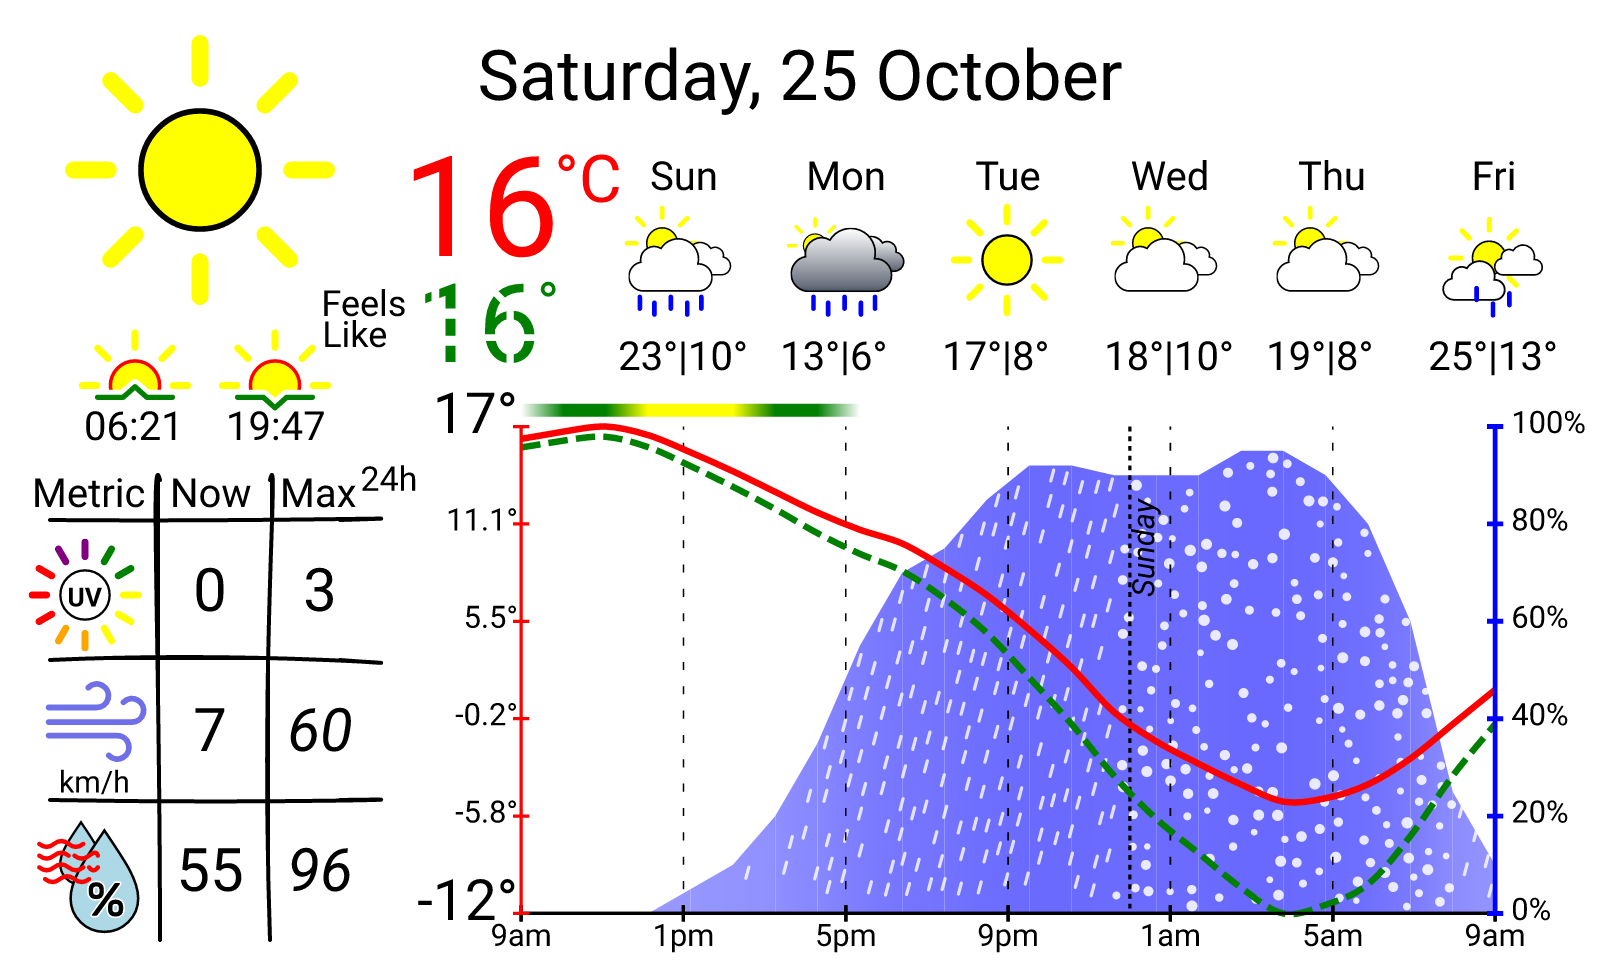
[render_options]
temp_unit = "F"
wind_speed_unit = "mph"
You can customise the date format using chrono strftime specifiers. The default is "%A, %d %B" (e.g., "Saturday, 06 December").
[render_options]
# Example formats:
# date_format = "%B %-d, %Y"     # December 6, 2025 (US style)
# date_format = "%d/%m/%Y"       # 06/12/2025 (Australia/UK)
# date_format = "%m/%d/%Y"       # 12/06/2025 (USA)
# date_format = "%Y-%m-%d"       # 2025-12-06 (ISO 8601)
# date_format = "%a, %-d %b"     # Sat, 6 Dec
# date_format = "%d.%m.%Y"       # 06.12.2025 (Germany)

date_format = "%A, %d %B"
See chrono strftime documentation for all available format specifiers.
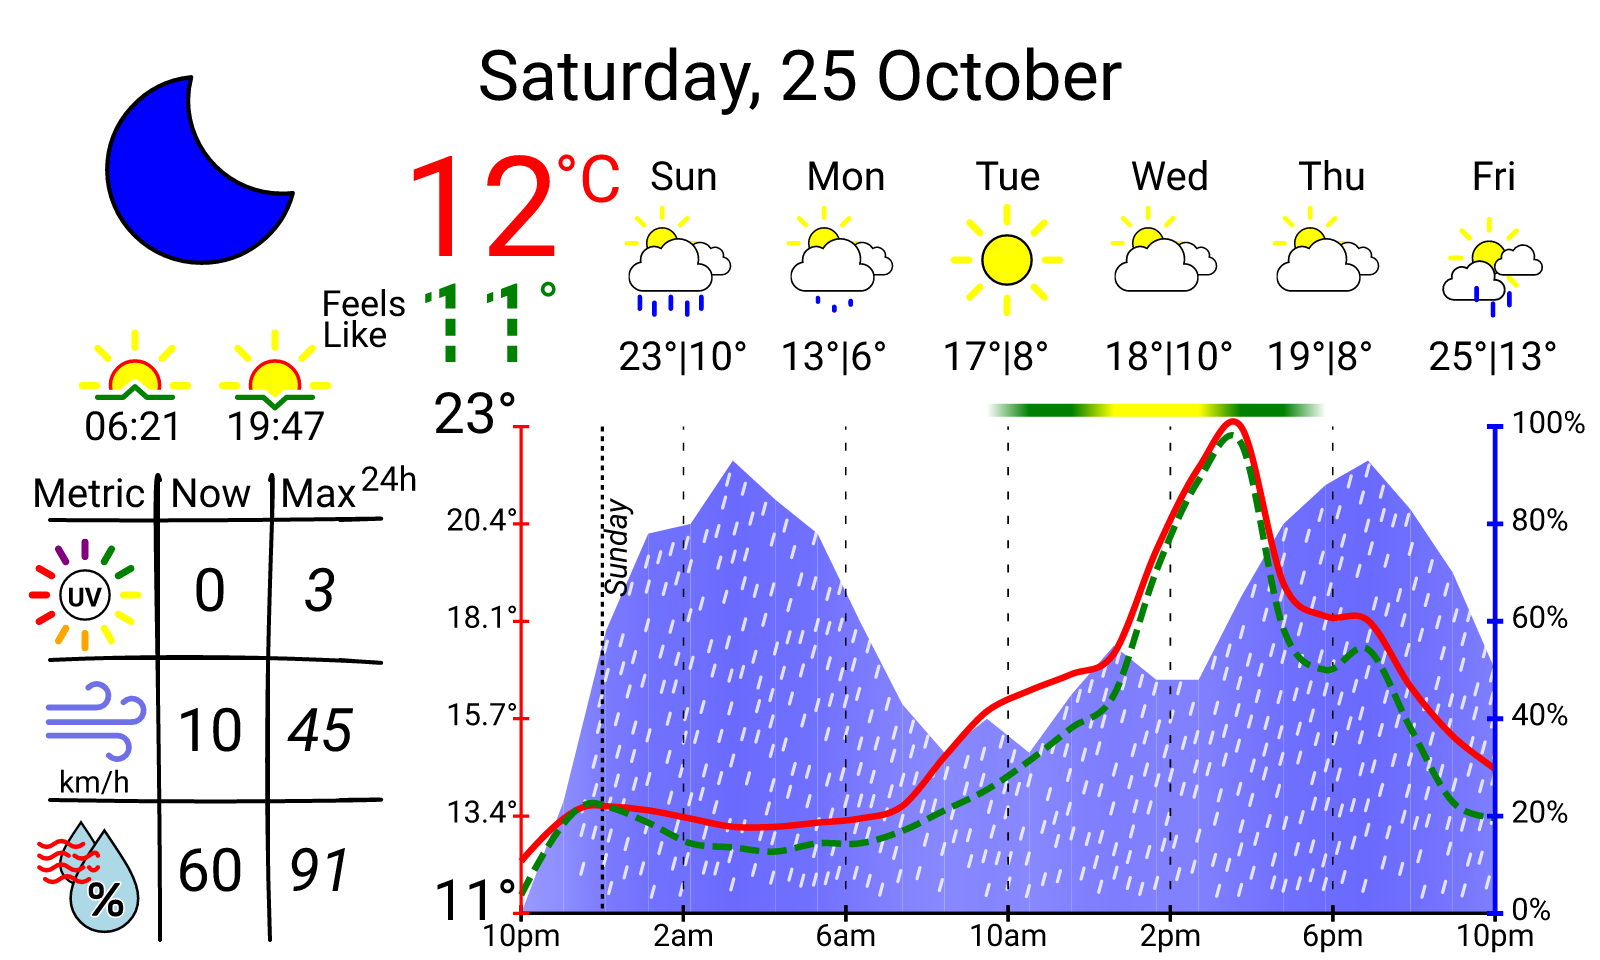
When the sky is clear, the moon phase icon is used instead of the clear night icon, you can disable with:
[render_options]
use_moon_phase_instead_of_clear_night = false
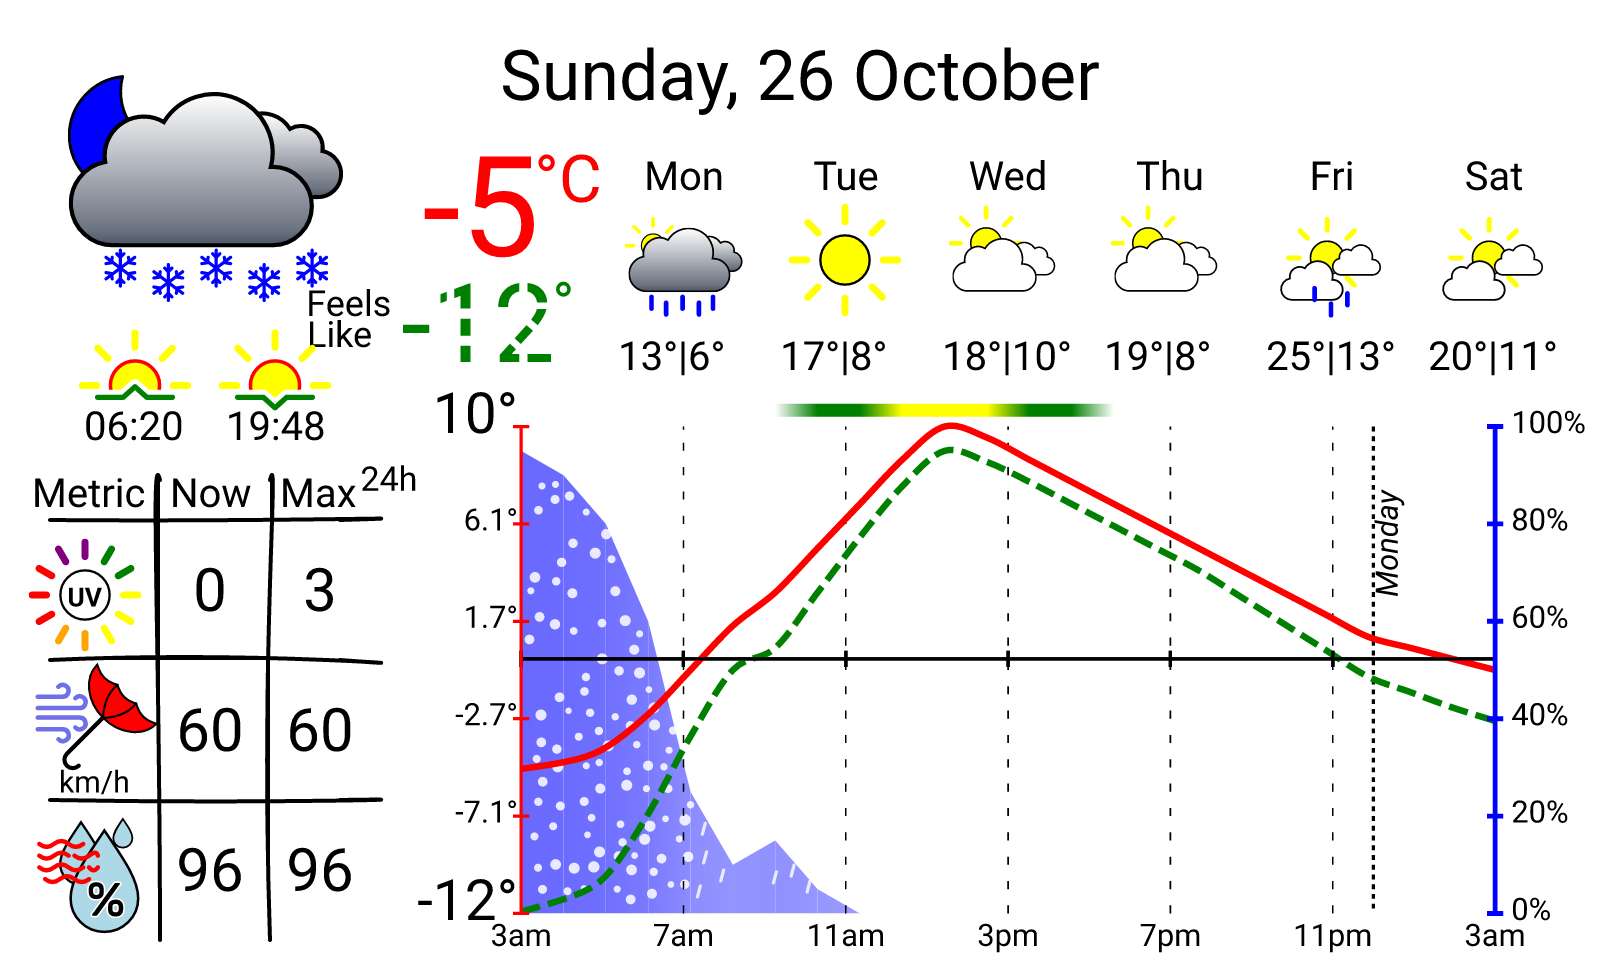
The x-axis is no longer at the bottom of the graph when the temperature is below zero, it is now always positioned at x = 0.
[render_options]
x_axis_always_at_min = false
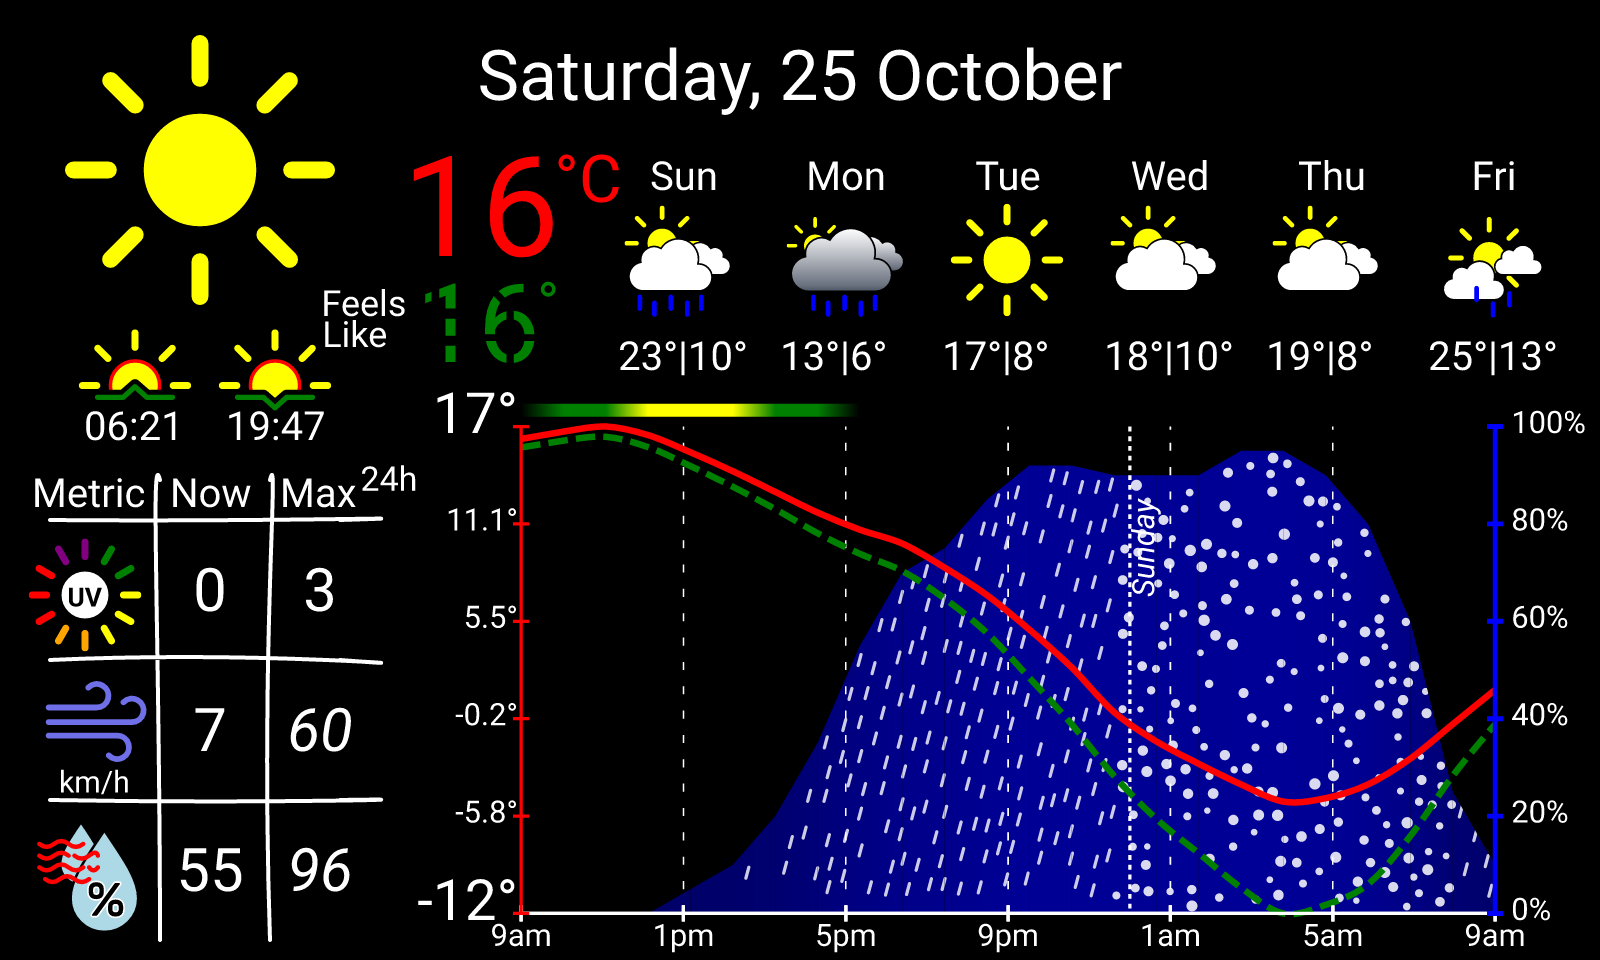
[colours]
background_colour   = "black"
text_colour         = "white"

x_axis_colour       = "white"
y_left_axis_colour  = "red"
y_right_axis_colour = "blue"

actual_temp_colour  = "red"
feels_like_colour   = "green"
rain_colour         = "blue"
Enable auto-update when a new release is available. This is enabled by default.
[release]
# Set to 0 to disable auto-updating
update_interval_days = 7
# Opt in to pre-release versions (requires update_interval_days > 0)
allow_pre_release_version = false
The dashboard can still work using cached data for a while if the API is unreachable. A diagnostic icon and message appears on the display when issues occur.
| Diagnostic Type | Priority | Icon |
|---|---|---|
| API Error | High |  |
| No Internet | Medium |  |
| Incomplete Data | Low |  |
| Update Failed | Low |  |
When multiple diagnostics occur, the highest priority diagnostic is displayed, lower priority ones are cascaded.
[0, 0, 0],        # Black
[255, 255, 255],  # White
[0, 255, 0],      # Green
[0, 0, 255],      # Blue
[255, 0, 0],      # Red
[255, 255, 0],    # Yellow
[255, 140, 0],    # Orange
Image generation is hardware-agnostic. Weather data is rendered to an SVG
via TinyTemplate, then rasterized to PNG with resvg. The same pipeline runs
on a Pi or a dev laptop, so cargo run on your machine shows exactly what
ships to the panel — no on-device-only rendering path to debug blind.
Degrades instead of failing. If the API is unreachable, the fetcher falls back to the last cached response and keeps rendering, surfacing a priority-ordered diagnostic icon instead of a blank display or a crash log nobody on a headless Pi will ever see.
Config, not code, for personalization. Colours, units, date format, and
axis behaviour are all TOML overrides layered on config/default.toml — no
fork needed to reskin the dashboard.
Backward-compatible by default. The binary can self-update in place on unattended Pi devices, so a newer binary routinely reads state (cached JSON, TOML config) written by an older one. New fields must tolerate absence rather than hard-fail a fetch.
Time is injected, not read. Time-dependent logic goes through a Clock
abstraction rather than calling the system clock directly, so tests and the
24-hour simulation script can
drive arbitrary times deterministically.
Contributions are welcome — see docs/CONTRIBUTING.md for dev setup, running tests, simulating dashboards, and troubleshooting.
more like this
鲜知贴:可复刻的 ESP32 墨水屏食材保鲜提醒器,包含 H5/Node.js/SQLite 服务端、C3/S3 固件、三色/四色屏渲染和 3D 打印外壳,支持公共托管、本地与自托管部署。
A python script that can annotate chess games in pgn file with static evaluation or search score of an engine, can anno…
search projects, people, and tags