agentlytics
Comprehensive analytics dashboard for AI coding agents — Cursor, Windsurf, Claude Code, VS Code Copilot, Zed, Antigravi…
JavaScript★ 555
A beautiful, zero-dependency command center for OpenClaw AI agents
 mudrii
git clone https://github.com/mudrii/openclaw-dashboard.gitmudrii/openclaw-dashboardA beautiful, zero-dependency command center for OpenClaw AI agents.
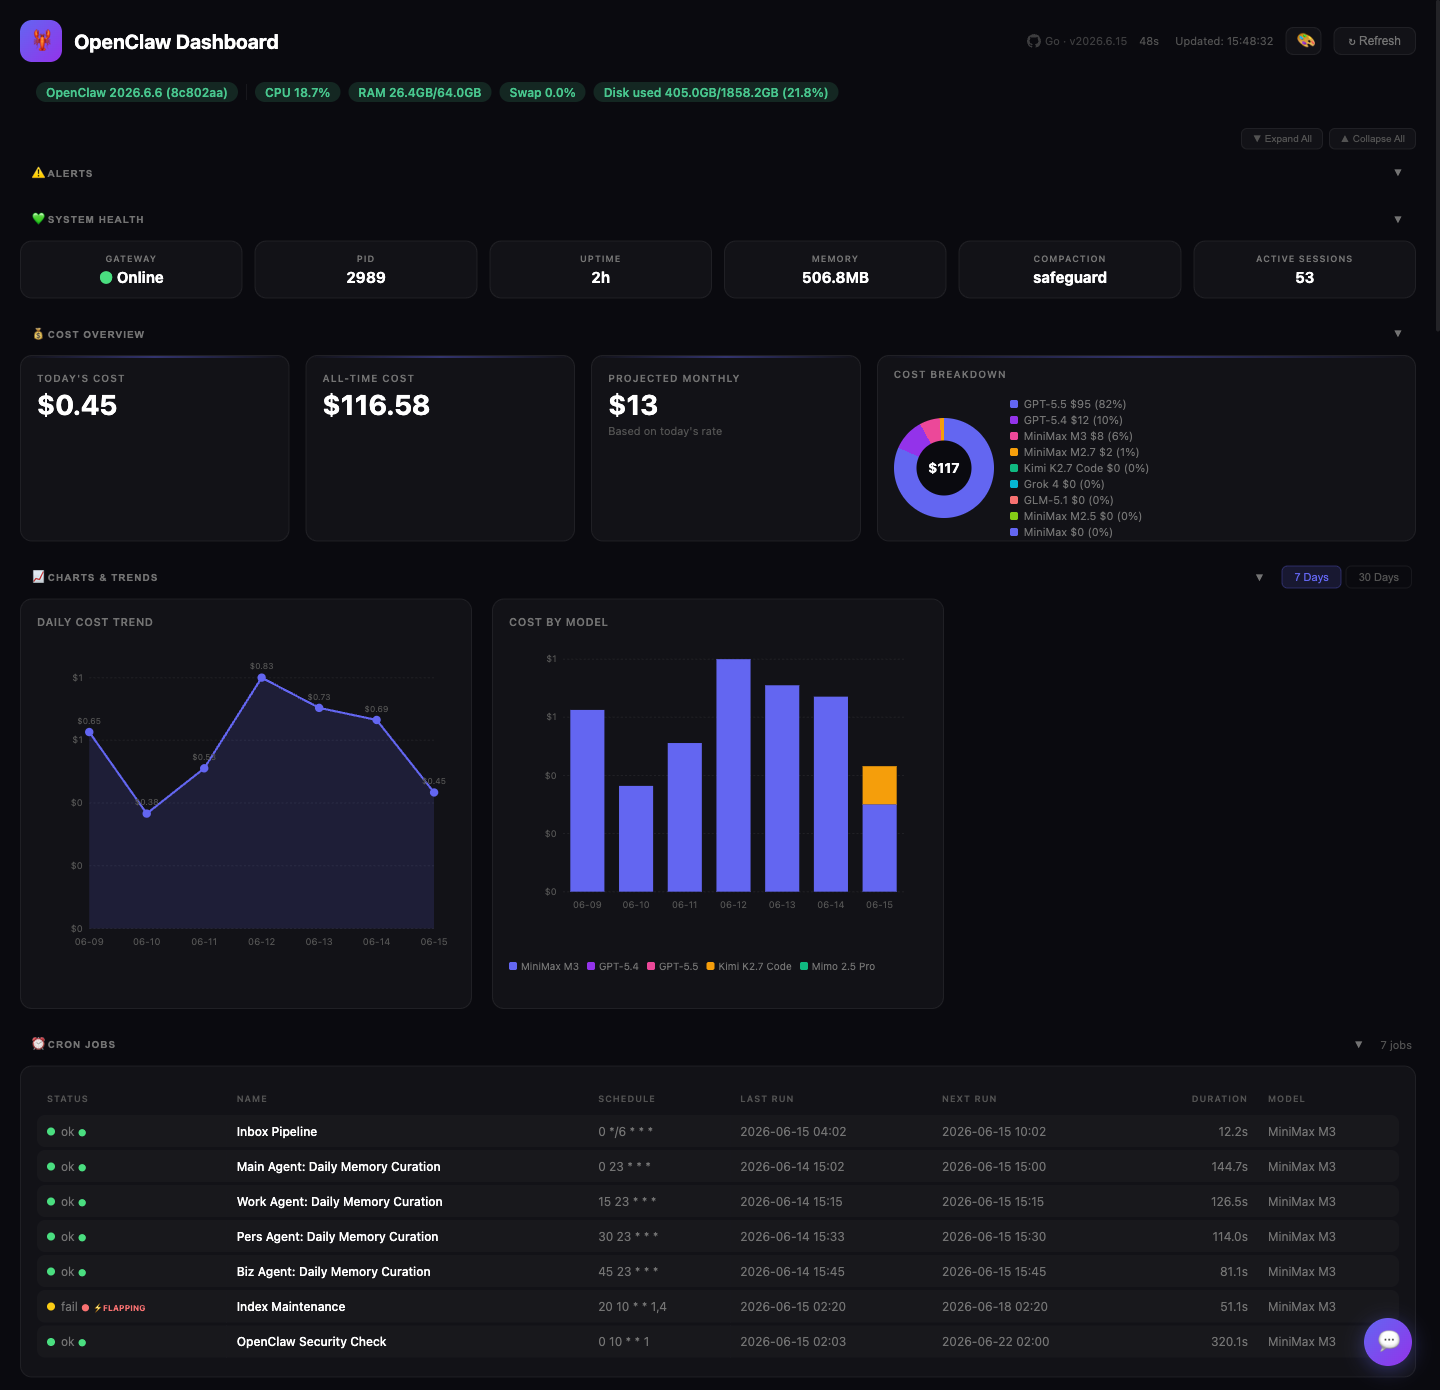
When you run OpenClaw seriously — multiple agents, dozens of cron jobs, sub-agents spawning sub-agents, several Telegram groups and Whatsapp, Slack, and Discord channels, 10+ models, multiple agents and sub-agents — information gets scattered fast.
The problem: there was no single place to answer the obvious questions:
The only way to answer these was digging through log files, running CLI commands, and mentally stitching together a picture from 5 different sources. That friction adds up.
The solution: a single local page that collects everything in one place — gateway health, costs, cron status, active sessions, sub-agent runs, model usage, git log — refreshed automatically, no login, no cloud, no external dependencies. Open a browser tab, get the full picture in seconds.
It's not trying to replace the OpenClaw CLI or Telegram interface. It's the at-a-glance overview layer that tells you whether everything is healthy and where your money and compute are going — so you can make decisions without hunting for data.
⚡FLAPPING badge for unstable jobsGET /api/refresh serves cached data.json immediately and triggers a debounced background refresh when needed/api/chat (429 + Retry-After)/api/system includes live gateway runtime state (liveness, readiness, failing deps, uptime, PID, memory) sourced from /healthz, /readyz, and openclaw status --json🟡 Gateway not ready: discord (or any failing dep) and auto-clears on recovery/readyz failing[], so idle-but-healthy channels stop looking dead and actually-failing ones (bad token, API down) show red; falls back to the session-activity heuristic when the probe is unavailableopenclaw status --json (event-loop/heartbeat require system.deepStatus)journalctl --user -u <unit>.service -o json (configurable via logs.systemdUnit)openclaw models list --json, so current and future models get real names and accurate context bars; the curated names win, the catalog fills unknown ids⚡FLAPPING) from consecutiveErrorsbrew install mudrii/tap/openclaw-dashboard
The Homebrew formula installs the binary and seeds a writable runtime directory at
~/.openclaw/dashboard on first run.
Homebrew upgrades preserve existing config.json and runtime themes.json, and
refresh the package-managed VERSION file automatically so openclaw-dashboard --version stays in sync with the installed formula.
Then run:
openclaw-dashboard --refresh   # generate data.json
openclaw-dashboard             # start server on http://localhost:8080
Download a release tarball — includes the binary plus runtime assets.
# macOS (Apple Silicon)
curl -L https://github.com/mudrii/openclaw-dashboard/releases/latest/download/openclaw-dashboard-darwin-arm64.tar.gz | tar xz
./openclaw-dashboard --port 8080

# macOS (Intel)
curl -L https://github.com/mudrii/openclaw-dashboard/releases/latest/download/openclaw-dashboard-darwin-amd64.tar.gz | tar xz
./openclaw-dashboard --port 8080

# Linux (x86_64)
curl -L https://github.com/mudrii/openclaw-dashboard/releases/latest/download/openclaw-dashboard-linux-amd64.tar.gz | tar xz
./openclaw-dashboard --port 8080

# Linux (ARM64 / Raspberry Pi)
curl -L https://github.com/mudrii/openclaw-dashboard/releases/latest/download/openclaw-dashboard-linux-arm64.tar.gz | tar xz
./openclaw-dashboard --port 8080
Verify download integrity:
archive=openclaw-dashboard-darwin-arm64.tar.gz
curl -LO "https://github.com/mudrii/openclaw-dashboard/releases/latest/download/${archive}"
curl -LO https://github.com/mudrii/openclaw-dashboard/releases/latest/download/checksums-sha256.txt
grep "  ${archive}$" checksums-sha256.txt | shasum -a 256 -c -
curl -fsSL https://raw.githubusercontent.com/mudrii/openclaw-dashboard/main/install.sh | bash
This will:
~/.openclaw/dashboardbrew upgrade mudrii/tap/openclaw-dashboard
After upgrading, verify the installed release with:
openclaw-dashboard --version
The binary has built-in service management — no shell scripts needed:
# Install and start as a system service (launchd on macOS, systemd on Linux)
openclaw-dashboard install

# With custom port and bind address
openclaw-dashboard install --port 9090 --bind 0.0.0.0

# Check status
openclaw-dashboard status

# Stop / start / restart
openclaw-dashboard stop
openclaw-dashboard start
openclaw-dashboard restart

# Remove the service (config and data are preserved)
openclaw-dashboard uninstall
All commands are also available under the service namespace:
openclaw-dashboard service install
openclaw-dashboard service status
openclaw-dashboard service uninstall
Homebrew users should use the built-in service commands above. The current tap
does not define a brew services formula service.
git clone https://github.com/mudrii/openclaw-dashboard.git
cd openclaw-dashboard
make build
./openclaw-dashboard --port 8080
The dashboard binds to 127.0.0.1 by default. Container deployments must
either opt into a non-loopback bind explicitly or share the host network
namespace — port-publishing alone won't work, because the container's own
loopback is private.
docker build -t openclaw-dashboard .

# Opt-in to LAN bind (sets OPENCLAW_DASHBOARD_ALLOW_NON_LOOPBACK=1):
docker run -p 8080:8080 \
  -e OPENCLAW_DASHBOARD_ALLOW_NON_LOOPBACK=1 \
  -v ~/.openclaw:/home/dashboard/.openclaw \
  openclaw-dashboard

# OR share host network (Linux only, preserves loopback-only design):
docker run --network=host \
  -v ~/.openclaw:/home/dashboard/.openclaw \
  openclaw-dashboard --bind 127.0.0.1 --port 8080
# Run directly
nix run github:mudrii/openclaw-dashboard

# Dev shell (Go + tools)
nix develop github:mudrii/openclaw-dashboard
The Nix package installs immutable defaults under its package share directory
and seeds the writable runtime directory at ~/.openclaw/dashboard on first run.
Click the 🎨 button in the header to switch themes instantly — no reload or server restart needed. Choice persists via localStorage.
| Theme | Type | Vibe |
|---|---|---|
| 🌙 Midnight | Dark | Original glass morphism (default) |
| 🏔️ Nord | Dark | Arctic blue, calm, great for long sessions |
| 🌸 Catppuccin Mocha | Dark | Warm pastels, easy on eyes |
| ☀️ GitHub Light | Light | Clean, professional, high readability |
| 🌅 Solarized Light | Light | Scientifically optimized contrast |
| 🌻 Catppuccin Latte | Light | Soft pastels |
Add your own themes by editing themes.json in your runtime directory. Default themes
ship from assets/runtime/themes.json. Each theme defines 19 CSS color variables:
{
  "my-theme": {
    "name": "My Theme",
    "type": "dark",
    "icon": "🎯",
    "colors": {
      "bg": "#1a1a2e",
      "surface": "rgba(255,255,255,0.03)",
      "surfaceHover": "rgba(255,255,255,0.045)",
      "border": "rgba(255,255,255,0.06)",
      "accent": "#e94560",
      "accent2": "#0f3460",
      "green": "#4ade80",
      "yellow": "#facc15",
      "red": "#f87171",
      "orange": "#fb923c",
      "purple": "#a78bfa",
      "text": "#e5e5e5",
      "textStrong": "#ffffff",
      "muted": "#737373",
      "dim": "#525252",
      "darker": "#404040",
      "tableBg": "rgba(255,255,255,0.025)",
      "tableHover": "rgba(255,255,255,0.05)",
      "scrollThumb": "rgba(255,255,255,0.1)"
    }
  }
}
cmd/openclaw-dashboard/      CLI entrypoint
internal/appconfig/          config loading
internal/appruntime/         runtime-dir resolution
internal/appchat/            chat prompt + gateway client
internal/apprefresh/         data collector
internal/appserver/          HTTP server
internal/appsystem/          metrics and runtime probes
web/index.html              embedded frontend
assets/runtime/             runtime defaults
data.json                   generated dashboard data
Endpoints:
| Endpoint | Method | Description |
|---|---|---|
/ |
GET | Serves embedded web/index.html with theme/version injection |
/api/refresh |
GET | Stale-while-revalidate data.json (instant response, background refresh) |
/api/chat |
POST | AI chat via OpenClaw gateway (10 req/min rate limit) |
/api/system |
GET | Live host metrics (CPU/RAM/Swap/Disk) + gateway status |
/api/logs |
GET | Merged tail view of configured dashboard log sources |
/api/errors |
GET | Aggregated warning/error signatures for the dashboard error feed |
| Feature | Details |
|---|---|
| Serves frontend | Embedded from web/index.html (//go:embed) |
/api/refresh |
Stale-while-revalidate (instant response) |
/api/chat |
Mtime-cached data.json (dual raw+parsed cache) |
/api/system |
SystemService — parallel collectors, RWMutex cache |
| Static files | Allowlisted only (themes.json, optional favicons) |
| Rate limiting | 10 req/min per-IP on /api/chat |
| HTTP timeouts | Read 30s / Write 90s / Idle 120s |
| Pre-warm | Runs --refresh at startup |
| Shutdown | Graceful (drains requests, 5s timeout) |
| Gateway limit | 1MB response cap |
| Tests | make test |
When you open the dashboard, the embedded frontend calls /api/refresh. The server returns the current data.json immediately, and if the refresh debounce window has expired it starts a background refresh to rebuild the file from your OpenClaw installation. If data.json does not exist yet, the handler waits briefly for the first refresh before returning. No cron jobs are required.
The /api/chat endpoint accepts {"question": "...", "history": [...]} and forwards a stateless request to the OpenClaw gateway's OpenAI-compatible /v1/chat/completions endpoint, with a system prompt built from live data.json.
The entire frontend lives in a single <script> tag inside web/index.html — zero dependencies, no build step. The JS is organized into small plain-object modules:
┌─────────────────────────────────────────────┐
│                 App.init()                   │
│       (wires everything, starts timer)       │
└───────┬──────────────┬──────────────┬───────┘
        │              │              │
   ┌────▼────┐   ┌─────▼─────┐  ┌────▼─────┐
   │  State  │◄──│ DataLayer │  │  Theme   │
   │ (truth) │   │  (fetch)  │  │ (colors) │
   └────┬────┘   └───────────┘  └──────────┘
        │
   ┌────▼────────────┐
   │  DirtyChecker   │
   │ (what changed?) │
   └────┬────────────┘
        │
   ┌────▼────┐   ┌────────┐
   │Renderer │   │  Chat  │
   │  (DOM)  │   │  (AI)  │
   └─────────┘   └────────┘
| Module | Responsibility |
|---|---|
| State | Single source of truth — holds data, prev, tabs, countdown, and tab state. Produces immutable deep-frozen snapshots for each render cycle. |
| DataLayer | Stateless fetch with _reqId counter for out-of-order protection. Returns parsed JSON or null. |
| LogTail | Incremental log polling, filtering, pause/fast modes, and merged log rendering. |
| ErrorFeed | Error-signature feed derived from /api/errors, including sort/window controls. |
| DirtyChecker | Computes 13 boolean dirty flags by comparing current snapshot against State.prev. Uses stableSnapshot() to strip volatile timestamps from crons/sessions. |
| Renderer | Pure DOM side-effects. Receives frozen snapshot + pre-computed flags, dispatches to 14 section renderers. Owns the agent hierarchy tree, recent-finished buffer, and all chart SVG rendering. |
| SystemBar | Polls /api/system, renders host/runtime health, and feeds gateway readiness state back into the main health and alert panels. |
| Theme | Self-contained theme engine — loads themes.json, applies CSS variables, persists choice to localStorage. |
| Sections | Collapsible-section state and persistence. |
| Chat | AI chat panel — manages history, sends stateless requests to /api/chat. |
| OCUI / App | UI command handlers plus wiring layer — theme, timers, data refresh, render scheduling, and event handlers. |
All inline onclick handlers route through window.OCUI — a thin namespace that calls State.setTab() / App.renderNow(). No bare globals remain outside the module objects and top-level utilities ($, esc, safeColor, relTime).
See ARCHITECTURE.md for the full specification.
Edit config.json in your dashboard runtime directory. In a source checkout this
is usually the repo root. For install.sh installs it is
${OPENCLAW_HOME:-~/.openclaw}/dashboard/config.json; with Homebrew and Nix
package installs it is ~/.openclaw/dashboard/config.json.
{
  "bot": {
    "name": "My Bot",
    "emoji": "🤖"
  },
  "theme": {
    "preset": "nord"
  },
  "refresh": {
    "intervalSeconds": 30
  },
  "server": {
    "port": 8080,
    "host": "127.0.0.1"
  },
  "ai": {
    "enabled": true,
    "gatewayPort": 18789,
    "model": "your-model-id",
    "maxHistory": 6,
    "dotenvPath": "~/.openclaw/.env"
  },
  "system": {
    "enabled": true,
    "pollSeconds": 10,
    "diskPath": "/",
    "cpu":  { "warn": 80, "critical": 95 },
    "ram":  { "warn": 75, "critical": 90 },
    "swap": { "warn": 80, "critical": 95 },
    "disk": { "warn": 85, "critical": 95 }
  }
}
| Key | Default | Description |
|---|---|---|
bot.name |
"OpenClaw Dashboard" |
Dashboard title |
bot.emoji |
"🦞" |
Avatar emoji |
theme.preset |
"midnight" |
Default theme (midnight, nord, catppuccin-mocha, github-light, solarized-light, catppuccin-latte) |
timezone |
"UTC" |
IANA timezone for all time calculations |
refresh.intervalSeconds |
30 |
Debounce interval for refresh |
alerts.dailyCostHigh |
50 |
Daily cost threshold for high alert ($) |
alerts.dailyCostWarn |
20 |
Daily cost threshold for warning alert ($) |
alerts.contextPct |
80 |
Context usage % threshold for alerts |
alerts.memoryMb |
640 |
Gateway memory threshold (MB) for alerts |
server.port |
8080 |
Server port (also --port / -p flag or DASHBOARD_PORT env) |
server.host |
"127.0.0.1" |
Server bind address (also --bind / -b flag or DASHBOARD_BIND env) |
ai.enabled |
true |
Enable/disable the AI chat panel and /api/chat endpoint |
ai.gatewayPort |
18789 |
Port of your OpenClaw gateway |
ai.model |
"" |
Model to use for chat — any model ID registered in your OpenClaw gateway |
ai.maxHistory |
6 |
Number of previous messages to include for context |
ai.dotenvPath |
"~/.openclaw/.env" |
Path to .env file containing OPENCLAW_GATEWAY_TOKEN |
system.enabled |
true |
Enable/disable the top metrics bar and /api/system endpoint |
system.pollSeconds |
10 |
How often the browser polls /api/system (seconds, 2–60) |
system.metricsTtlSeconds |
10 |
Server-side metrics cache TTL (seconds) |
system.versionsTtlSeconds |
300 |
Version/gateway probe cache TTL (seconds) |
system.gatewayTimeoutMs |
5000 |
Timeout for gateway liveness probe (ms) |
system.coldPathTimeoutMs |
8000 |
Overall budget for a cold /api/system collection (ms) |
system.cpuTimeoutMs |
6000 |
Timeout for CPU sampling on macOS and Linux (ms) |
system.deepStatus |
false |
Opt into openclaw status --json --deep for event-loop + last-heartbeat blocks (slower; lean status already gives task queue + plugin-compat + channel summary) |
system.gatewayPort |
18789 |
Gateway port for health probes (defaults to ai.gatewayPort) |
logs.systemdUnit |
"openclaw-gateway" |
Systemd --user unit for the Linux journald log fallback (env OPENCLAW_SYSTEMD_UNIT overrides; OPENCLAW_PROFILE adds a suffix) |
system.diskPath |
"/" |
Filesystem path to report disk usage for |
system.warnPercent |
70 |
Global warn threshold (% used) — overridden by per-metric values |
system.criticalPercent |
85 |
Global critical threshold (% used) — overridden by per-metric values |
system.cpu.warn |
80 |
CPU warn threshold (%) |
system.cpu.critical |
95 |
CPU critical threshold (%) |
system.ram.warn |
80 |
RAM warn threshold (%) |
system.ram.critical |
95 |
RAM critical threshold (%) |
system.swap.warn |
80 |
Swap warn threshold (%) |
system.swap.critical |
95 |
Swap critical threshold (%) |
system.disk.warn |
80 |
Disk warn threshold (%) |
system.disk.critical |
95 |
Disk critical threshold (%) |
Full key list, env-var overrides, and the security policy (loopback enforcement, CSP headers, gateway token redaction) live in docs/CONFIGURATION.md. Maintainer infrastructure tasks (flake.lock, Docker digest refresh, GitHub branch protection) are in docs/INFRA-CHECKLIST.md.
The top bar shows live host metrics — always visible above the alerts banner.
Metrics displayed:
| Pill | What it shows |
|---|---|
| CPU | Usage % (current delta, not boot average) |
| RAM | Used / Total GB |
| Swap | Usage % |
| Disk | Used / Total GB (used %) |
| OpenClaw | Installed version |
| GW | Gateway status (online / offline) |
Colour coding:
Per-metric config example (config.json):
"system": {
  "enabled": true,
  "pollSeconds": 10,
  "diskPath": "/",
  "cpu":  { "warn": 80, "critical": 95 },
  "ram":  { "warn": 75, "critical": 90 },
  "swap": { "warn": 60, "critical": 80 },
  "disk": { "warn": 85, "critical": 95 }
}
Platform support:
top -l 2 (current delta), RAM via vm_stat, Swap via sysctl vm.swapusage, Disk via statfs/proc/stat (200ms dual-sample including steal field), RAM+Swap via /proc/meminfo (single read, shared), Disk via statfsAPI endpoint: GET /api/system — returns JSON with all metrics, thresholds, version info, and the openclaw runtime block. Includes stale-serving semantics (returns cached data immediately while refreshing in background).
openclaw block in /api/system — provides live gateway runtime state beyond what the refresh collector gathers:
| Field | Description |
|---|---|
openclaw.gateway.live |
true when /healthz returns 200 |
openclaw.gateway.ready |
true when /readyz indicates all deps ready |
openclaw.gateway.uptimeMs |
Process uptime in milliseconds (from /healthz) |
openclaw.gateway.failing |
Array of failing dependency names from /readyz |
openclaw.gateway.healthEndpointOk |
Whether /healthz endpoint responded |
openclaw.gateway.readyEndpointOk |
Whether /readyz endpoint responded |
openclaw.status.currentVersion |
Installed OpenClaw version |
openclaw.status.latestVersion |
Latest published version (from npm) |
openclaw.status.connectLatencyMs |
Gateway connection latency (ms) |
openclaw.status.tasks |
Task-queue summary: total, active, terminal, failures, byStatus, byRuntime (lean status) |
openclaw.status.eventLoop |
Event-loop health: degraded, reasons, utilization, delayP99Ms, … (deep status only — system.deepStatus) |
openclaw.status.pluginCompatibility |
Plugin-compat warnings {count, warnings} (omitted when empty) |
openclaw.status.lastHeartbeat |
Last heartbeat {ts, status, channel, …} (deep status only) |
openclaw.status.channelSummary |
Pre-formatted channel status lines (lean status) |
openclaw.freshness.gateway |
RFC3339 timestamp of last successful gateway probe |
openclaw.freshness.status |
RFC3339 timestamp of last successful status probe |
The chat panel requires:
chatCompletions endpoint enabled:
"gateway": {
  "http": { "endpoints": { "chatCompletions": { "enabled": true } } }
}
OPENCLAW_GATEWAY_TOKEN set in your .env file (defaults to ~/.openclaw/.env)The chat is stateless — each question is sent directly to the gateway with a system prompt built from live data.json. No agent memory or tools bleed in.
See docs/CONFIGURATION.md for full details.
If an OpenClaw agent handles public X/Twitter work, install TweetClaw as the action plugin and use OpenClaw Dashboard to watch the matching agent session, cron status, token usage, configured skills, and cost trend while it runs.
openclaw plugins install @xquik/tweetclaw
TweetClaw covers API-backed tweet search, reply search, follower export, user lookup, media upload/download, direct messages, monitors, webhooks, giveaway draws, and approval-gated posts or replies. See the GitHub repo, npm package, and ClawHub listing.
Full dashboard view — all sections at a glance:
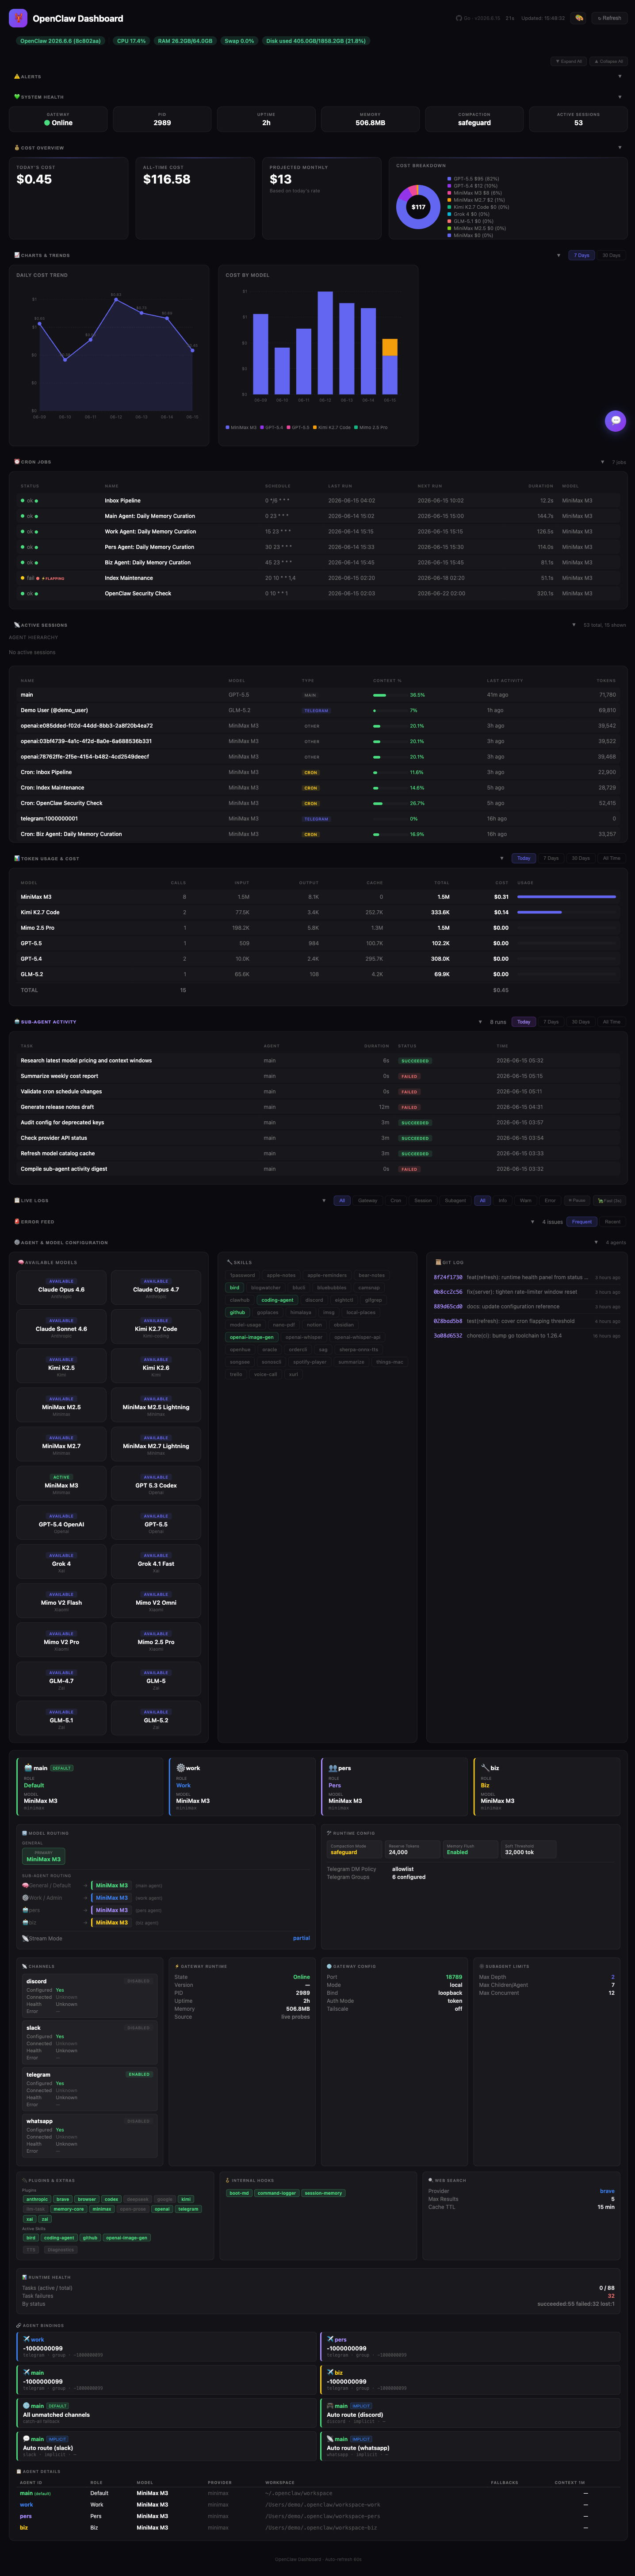
Real-time bot status, gateway uptime, memory usage, active session count, today's cost, all-time spend, projected monthly cost, and a per-model cost breakdown donut chart. Smart alert banners surface high costs, failed crons, and context overflows automatically.
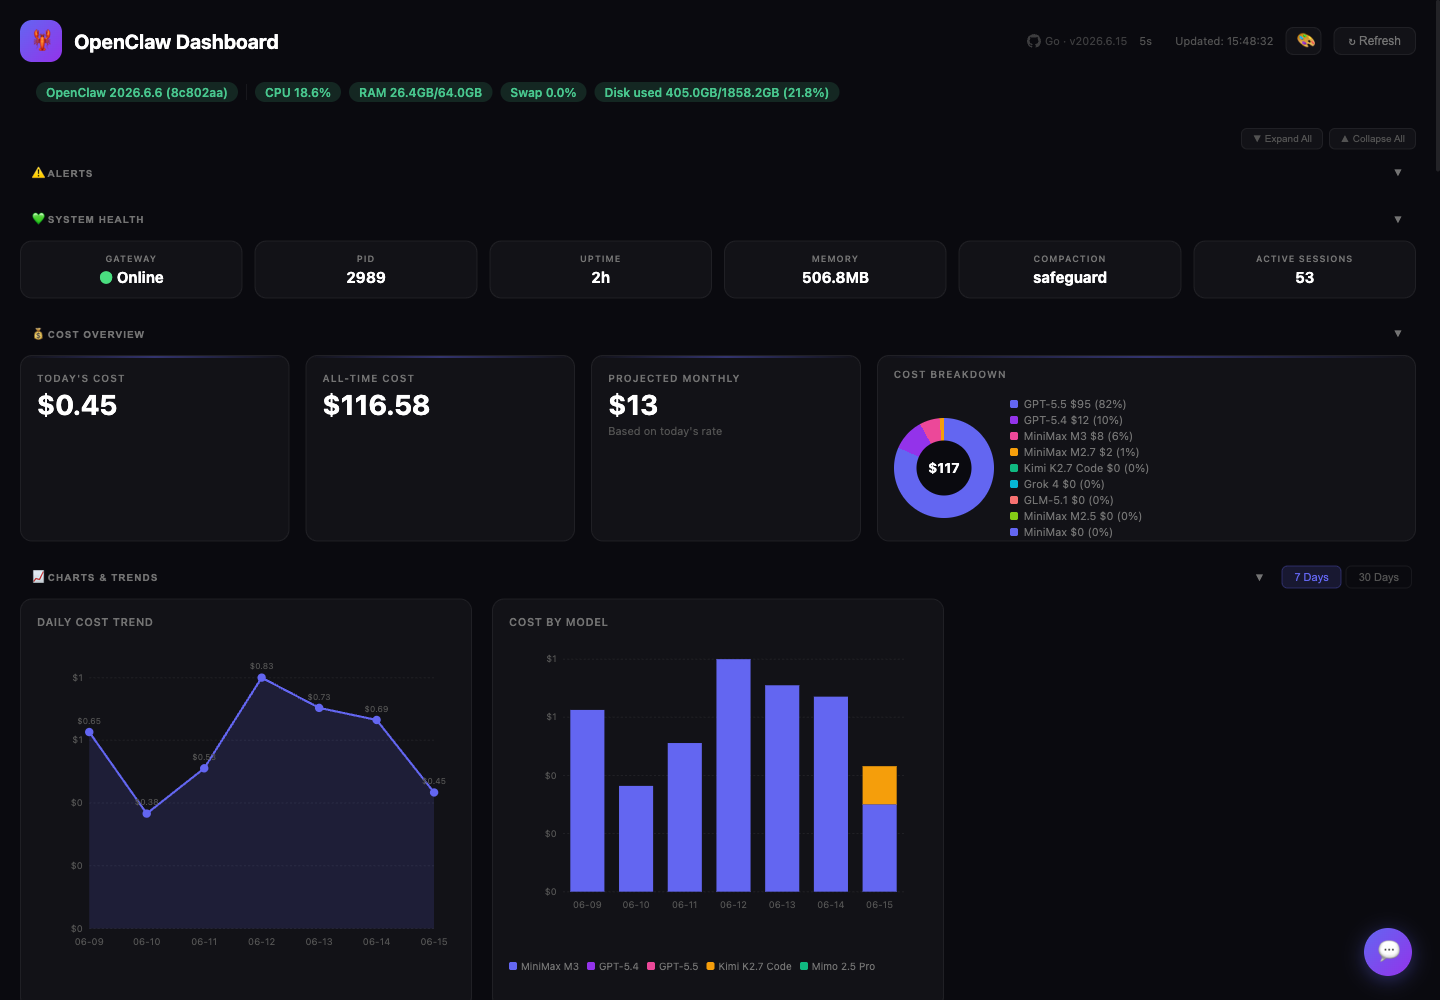
Two visible SVG charts with 7d/30d toggle: cost trend over time and per-model cost breakdown bars. A sub-agent activity chart implementation remains hidden until the task store exposes cost/token data again. No external chart libraries — pure inline SVG.
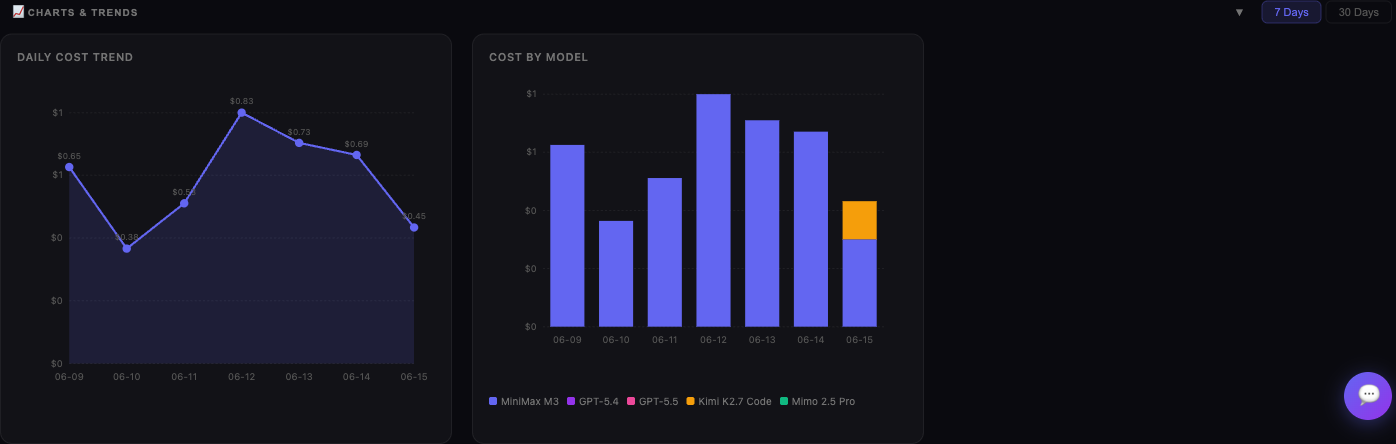
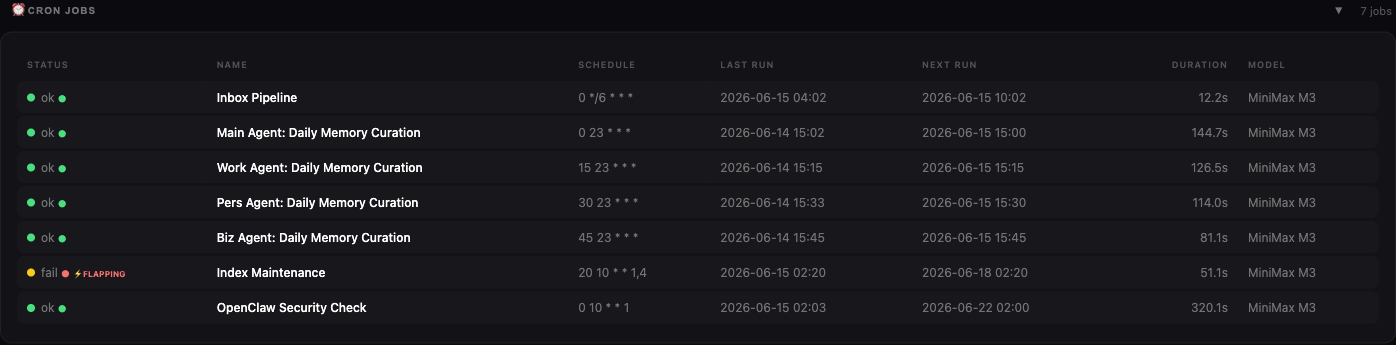
All scheduled jobs with status badges (active/idle/error), schedule expression, last run time, next run, duration, and the model used. A delivery-outcome dot shows whether the job actually delivered output, and a ⚡FLAPPING badge flags jobs with repeated consecutive errors. At-a-glance view of your automation health.
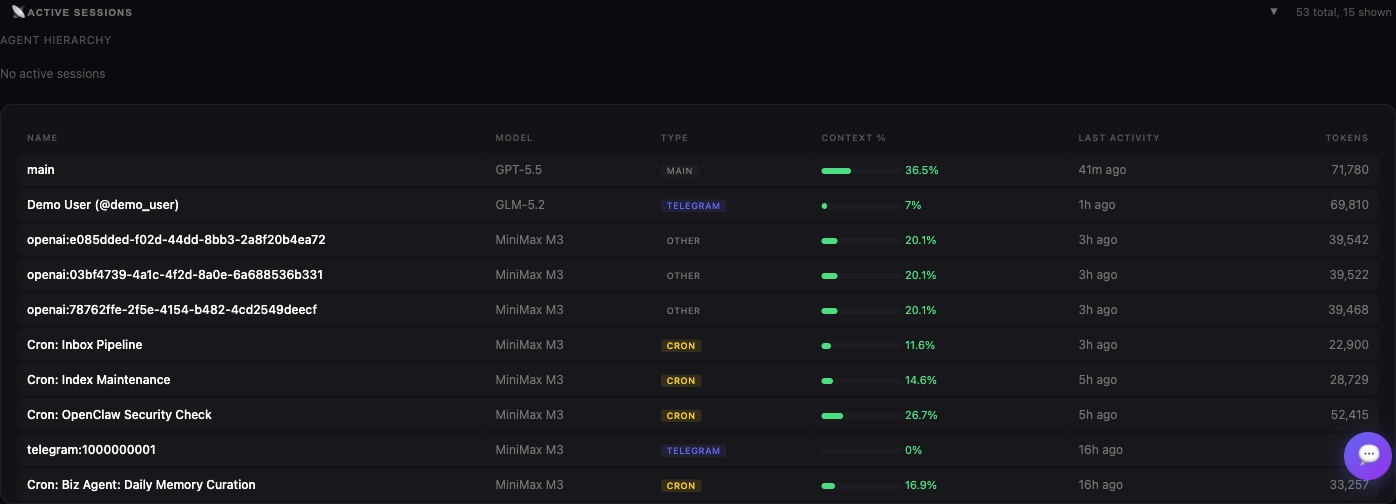
Live sessions with model, type badges (DM / group / subagent), context usage %, and token count. Above the session list: a visual agent hierarchy tree showing parent → sub-agent → sub-sub-agent relationships with live/idle status and trigger labels — updated every refresh.
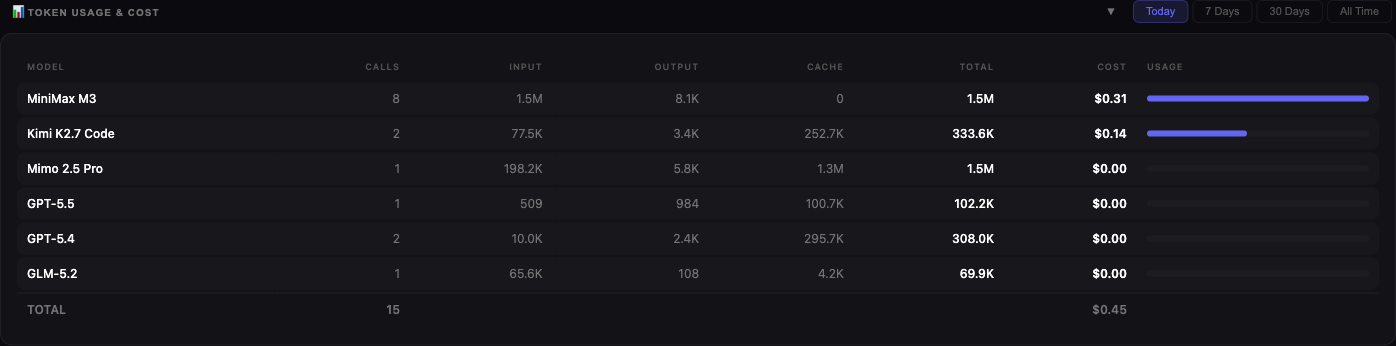
Per-model token and cost breakdown with 7d / 30d / all-time tabs. Includes input tokens, output tokens, cache reads, and total cost per model — sortable at a glance.
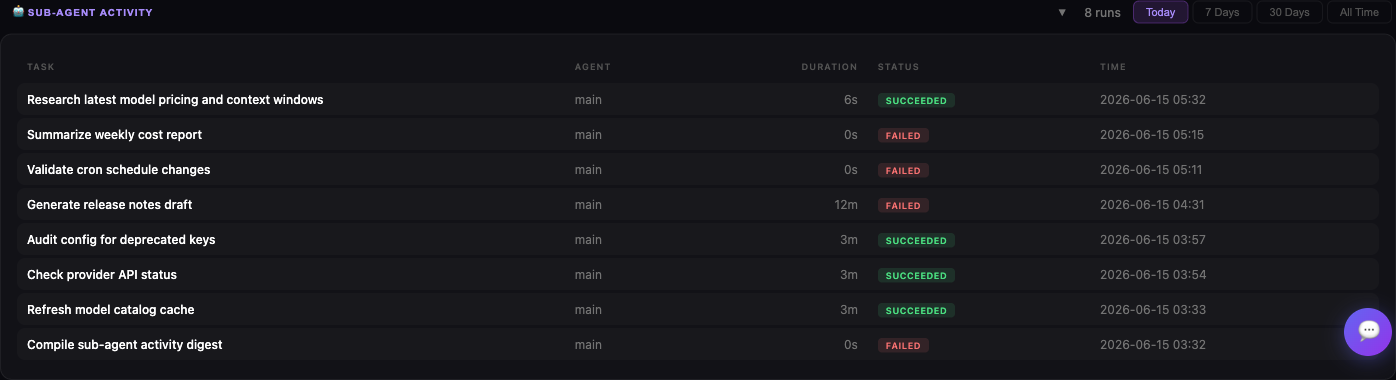
All sub-agent runs with agent, task, status, and duration, across Today/7d/30d/all-time tabs. Runs come from OpenClaw's durable task store (openclaw tasks list --runtime subagent); per-run cost and token usage are not exposed by that store (and the zero-dependency build cannot read the gateway SQLite directly), so they are not shown. Useful for tracking which tasks spawn the most agents and how they fare.
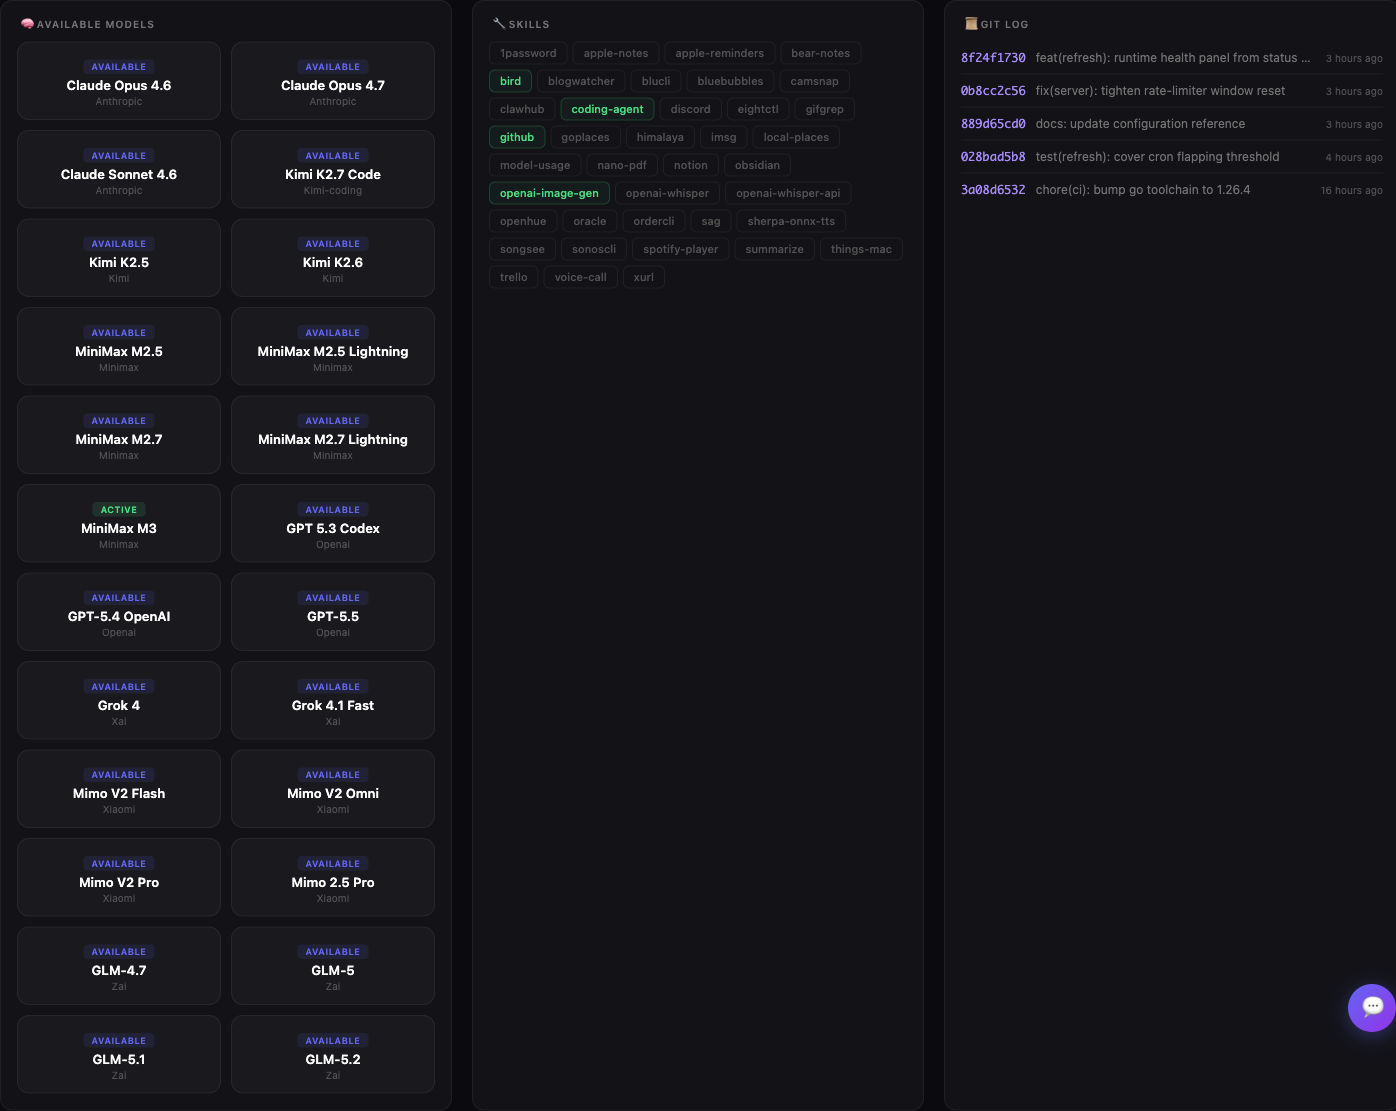
Quick reference panel showing all configured models, active skills, and the last 5 git commits from your OpenClaw workspace — so you always know what's deployed.
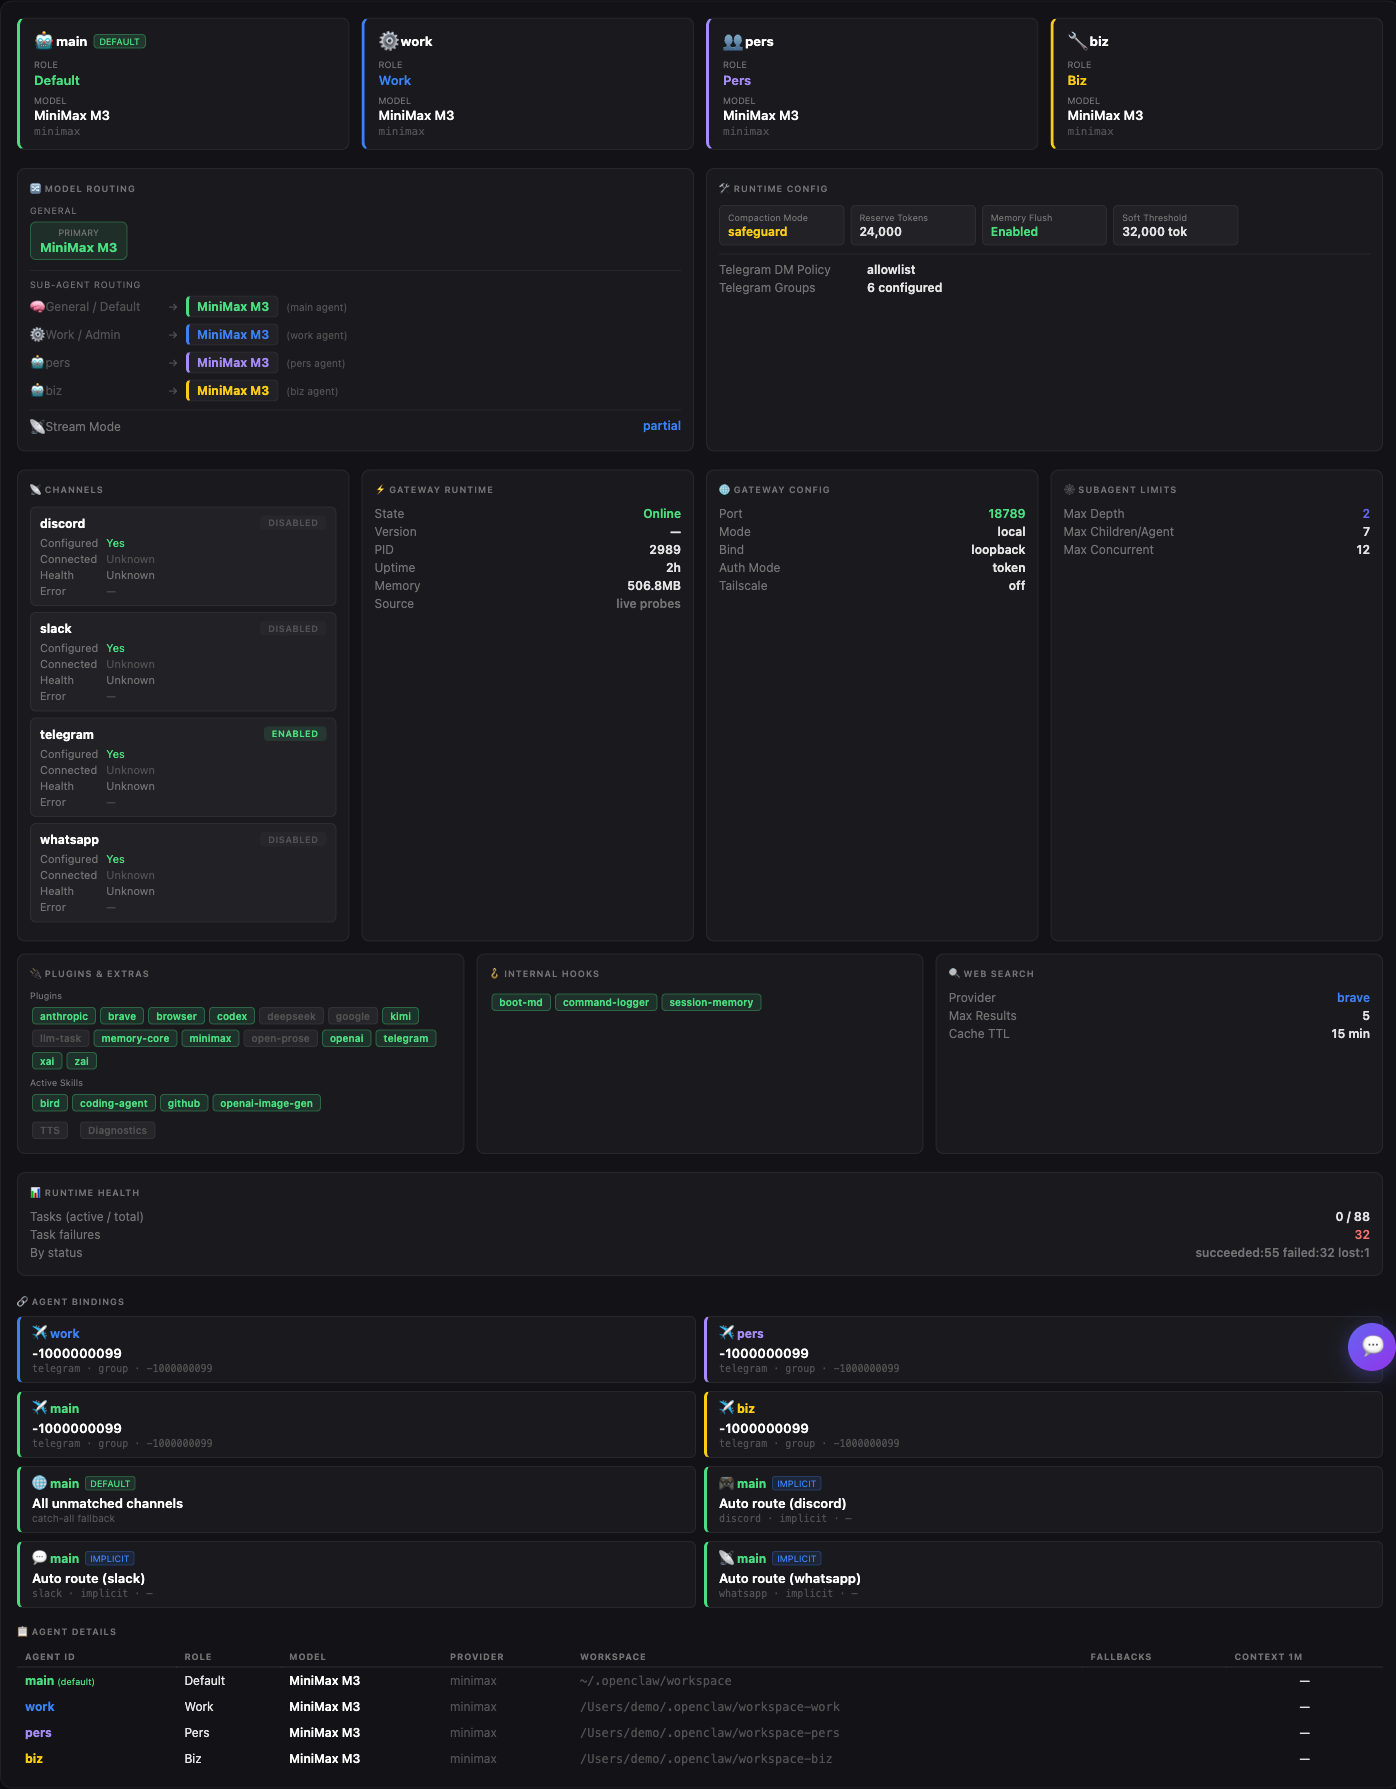
Full agent setup at a glance: model routing chain (primary → fallbacks), sub-agent routing by purpose (General / Dev+Coding / Work), agent details table with per-agent fallbacks, agent bindings with resolved group names, runtime config (compaction, memory flush), and subagent limits (max depth, max children/agent).
openclaw-dashboard uninstall
This stops the service, removes the LaunchAgent (macOS) or systemd unit (Linux), and preserves all config and data at ~/.openclaw/dashboard.
To also remove all data:
openclaw-dashboard uninstall
rm -rf ~/.openclaw/dashboard
Or using the uninstall script to remove the runtime directory as well:
./uninstall.sh
bash (only needed if using the optional refresh.sh wrapper script, not required for the binary itself)~/.openclaw (docs)See CONTRIBUTING.md for guidelines.
MIT License — see LICENSE
Made with 🦞 for the OpenClaw community
more like this
Comprehensive analytics dashboard for AI coding agents — Cursor, Windsurf, Claude Code, VS Code Copilot, Zed, Antigravi…
meine 🌒 - A CLI file manager and system utility built with Textual. It combines intuitive command parsing with rich t…
search projects, people, and tags