picking-route
Improve Warehouse Productivity using Order Batching
 samirsaci
Improve Warehouse Productivity using Order Batching with Python 📦
In a Distribution Centre (DC), walking time between locations during the picking route can account for 60%-70% of an operator’s working time. Reducing this walking time is the most effective way to increase your DC overall productivity.
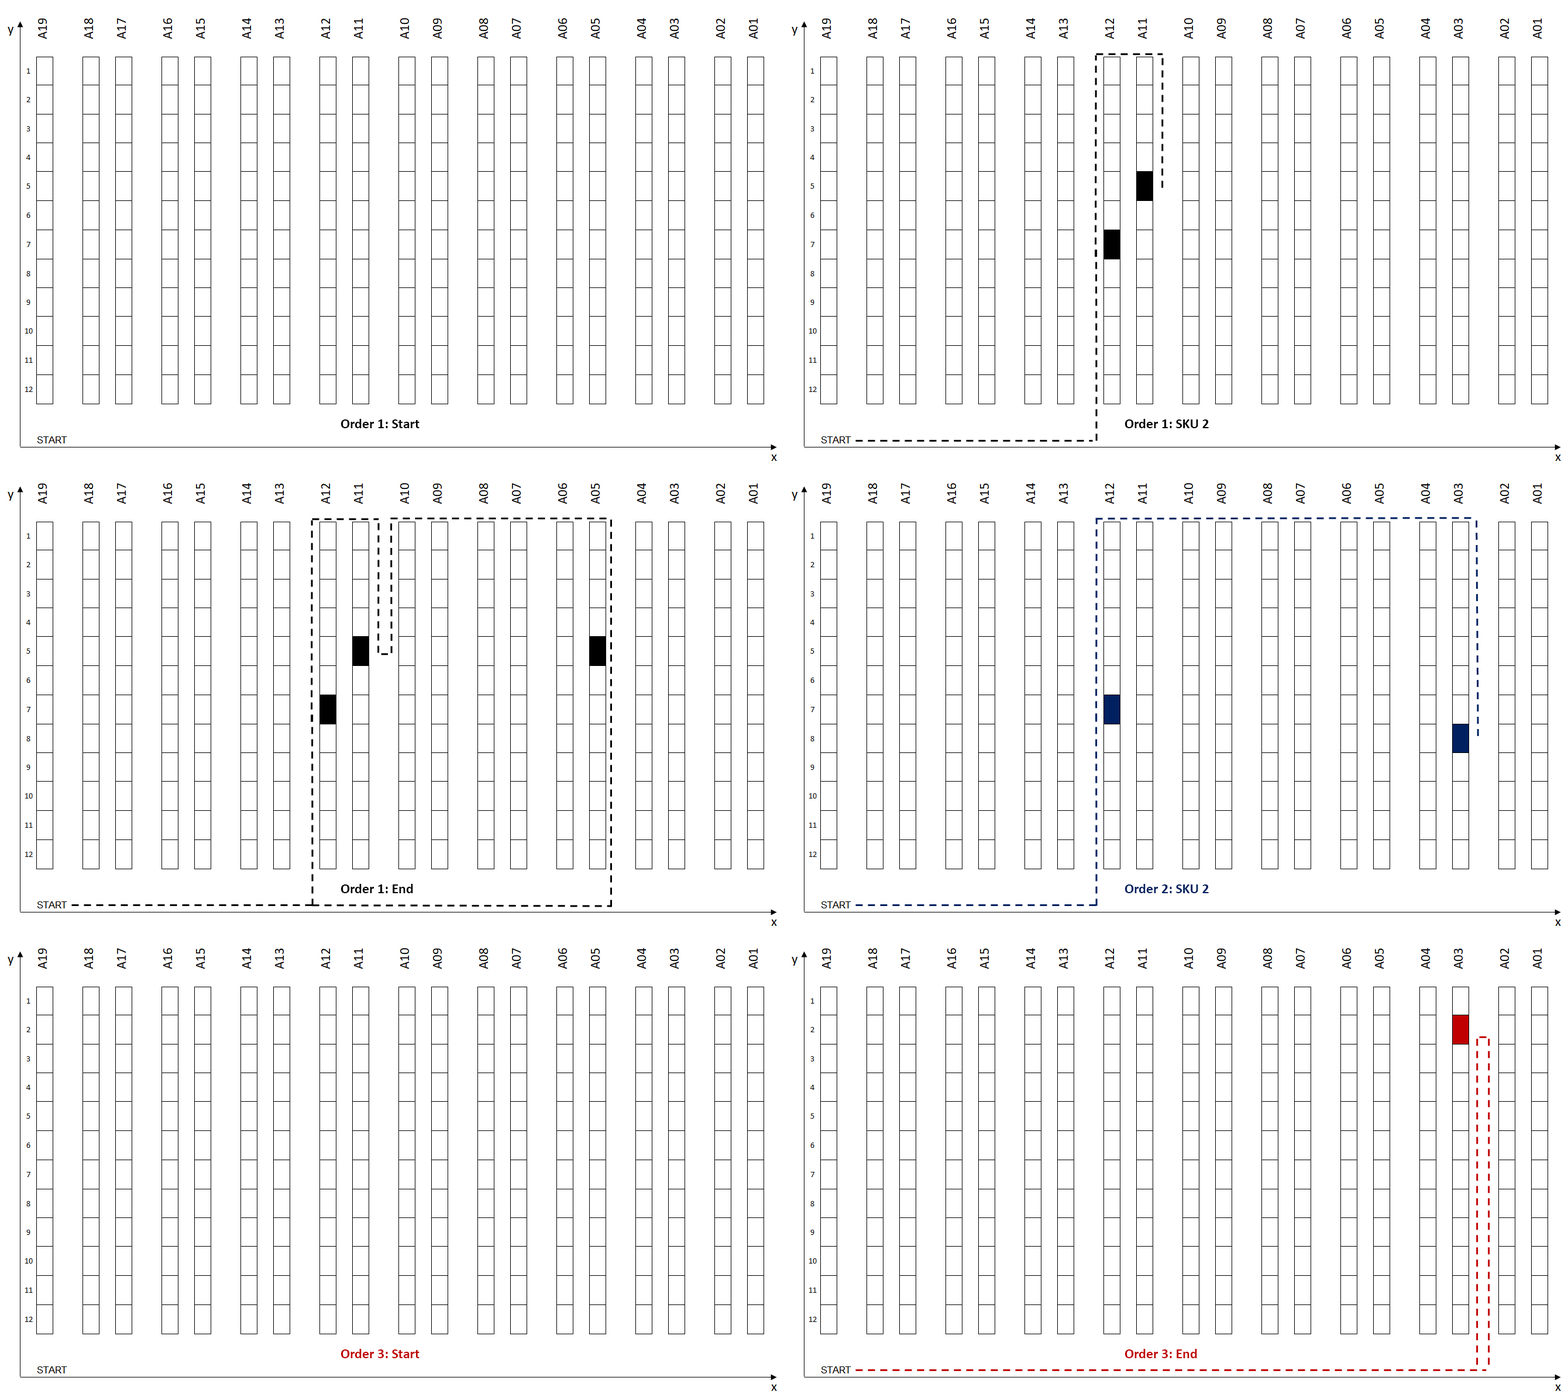
Scenario 1: Picking routes with 1 order picked per wave
I have published a series of articles proposing an approach to design a model that simulates the impact of multiple picking processes and routing methods to identify optimal order picking using the Single Picker Routing Problem (SPRP) for a two-dimensional warehouse model (axis-x, axis-y).
SPRP is a specific application of the general Travelling Salesman Problem (TSP) answering the question:
“Given a list of storage locations and the distances between each pair of locations, what is the shortest possible route that visits each storage location and returns to the depot ?”
This repo contains a ready-to-use Streamlit App designed for Logistics Engineers to test these different strategies with their own dataset of order line records (see the expected data format in Load the data).
⚡ Quick Start
With uv (manages Python and dependencies automatically):
uv run streamlit run app.py
With Docker:
docker compose up --build
Then open http://localhost:8501 — details in the Build the application locally section below.
Understand the theory behind 📜
- Improve Warehouse Productivity using Order Batching with Python - Article
- Improve Warehouse Productivity using Spatial Clustering with Python Scipy - Article
- Design Pathfinding Algorithm using Google AI to Improve Warehouse Productivity - Article
Picking Route Optimisation 🚶♂️
💾 Initial: prepare order lines datasets with picking locations
Based on your actual warehouse layout, storage locations are mapped with 2-D (x, y) coordinates that will be used to measure walking distance.
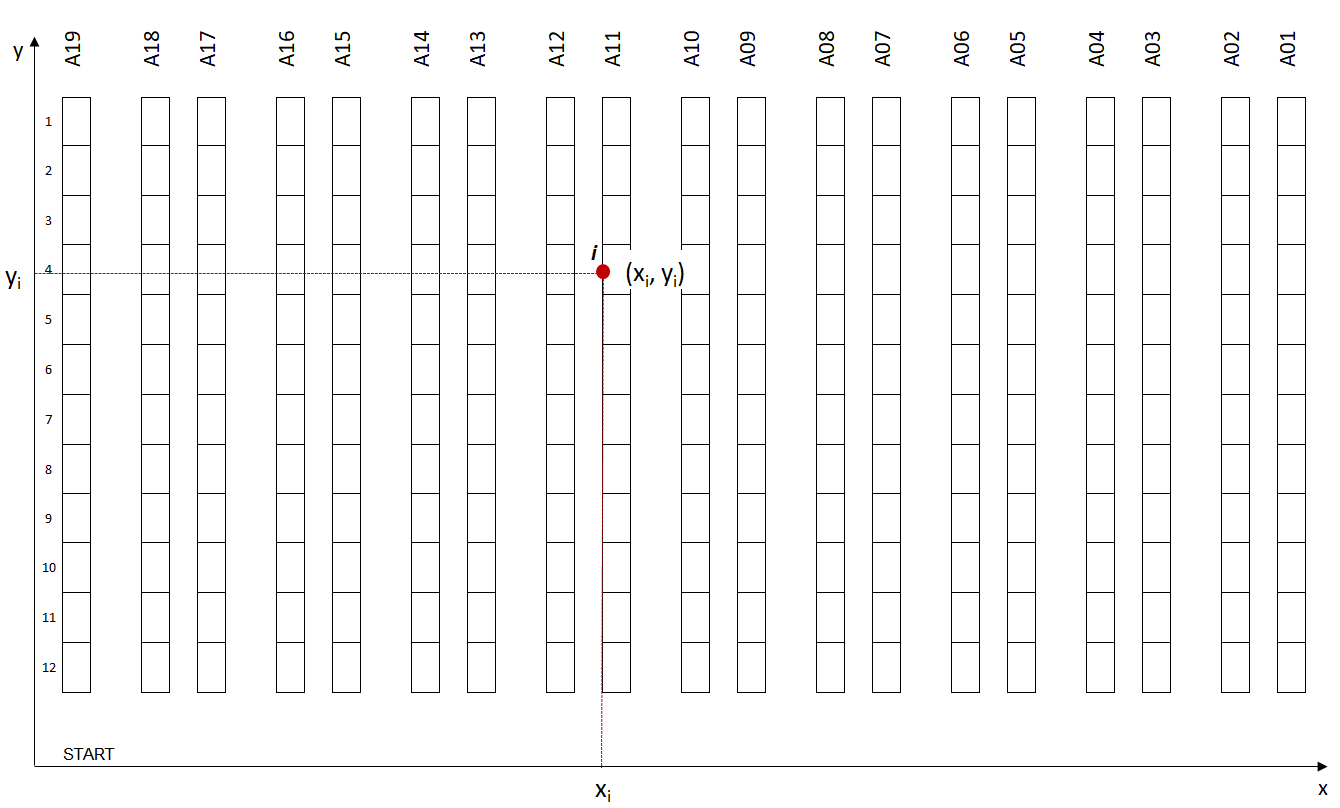
Warehouse Layout with 2D Coordinates
Every storage location must be linked to a Reference using Master Data. (For instance, reference #123129 is located in coordinate (xi, yi)). You can then associate every order line to a geographical location for picking.
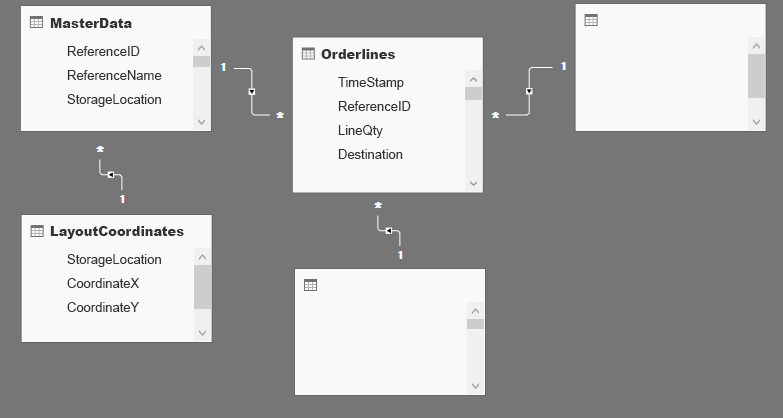
Database Schema
Order lines can be extracted from your WMS Database. This table should be joined with the Master Data table to link each order line to a storage location and specify its (x, y) coordinates in your warehouse. Extra tables can be added to include more parameters in your model, like (Destination, Delivery lead time, Special Packing, ..).
🧪 Experiment 1: Impacts of wave picking on the pickers' walking distance?
For more information and details about calculation: Article
✔️ Problem Statement
For this study, we will use an E-Commerce-type DC where items are stored on 4-level shelves. These shelves are organized in multiple rows (Row#: 1 … n) and aisles (Aisle#: A1 … A_n).

Different routes between two storage locations in the warehouse
- Item Dimensions: Small and light dimensions of items
- Picking Cart: lightweight picking cart with a capacity of 10 orders
- Picking Route: Picking Route starts and ends at the exact location
Scenario 1, the worst in terms of productivity, can be easily optimised because of
- Locations: Orders #1 and #2 have common picking locations
- Zones: orders have picking locations in a common zone
- Single-line Orders: items_picked/walking_distance efficiency is very low
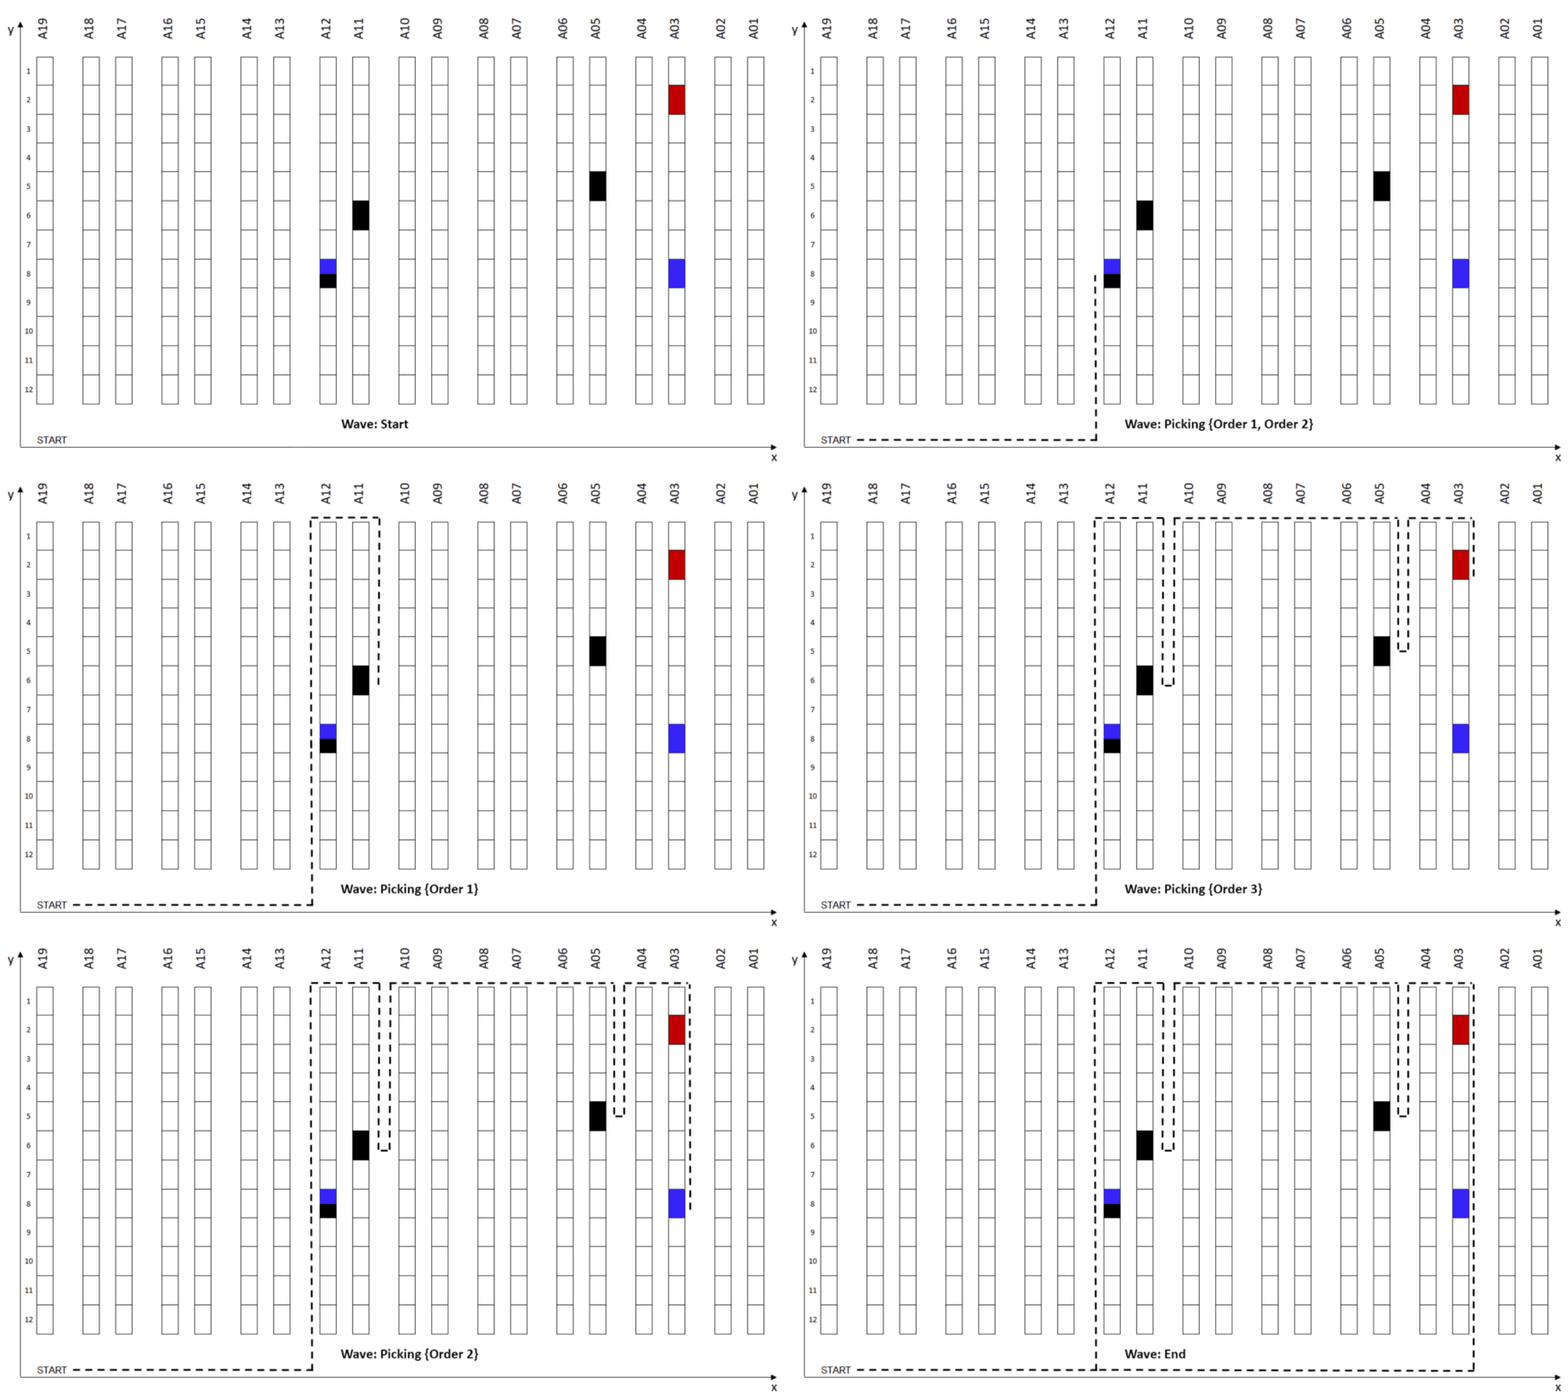
Scenario 2: Wave Picking applied to Scenario 1
The first intuitive way to optimise this process is to combine these three orders into a single picking route — a strategy commonly called Wave Picking.
We will build a model to simulate the impact of several wave-picking strategies on the total walking distance for a specific set of orders.
📊 Simulation
In the article, I have built a set of functions needed to run different scenarios and simulate the picker's walking distance.
Function: Calculate the distance between two picking locations
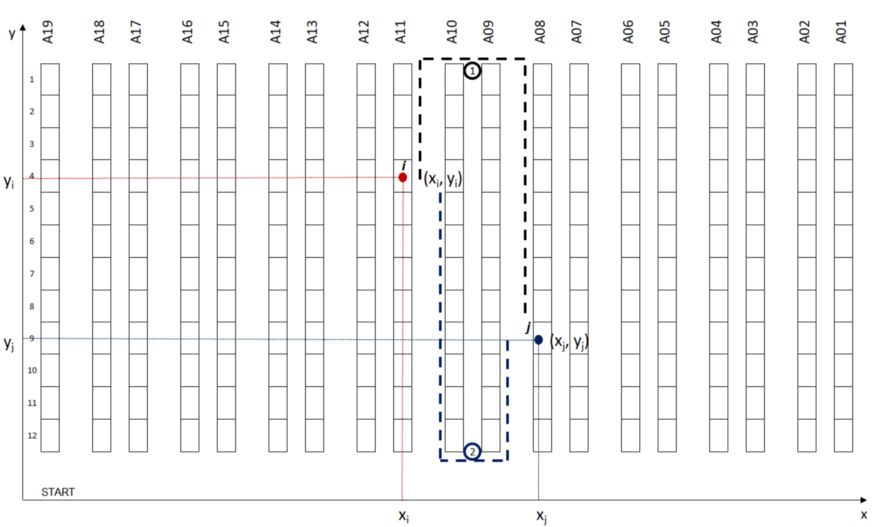
Function: Different routes between two storage locations in the warehouse
This function calculates the walking distance between points i (xi, yi) and j (xj, yj).
Objective: return the shortest walking distance between the two potential routes from point i to point j.
Parameters
- y_low: lowest point of your alley (y-axis)
- y_high: highest point of your alley (y-axis)
Function: The Next Closest Location
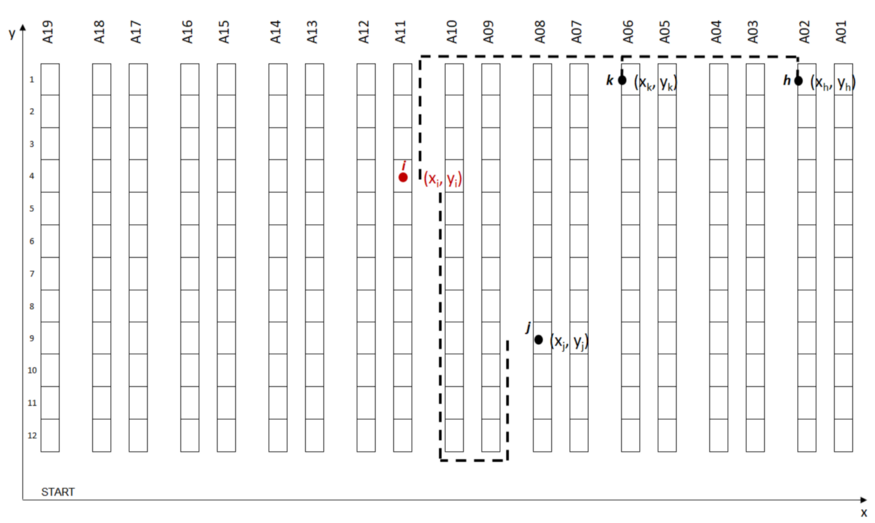
Function: Next Storage Location Scenario
This function will choose the next location among several candidates to continue your picking route.
Objective: return the closest location as the best candidate
This function will create your picking route from a set of orders to prepare.
- Input: a list of (x, y) locations based on items to be picked for this route
- Output: an ordered sequence of locations covered and total walking distance
Function: Create batches of n orders to be picked at the same time
- Input: order lines data frame (df_orderlines), number of orders per wave (orders_number)
- Output: data frame mapped with wave number (Column: WaveID), the total number of waves (waves_number)
Function: listing picking locations of wave_ID picking route
- Input: order lines data frame (df_orderlines) and wave number (waveID)
- Output: list of locations i(xi, yi) included in your picking route
☑️ Results and Next Steps
After setting up all necessary functions to measure picking distance, we can now test our picking route strategy with picking order lines.
Here, we first decided to start with a very simple approach
- Orders Waves: orders are grouped by chronological order of receiving time from OMS ( TimeStamp)
- Picking Route: The picking route strategy follows the Next Closest Location logic
To estimate the impact of wave picking strategy on your productivity, we will run several simulations with a gradual number of orders per wave:
- Measure Total Walking Distance: how much walking distance is reduced when the number of orders per route is increased?
- Record Picking Route per Wave: recording the sequence of locations per route for further analysis
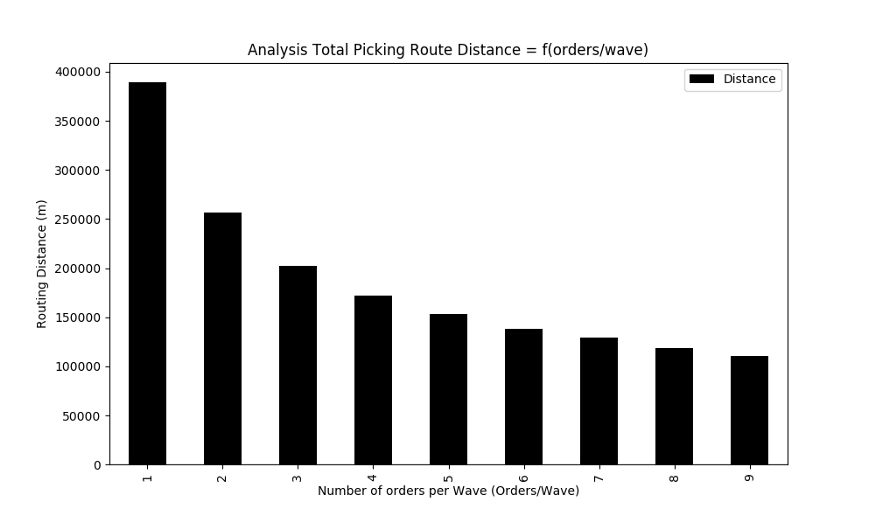
Experiment 1: Results for 5,000 order lines with a ratio from 1 to 9 orders per route
🧮Experiment 2: Impacts of orders batching using spatial clusters of picking locations?
For more information and details about calculation: Article

Order Lines Processing for Order Wave Picking using Clustering by Picking Location
💡Idea: Picking Locations Clusters
Group picking locations by clusters to reduce the walking distance for each picking route. (Example: the maximum walking distance between two locations is <15 m)
Spatial clustering is the task of grouping together a set of points in a way that objects in the same cluster are more similar to each other than to objects in other clusters.
For this part we will split the orders in two categories:
- Mono-line orders: they can be associated to a unique picking locations
- Multi-line orders: that are associated with several picking locations
Mono-line orders
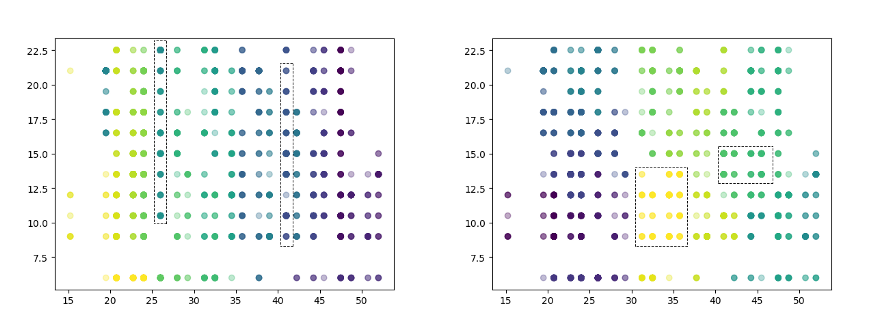
Left [Clustering using Walking Distance] / Right [Clustering using Euclidian Distance]
Grouping orders in cluster within n meters of walking distance
Multi-line orders
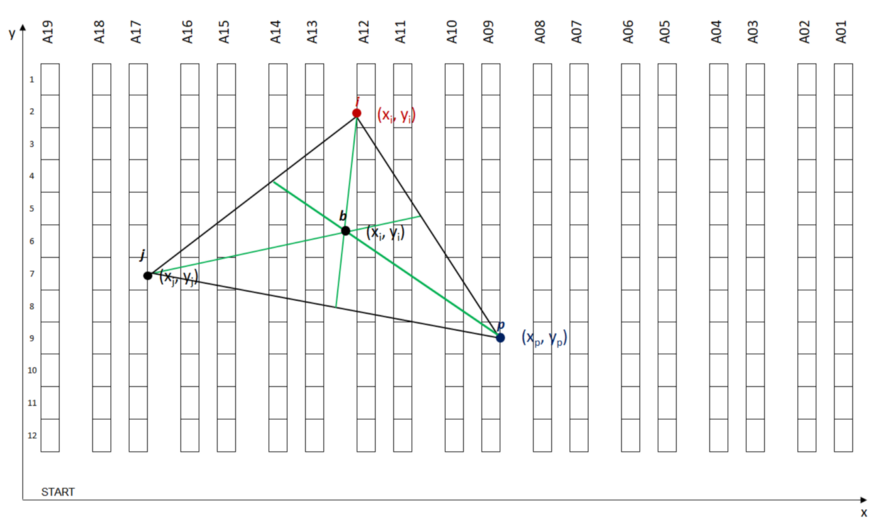
Example: Centroid of three Picking Locations
Grouping multi-line orders in cluster (using centroids of picking locations) within n meters of walking distance
🐁 Model Simulation
Methodology
To sum up, our model construction, see the chart below, we have several steps before Picking Routes Creation using Wave Processing.
At each step, we have a collection of parameters that can be tuned to improve performance:

Methodology: Model Construction with Parameters
Comparing three methods of wave creation
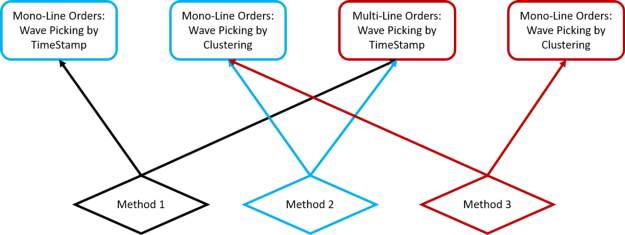
Methodology: Three Methods for Wave Processing
We’ll start first by assessing the impact of Order Wave processing by clusters of picking locations on total walking distance.
We’ll be testing three different methods:
- Method 1: we do not apply clustering (i.e Initial Scenario)
- Method 2: we apply clustering on single-line orders only
- Method 3: we apply clustering to single-line orders and centroids of multiline orders
Parameters of Simulation
- Order lines: 20,000 Lines
- Distance Threshold: Maximum distance between two picking locations (distance_threshold = 35 m)
- Orders per Wave: orders_number in [1, 9]
Final Results

Test 1: 20,000 Order Lines / 35 m distance Threshold
- Best Performance: Method 3 for 9 orders/Wave with 83% reduction of walking distance
- Method 2 vs. Method 1: Clustering for mono-line orders reduce the walking distance by 34%
- Method 3 vs. Method 2: Clustering for mono-line orders reduce the walking distance by 10%
Project structure 📁
picking-route/
├── app.py                  # Streamlit application (UI + simulation orchestration)
├── utils/
│   ├── routing/            # Distance calculation & picking-route creation (SPRP heuristic)
│   ├── batch/              # Experiment 1: order batching by wave
│   ├── cluster/            # Experiment 2: spatial clustering of picking locations
│   ├── process/            # Order lines pre-processing (mono/multi-line split)
│   └── results/            # Plotly charts rendered in the app
├── static/
│   ├── in/df_lines.csv     # Sample dataset (5,000 order lines)
│   ├── img/                # README illustrations
│   └── out/                # Generated charts (created at runtime, gitignored)
├── pyproject.toml          # Project metadata & dependencies (managed with uv)
├── uv.lock                 # Locked dependency versions for reproducible installs
├── Dockerfile              # Multi-stage container build (uv + python-slim)
└── docker-compose.yml      # One-command containerised run
Build the application locally 🏗️
Because the resources provided by Streamlit Cloud or Heroku are limited, I suggest running this application locally.
The project is managed with uv — dependencies are declared in pyproject.toml and locked in uv.lock for reproducible installs.
Option 1: Run with uv (recommended)
Install uv (if you don't have it yet)
curl -LsSf https://astral.sh/uv/install.sh | sh
Run the application
uv run streamlit run app.py --server.address 0.0.0.0
That's it — uv run automatically creates the virtual environment, installs the locked dependencies and starts the app.
Option 2: Run with Docker 🐳
Build and start with Docker Compose
docker compose up --build
Or with plain Docker:
    docker build -t picking-route .
    docker run -p 8501:8501 picking-route
Then open http://localhost:8501 in your browser.
Open the app in your browser
When running with uv, Streamlit prints the local URL in your terminal — click it (or open http://localhost:8501).

Instructions: Click on the URL
-> Enjoy!
Use the application 🖥️
This app has not been deployed; you need to use it locally.
Why should you use it?
This Streamlit Web Application has been designed for Supply Chain Engineers to help them simulate the impact on picking route optimization on the total distance of their picking operators.
Load the data
- You can use the dataset located in the folder
static/in/df_lines.csv - You can build your own dataset following the steps of ('Initial Step') above
Expected data format
The app reads a CSV file with one row per order line, with the following columns:
| Column | Type | Description | Example |
|---|---|---|---|
DATE |
date | Order receiving date/time from the OMS | 12/11/2018 |
OrderNumber |
int | Order identifier (lines sharing it belong to the same order) | 3780678 |
SKU |
int/str | Item reference to pick | 399573 |
PCS |
int | Number of pieces to pick | 1 |
ReferenceID |
int/str | Master data reference | 399573 |
Location |
str | Storage location code | A1119504 |
Alley_Number |
str | Alley identifier | A11 |
Cellule |
int | Cell number within the alley | 19 |
Coord |
str | 2-D picking coordinates as "[x, y]" (metres) |
"[19.5, 21.0]" |
AlleyCell |
str | Concatenation of alley + cell | A1119 |
The columns actually used by the simulations are DATE, OrderNumber, SKU, PCS and Coord — the others are kept for traceability with the warehouse layout. To use your own data, replace static/in/df_lines.csv with a file following the same schema.
🔬 Experiment 1
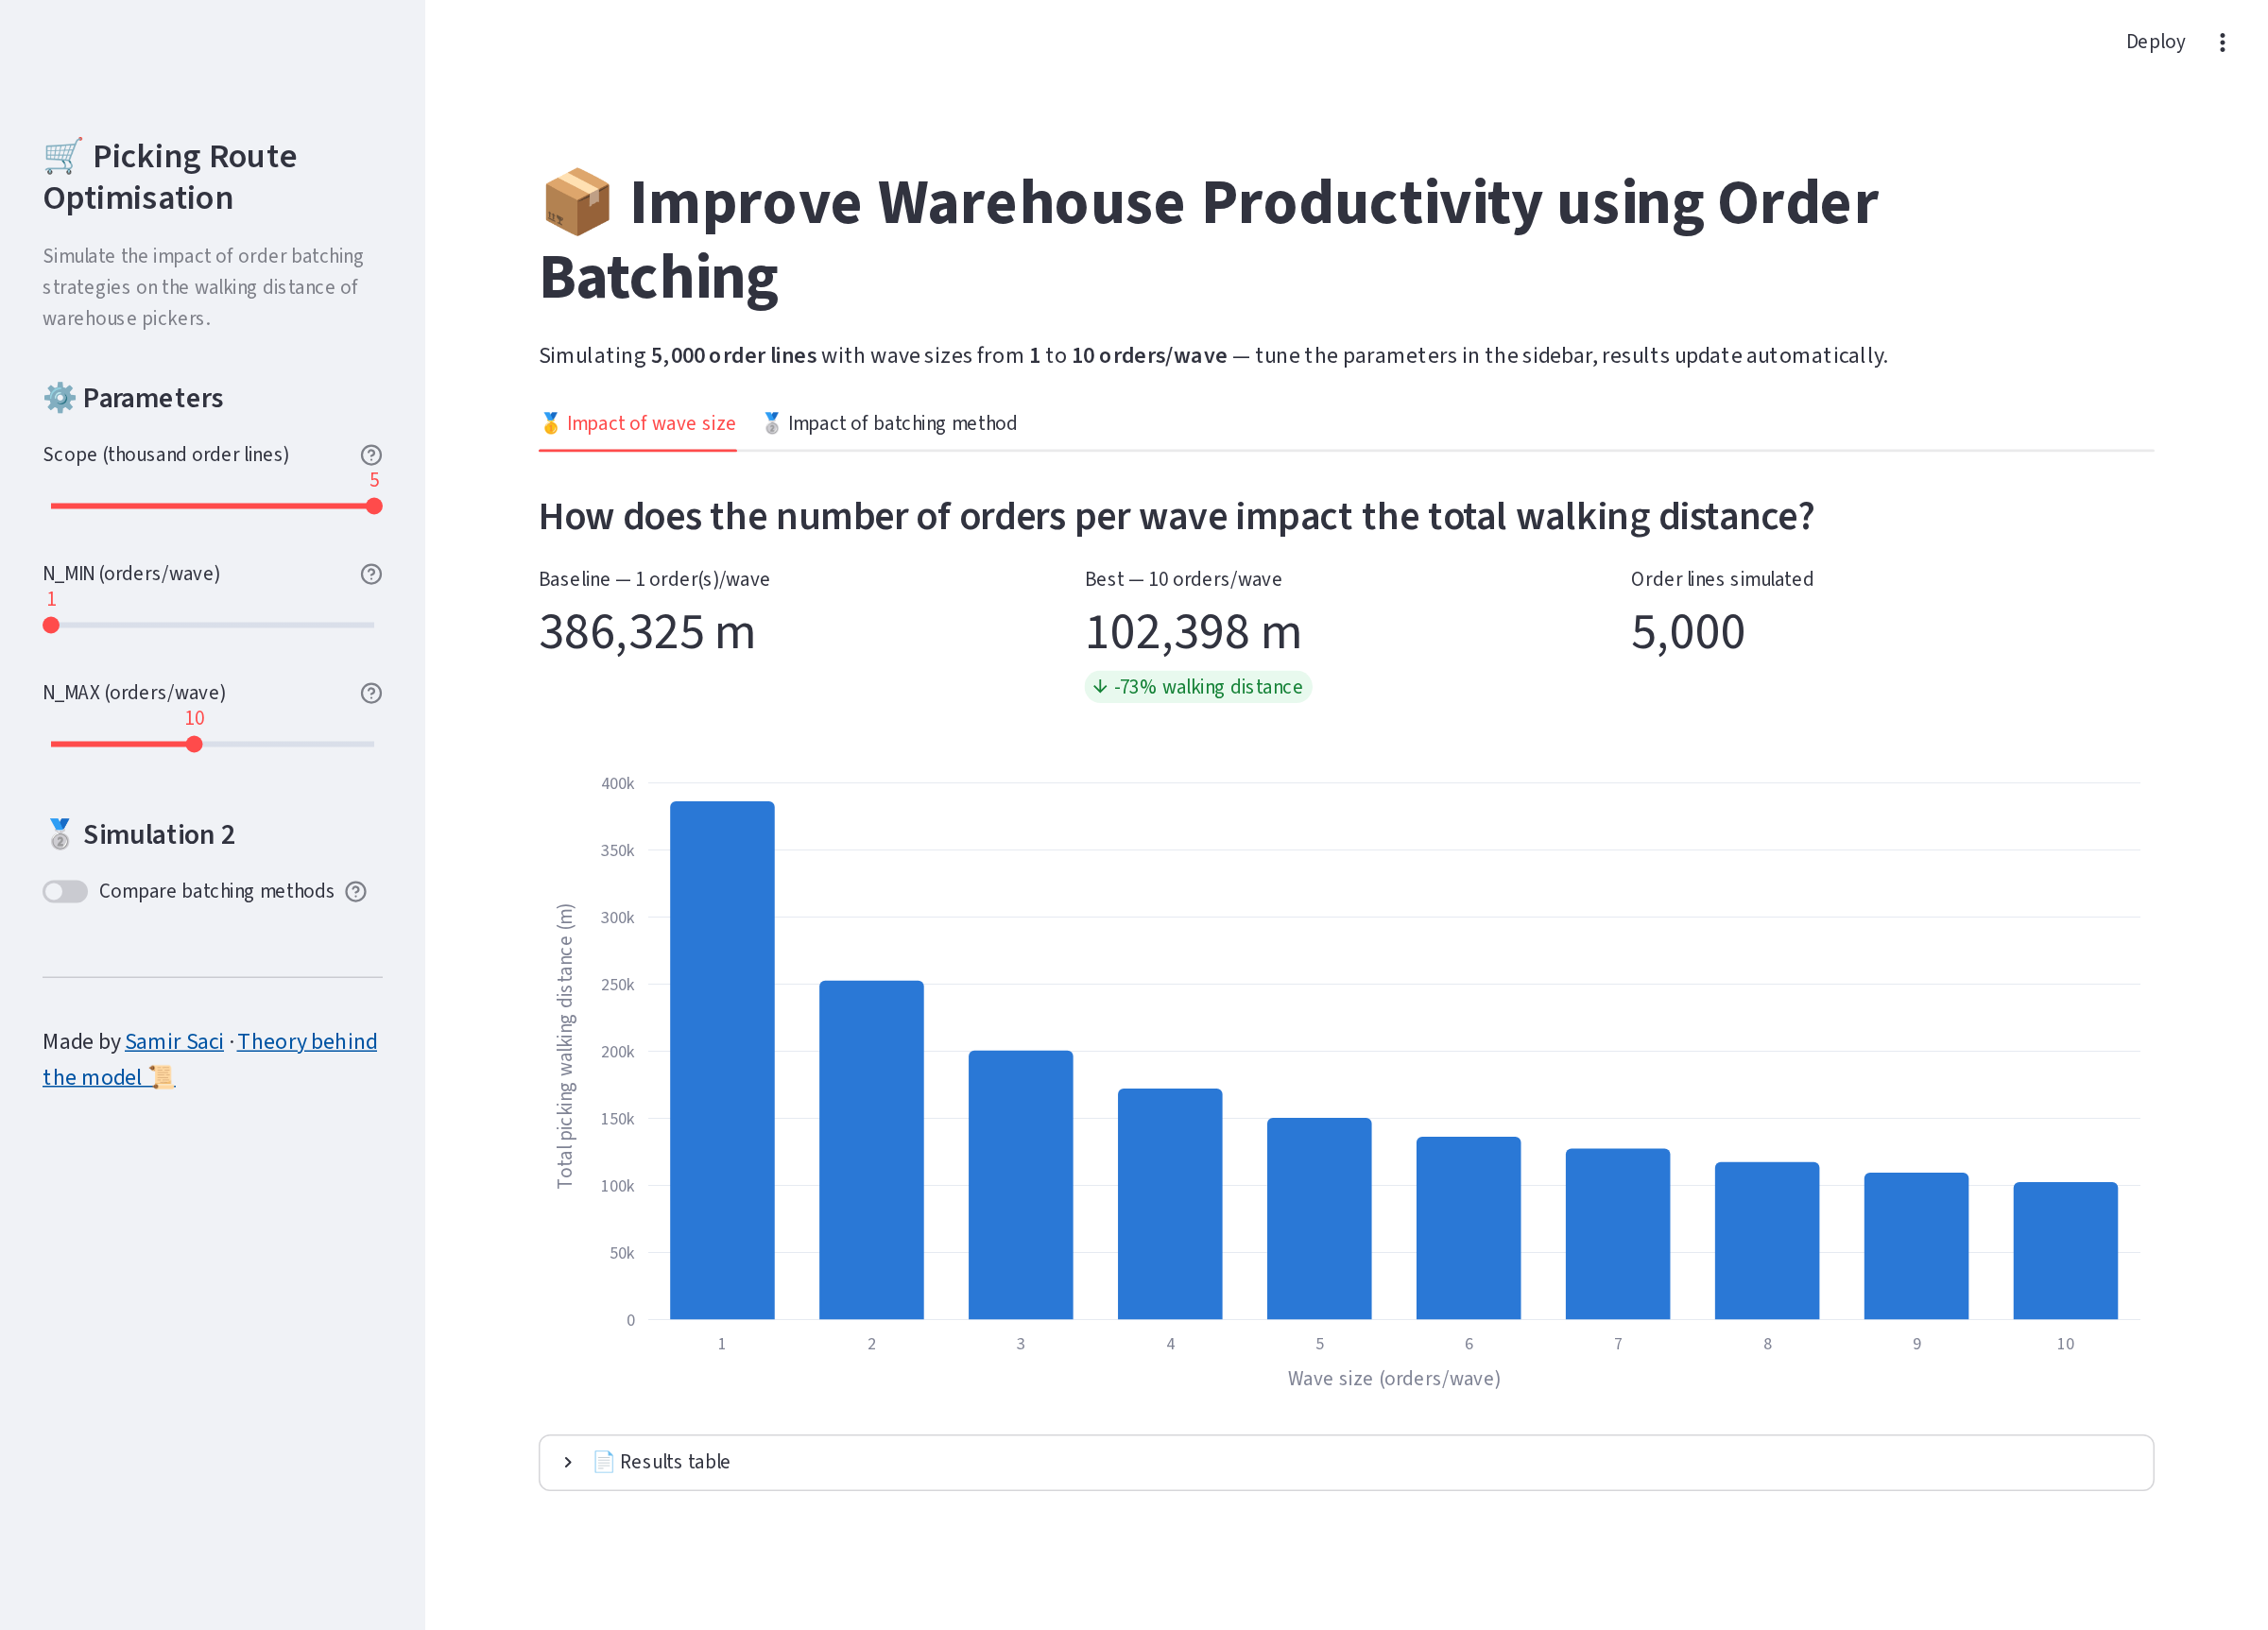
Experiment 1: Simulation 1 runs on arrival — parameters in the sidebar, KPIs and chart update automatically
Step 1: Scope (sidebar)
As the computation time can increase exponentially with the size of the dataset (optimisation can be done) you can ask the model to take only the first n thousand lines for analysis.
Step 2: Fix the range of orders/wave to simulate (sidebar)
Use the N_MIN / N_MAX sliders to set the range of orders per wave to test (default: 1 to 10).
Step 3: Results appear automatically
Simulation 1 runs automatically when you open the app and re-runs whenever you change a parameter — results are cached, so revisiting a previous setting is instant.
Final Results
The bar chart in the screenshot above shows the total walking distance per wave size — 💡 this is the same graph as the one presented in the article.
🧪 Experiment 2
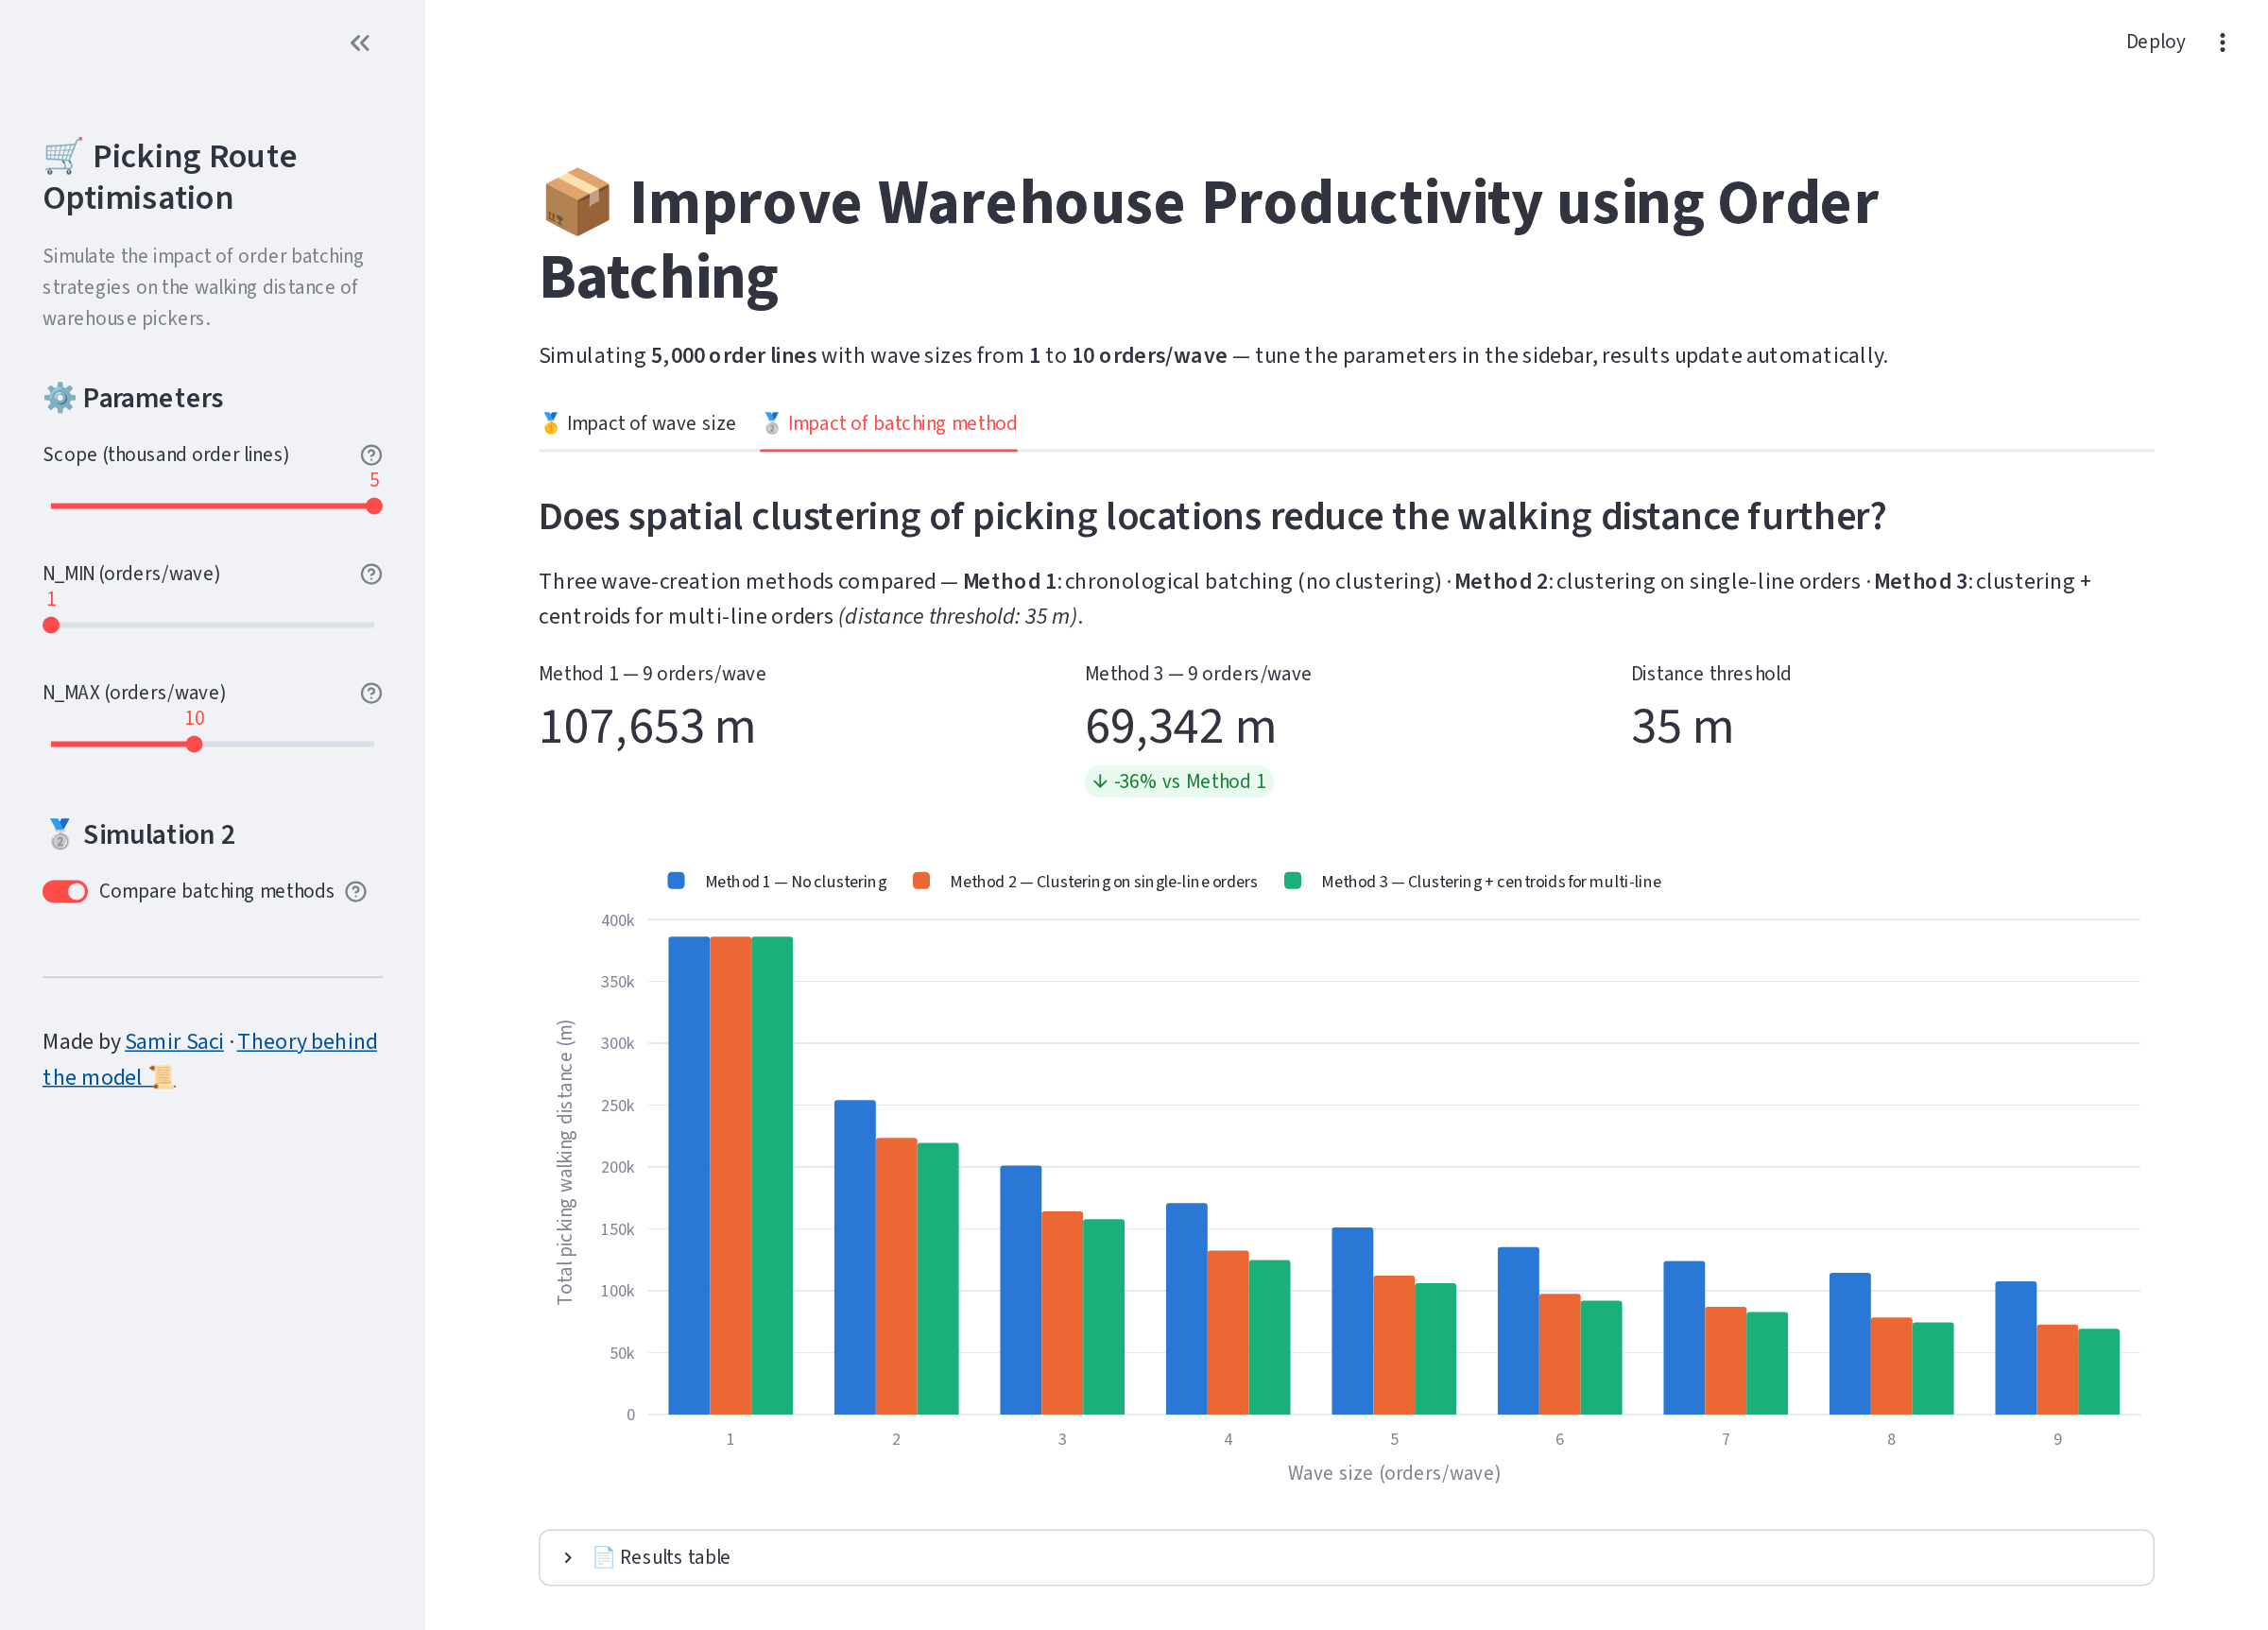
Experiment 2: The three batching methods compared — enabled with the sidebar toggle
Step 1: Scope (sidebar)
Simulation 2 uses the same scope and wave-size range as Simulation 1.
Step 2: Turn on Compare batching methods (sidebar)
Open the 🥈 Impact of batching method tab and enable the toggle — this simulation runs the three methods, so it takes roughly 3× longer than Simulation 1.
Final Results
The grouped bar chart in the screenshot above compares the three methods per wave size — 💡 this is the same graph as the one presented in the article.
Development 🛠️
Dev tooling is declared in the dev dependency group of pyproject.toml:
uv sync                  # install runtime + dev dependencies in .venv
uv run ruff check .      # lint
uv run pytest            # run tests (test suite in progress)
Useful dependency commands: uv add <pkg> / uv remove <pkg> (both update uv.lock automatically), uv lock --upgrade to refresh pinned versions.
Contributing 🤝
Contributions are welcome! Feel free to:
- Open an issue for bugs, questions or feature ideas
- Submit a pull request — please describe the motivation and keep changes focused
License 📝
This project is licensed under the MIT License — free to use, modify and distribute.
About me 🤓
Senior Supply Chain and Data Science consultant with international experience working on Logistics and Transportation operations.
For consulting or advising on analytics and sustainable supply chain transformation, feel free to contact me via Logigreen Consulting
Please have a look at my personal blog: Personal Website
more like this
meine
meine 🌒 - A CLI file manager and system utility built with Textual. It combines intuitive command parsing with rich t…
bit_gossip
Pathfinding library for calculating all node pairs' shortest paths in an unweighted undirected graph.