lottery
🎉🌟✨🎈年会抽奖程序,基于 Express + Three.js的 3D 球体抽奖程序,奖品🧧🎁,文字,图片,抽奖规则均可配置,😜抽奖人员信息Excel一键导入😍,抽奖结果Excel导出😎,给你的抽奖活动带来全新酷炫体验🚀🚀🚀
JavaScript★ 4.6k
🔐 Secure, real-time monitoring dashboard for OpenClaw AI agents. Auth, TOTP MFA, cost tracking, live feed, memory brow…
 tugcantopaloglu
git clone https://github.com/tugcantopaloglu/openclaw-dashboard.gittugcantopaloglu/openclaw-dashboard
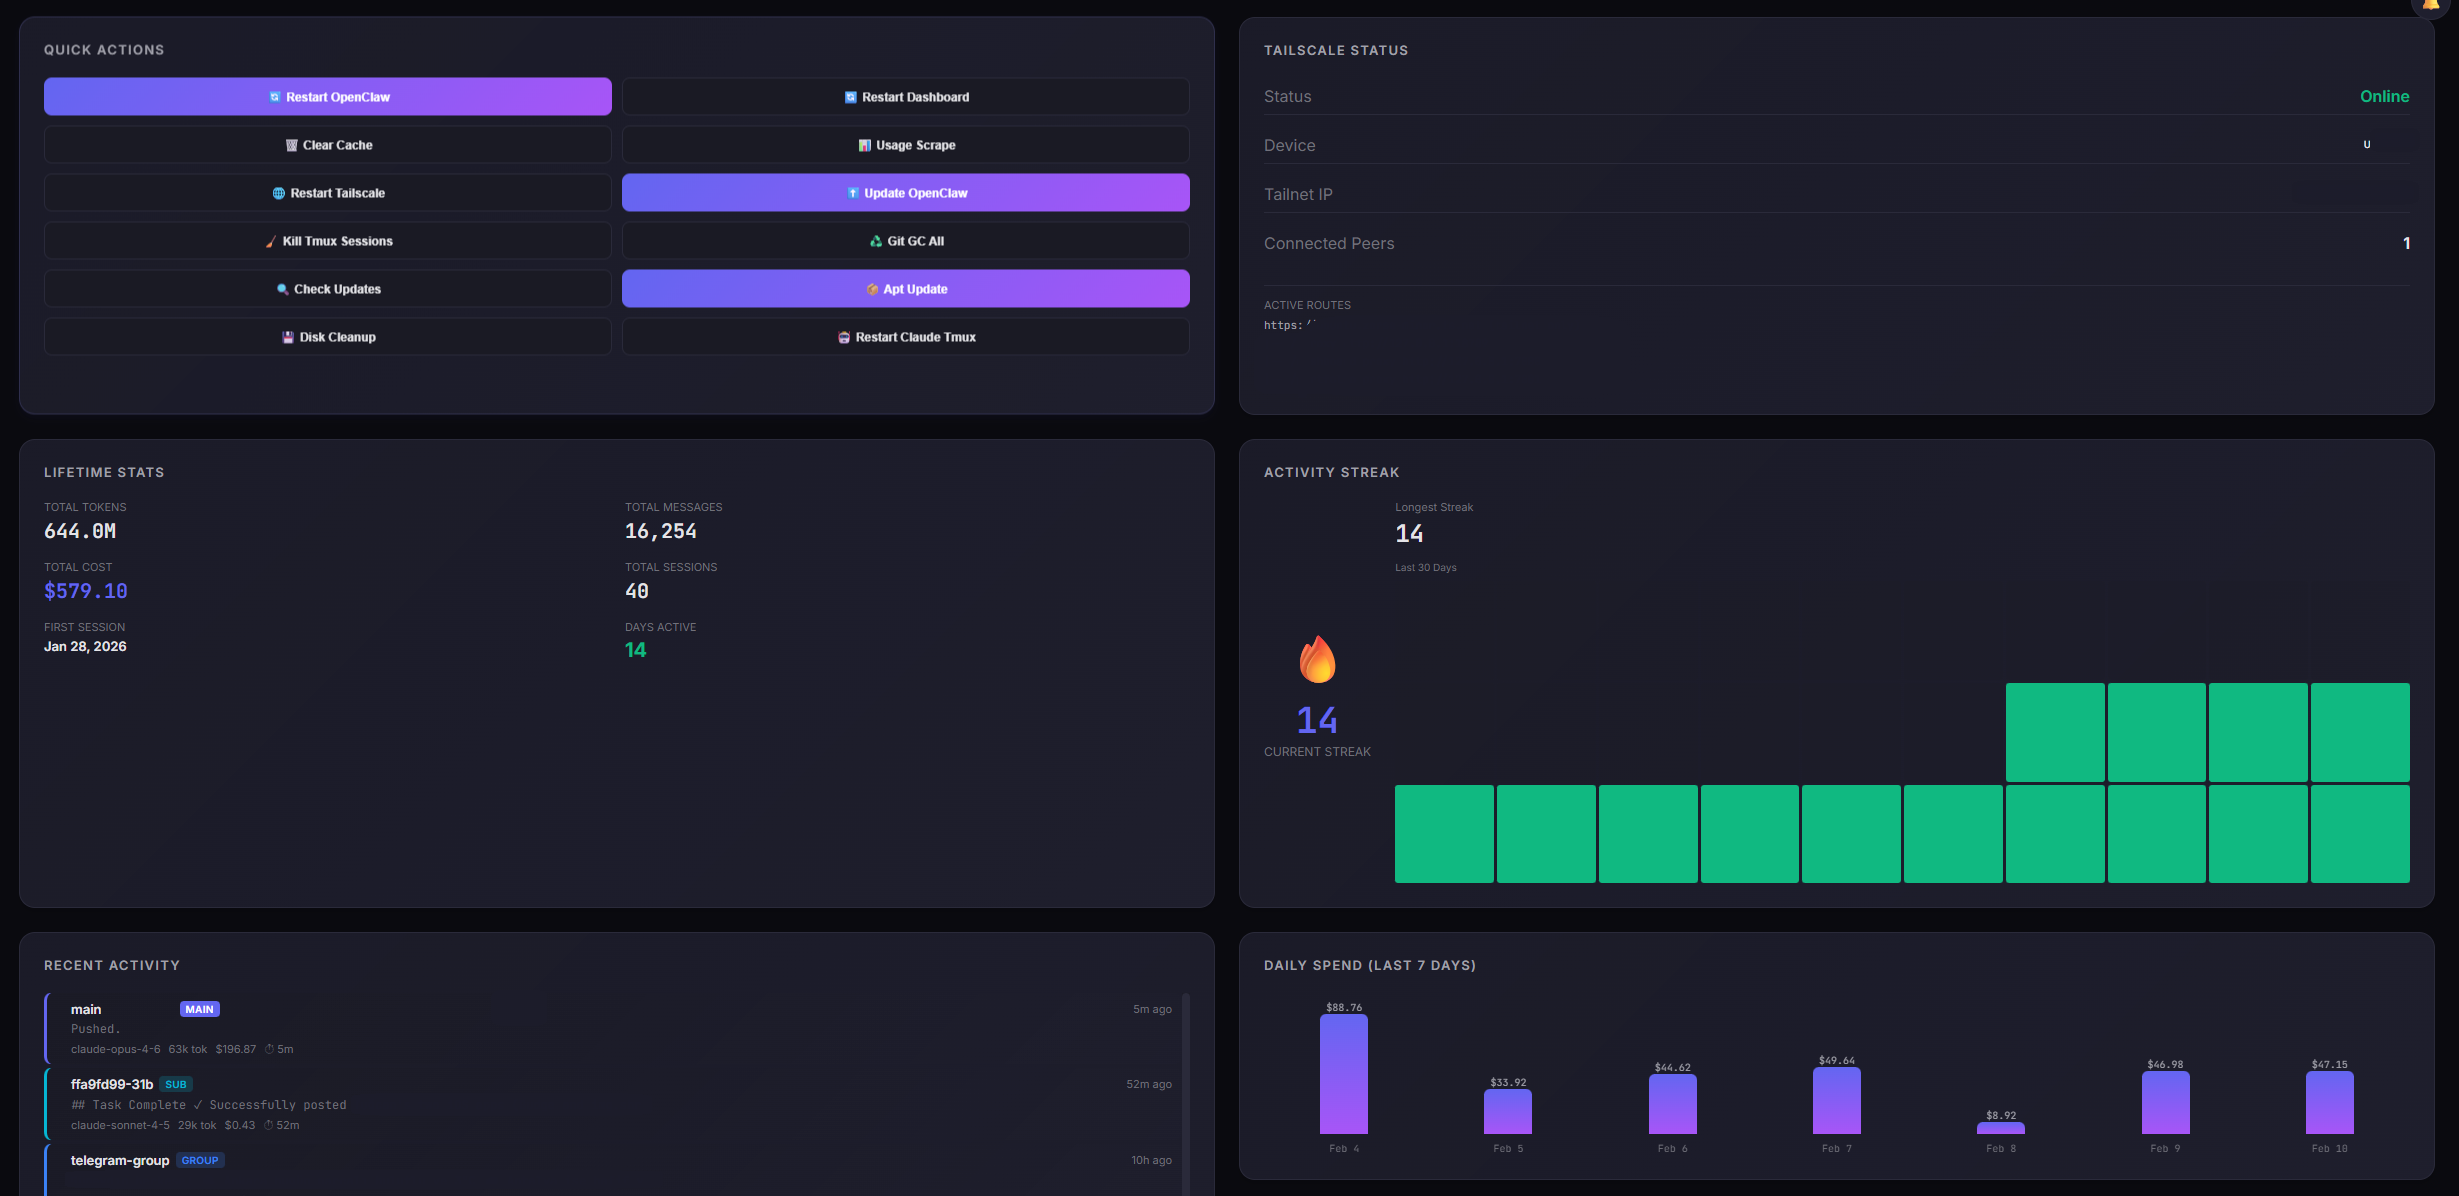
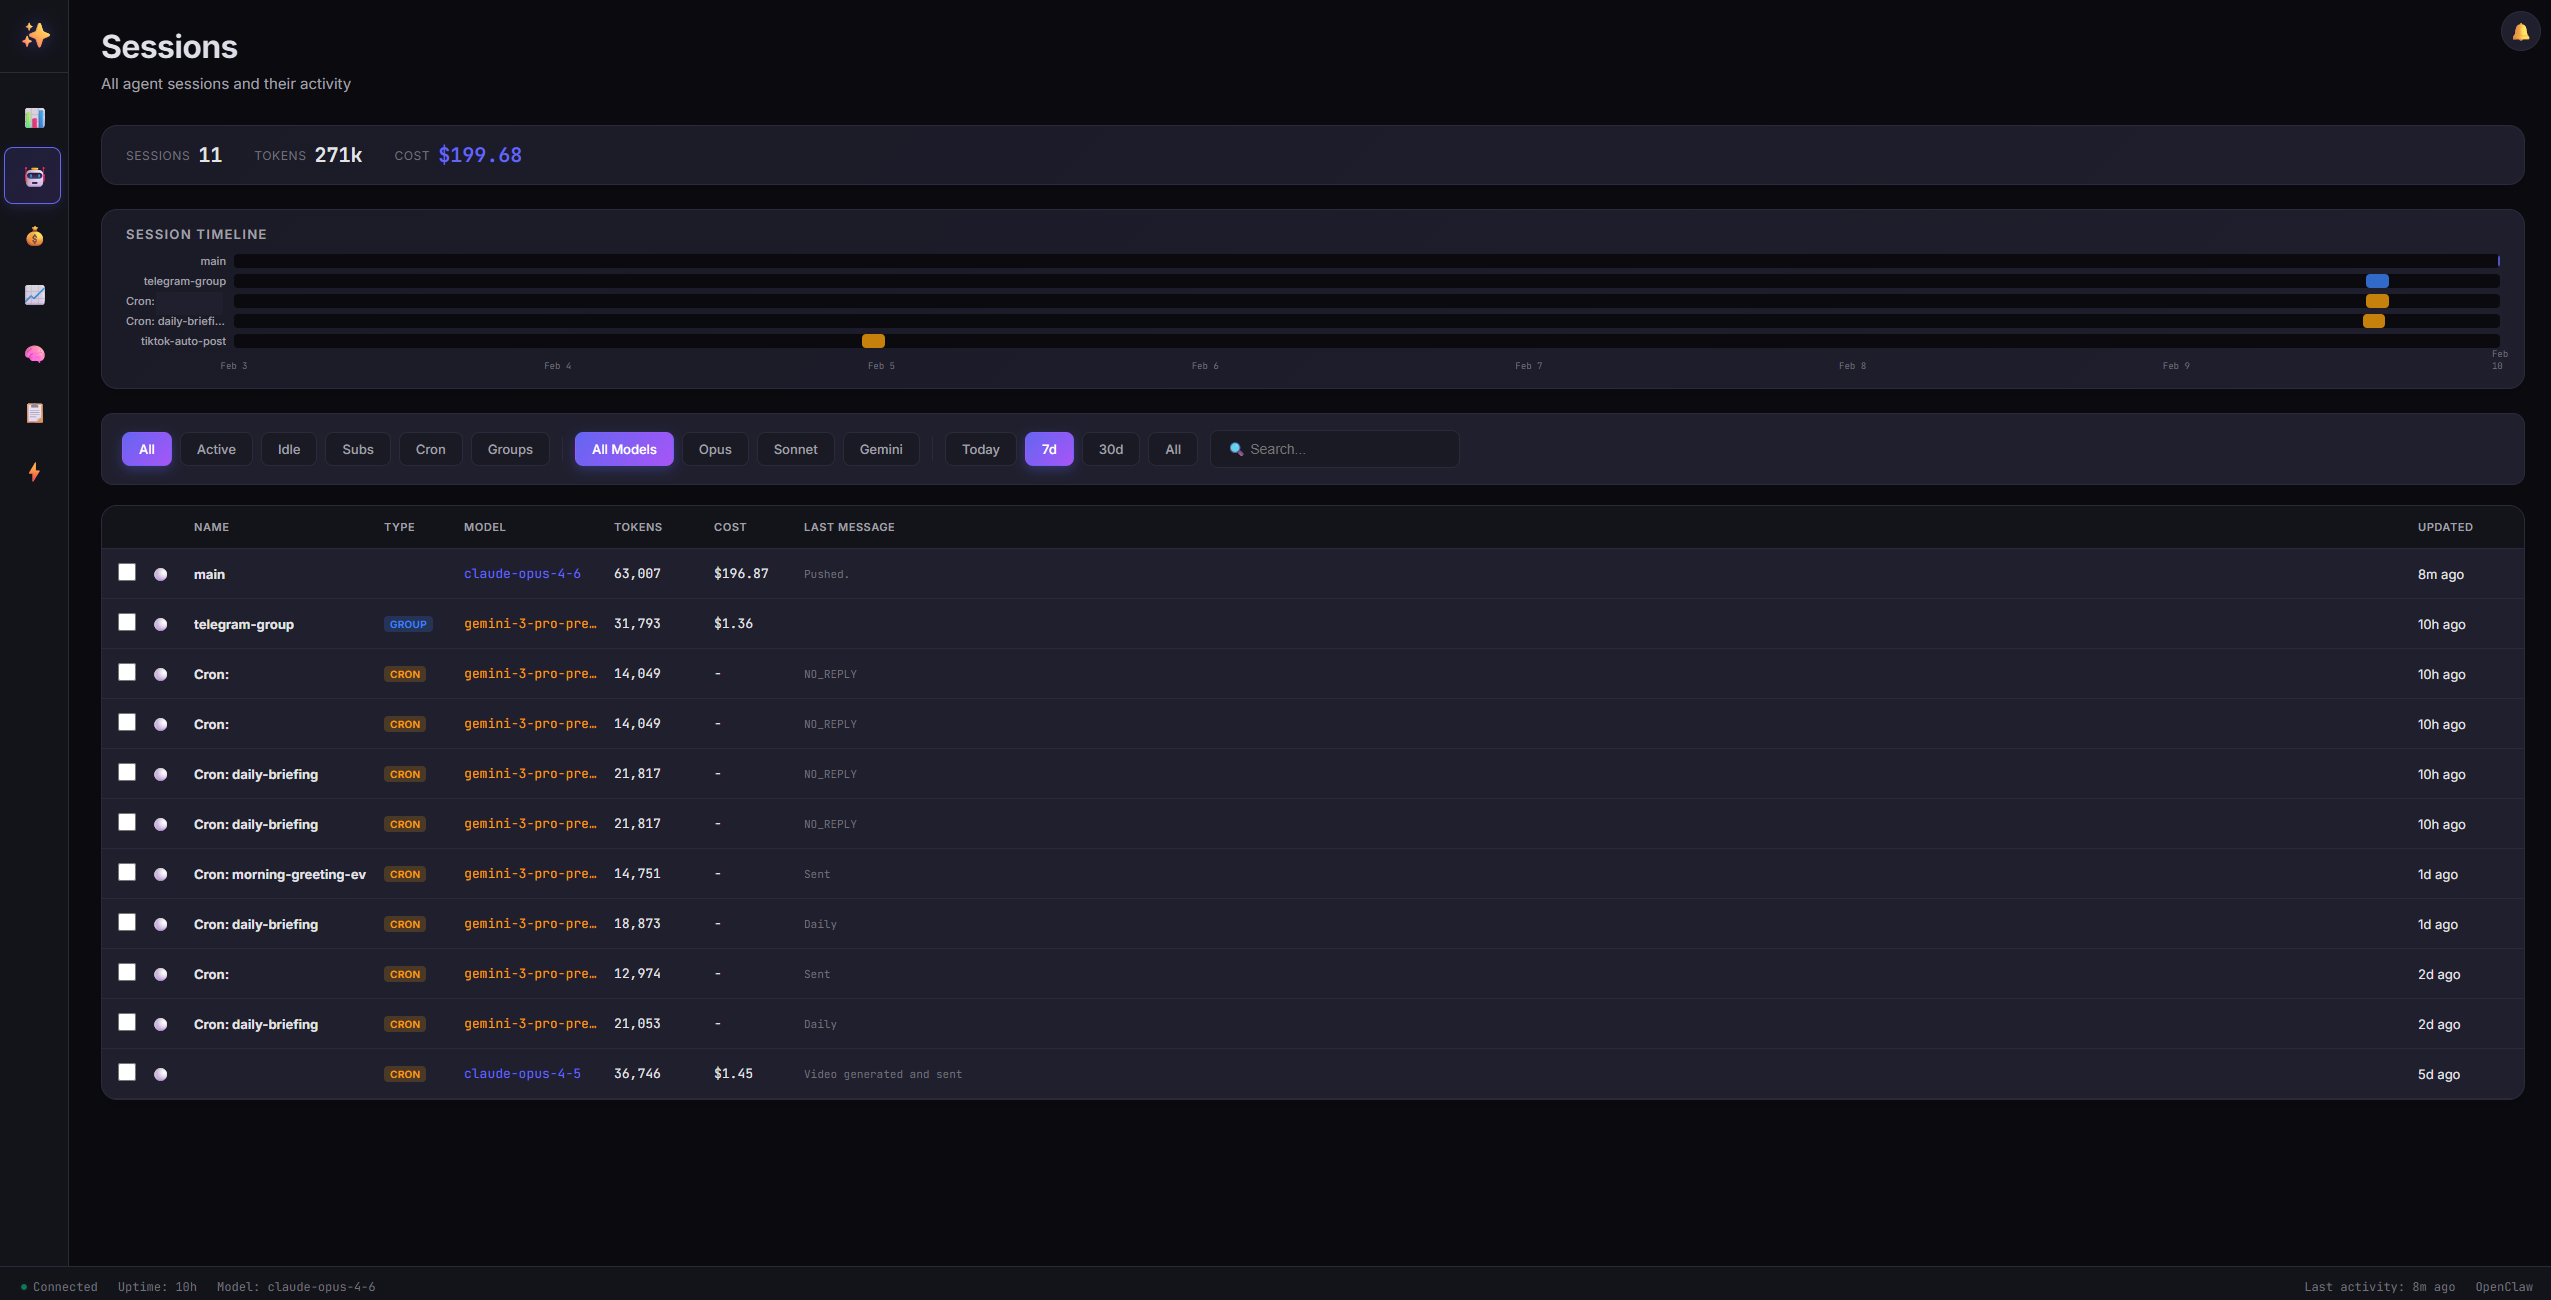
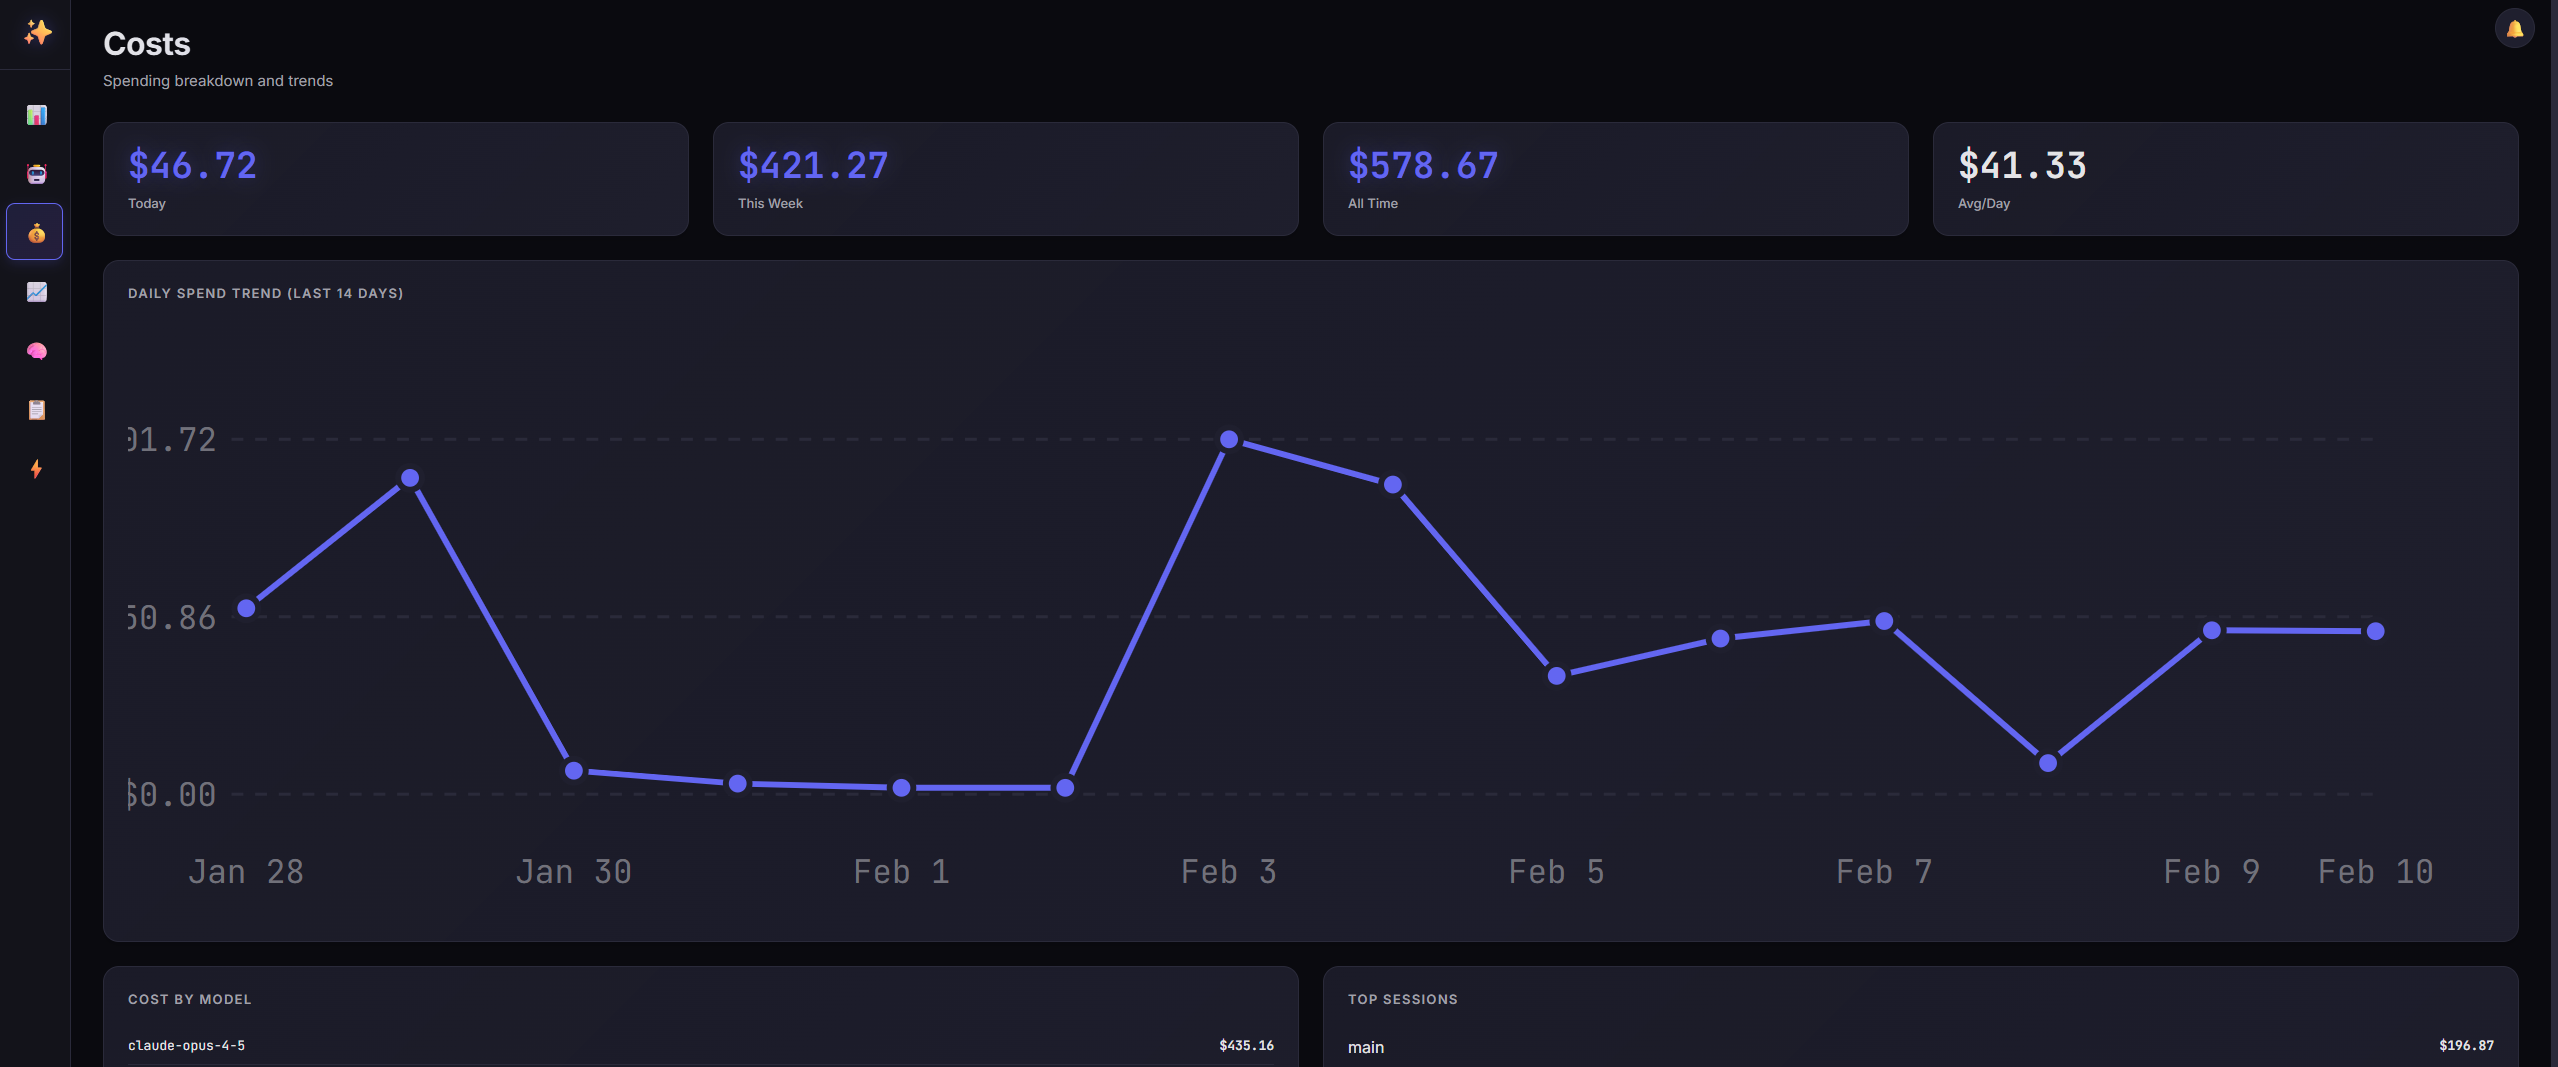
A beautiful, secure, real-time monitoring dashboard for OpenClaw agents. Track sessions, monitor API usage, view costs, manage memory files, and keep tabs on system health — all in one place.
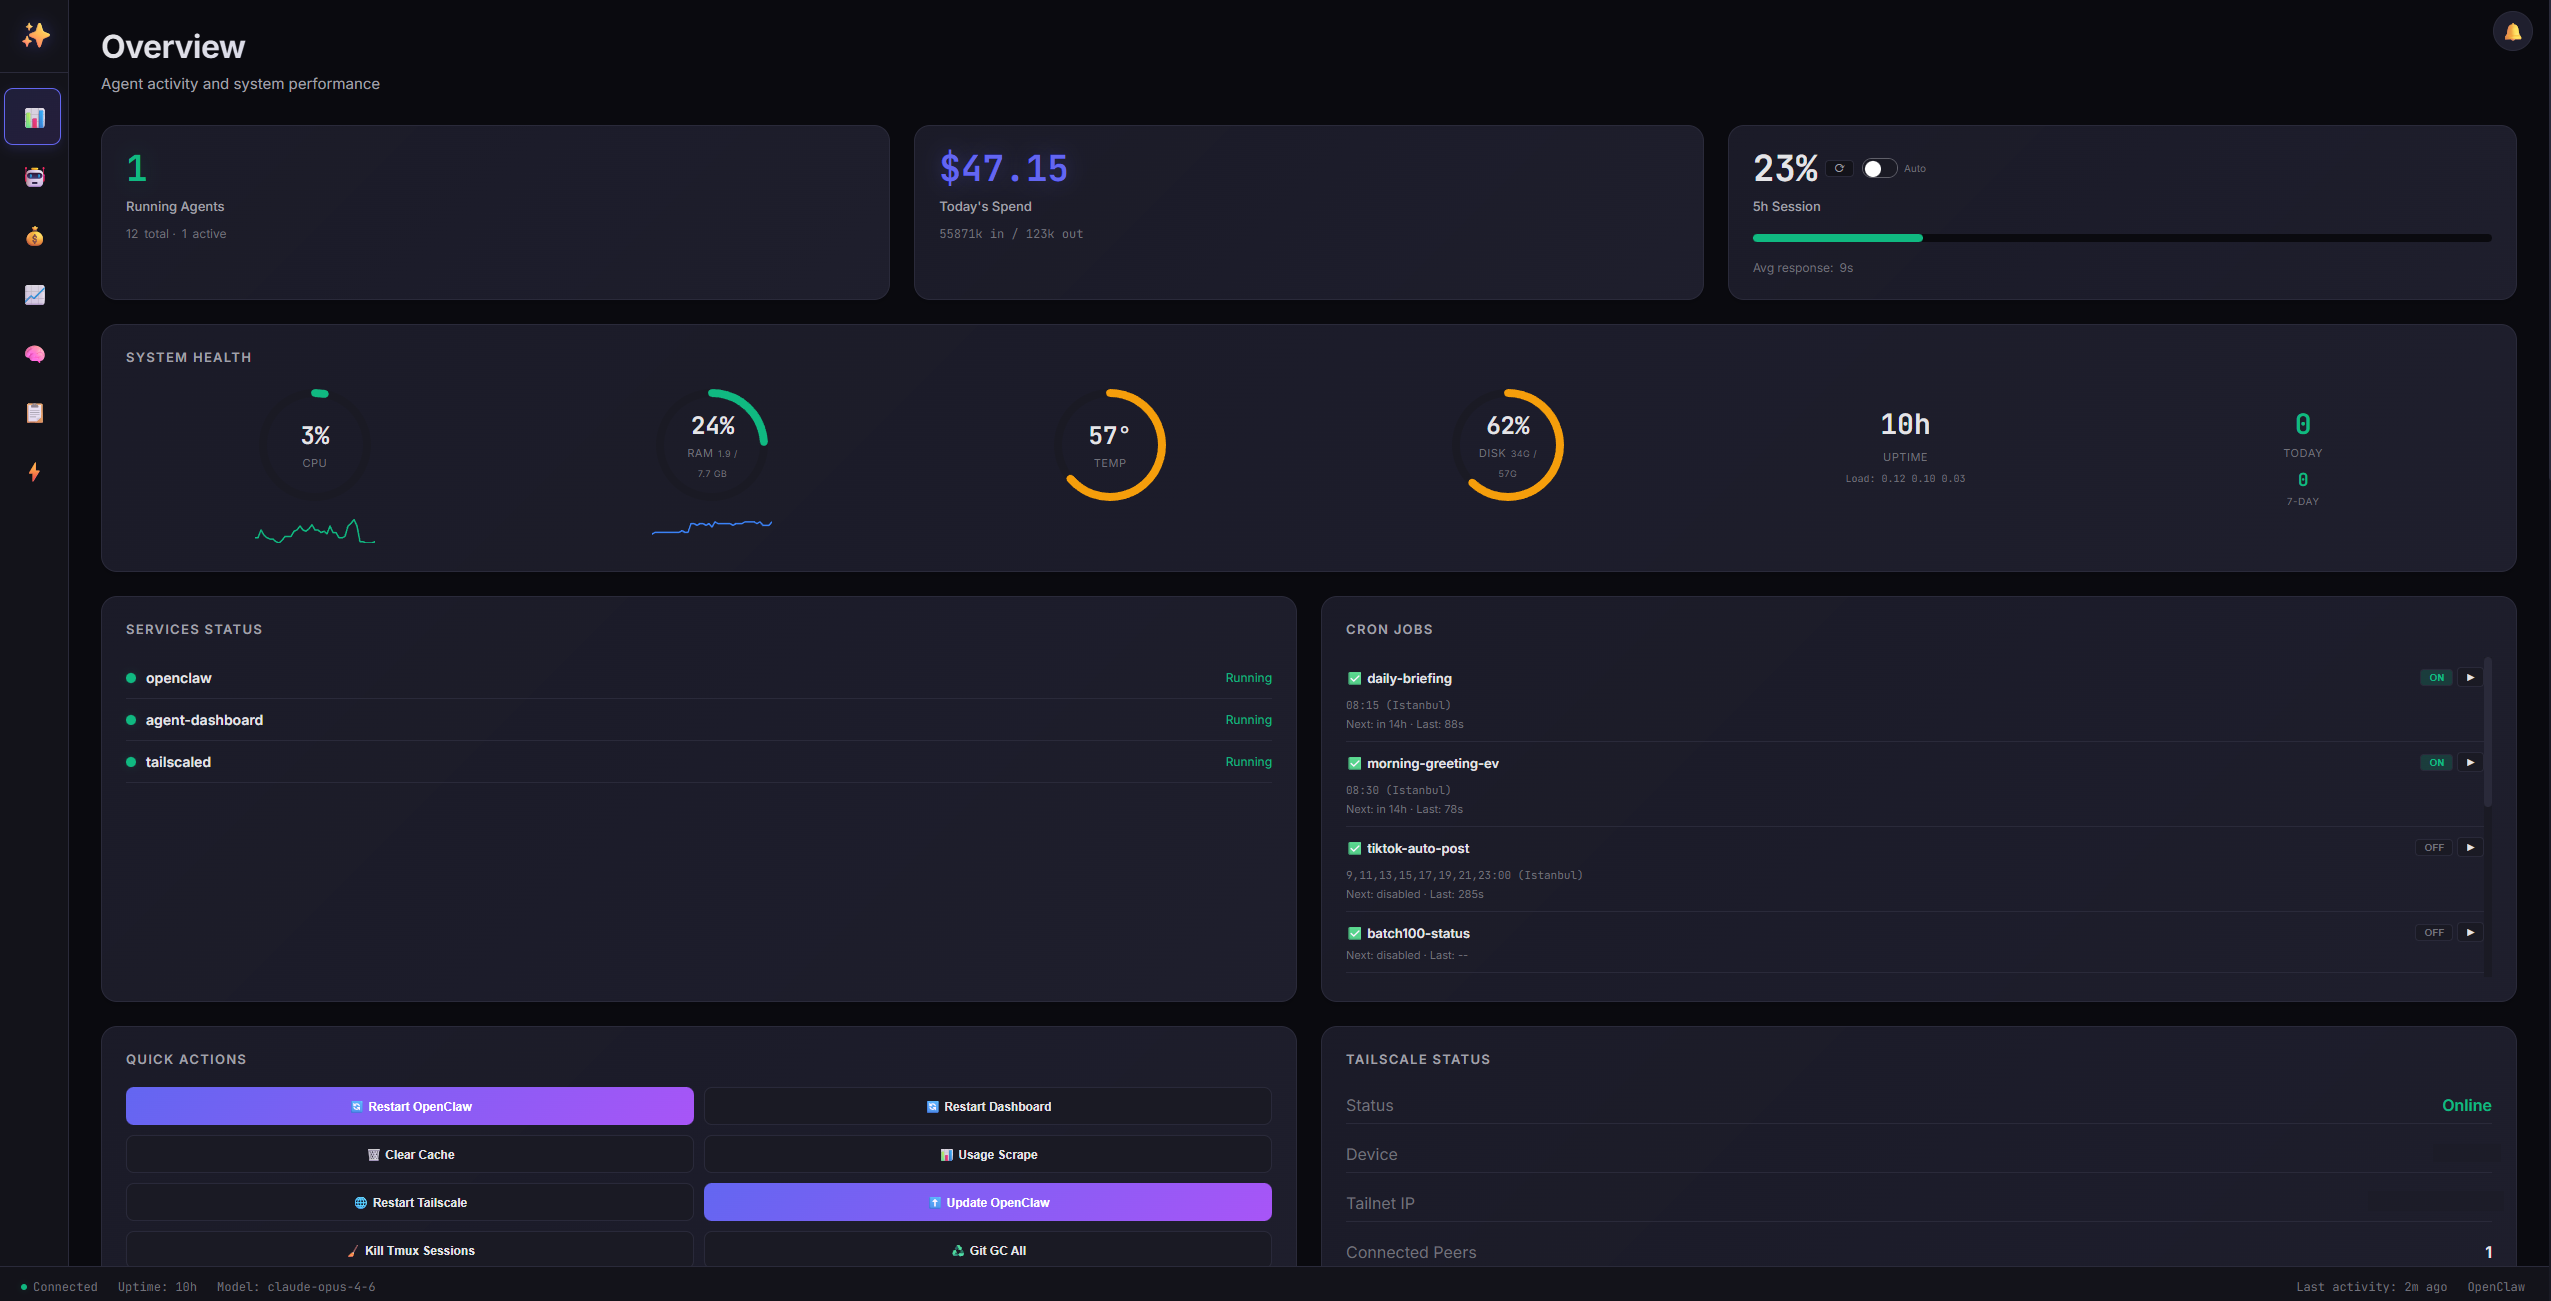
| Overview | Sessions | Costs |
|---|---|---|
 |
 |
 |
| Rate Limits | Live Feed | Logs |
|---|---|---|
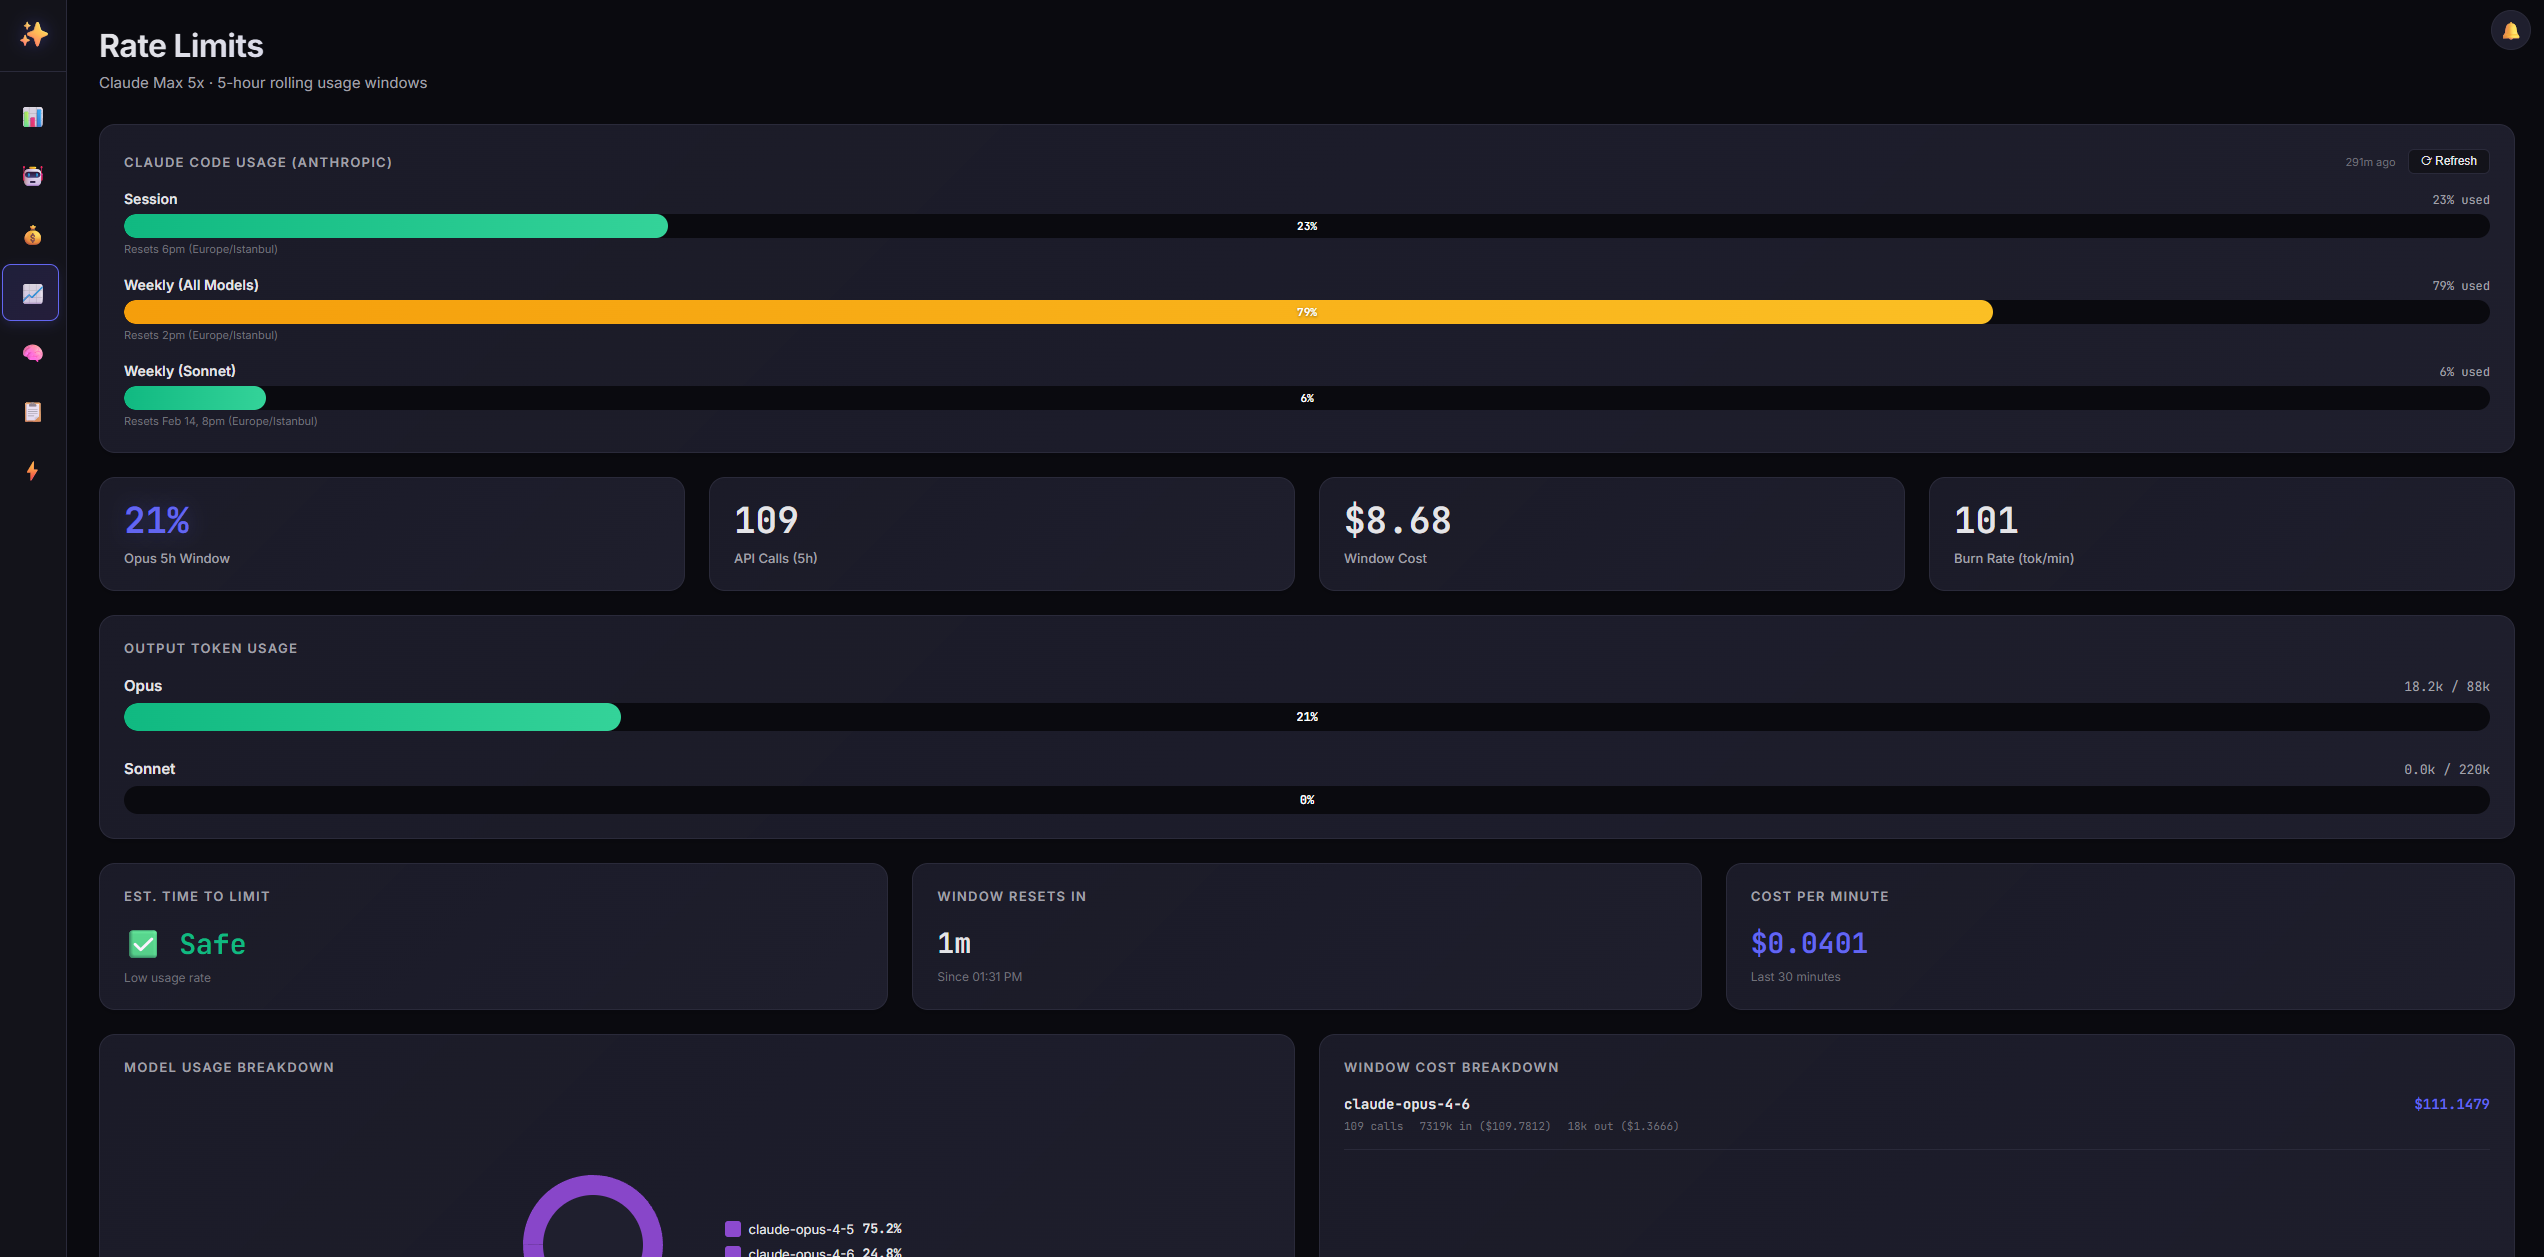 |
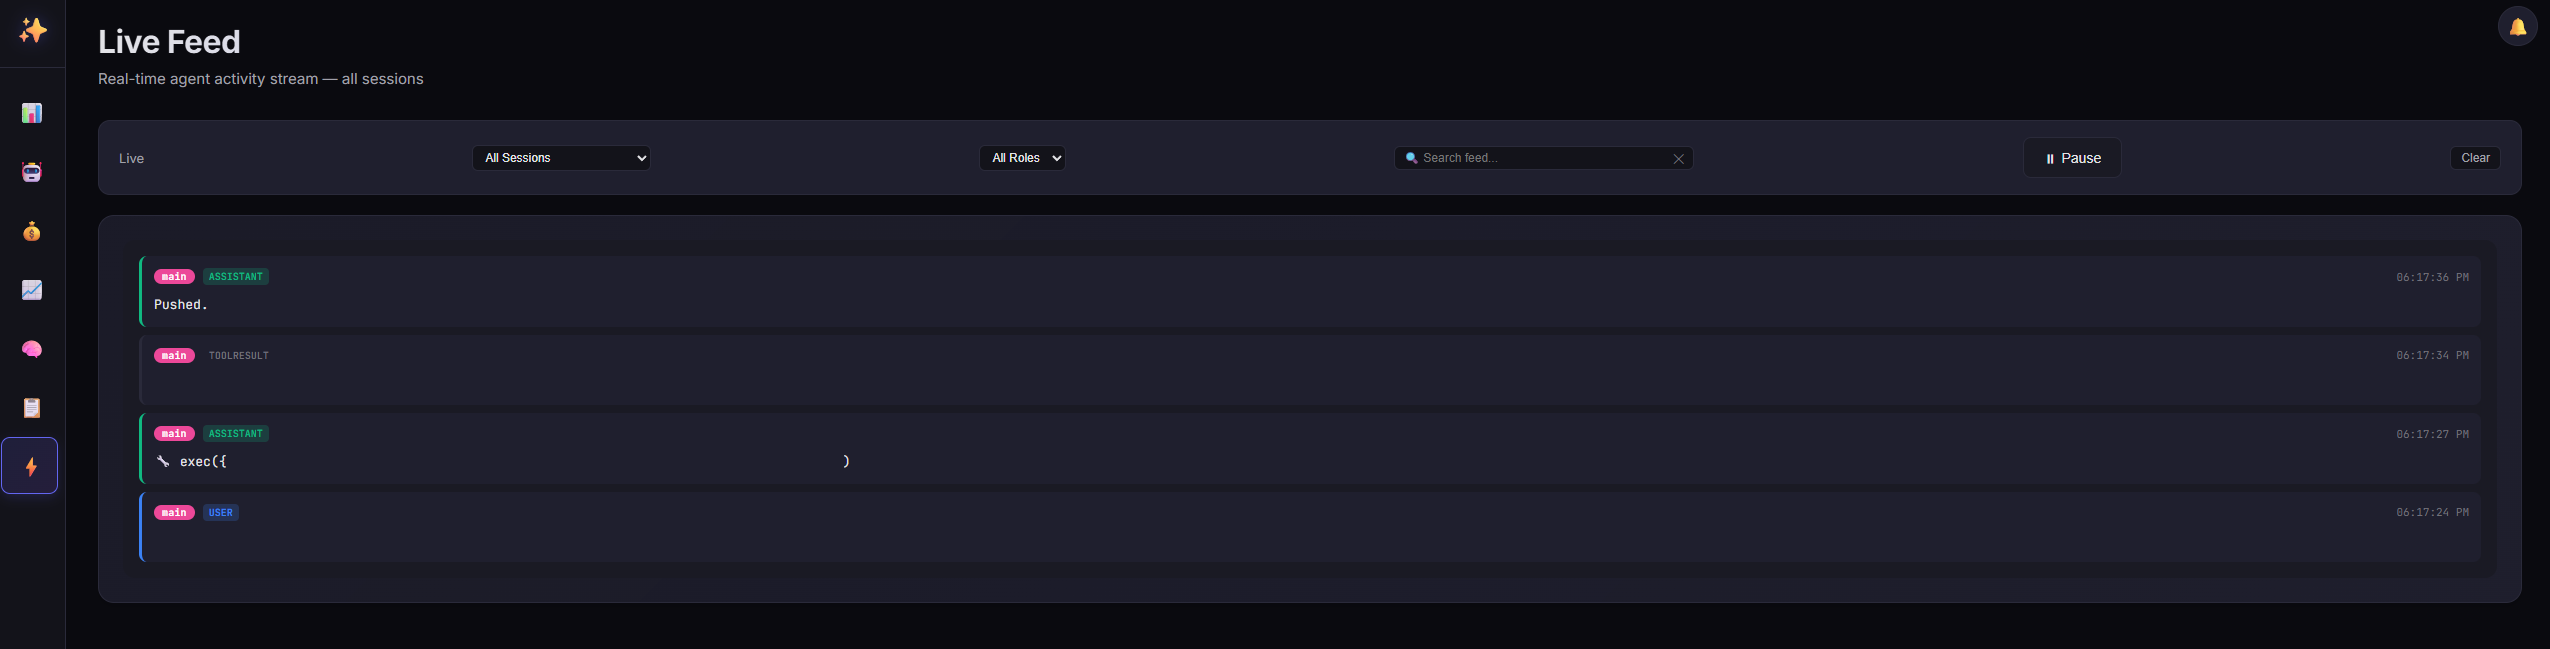 |
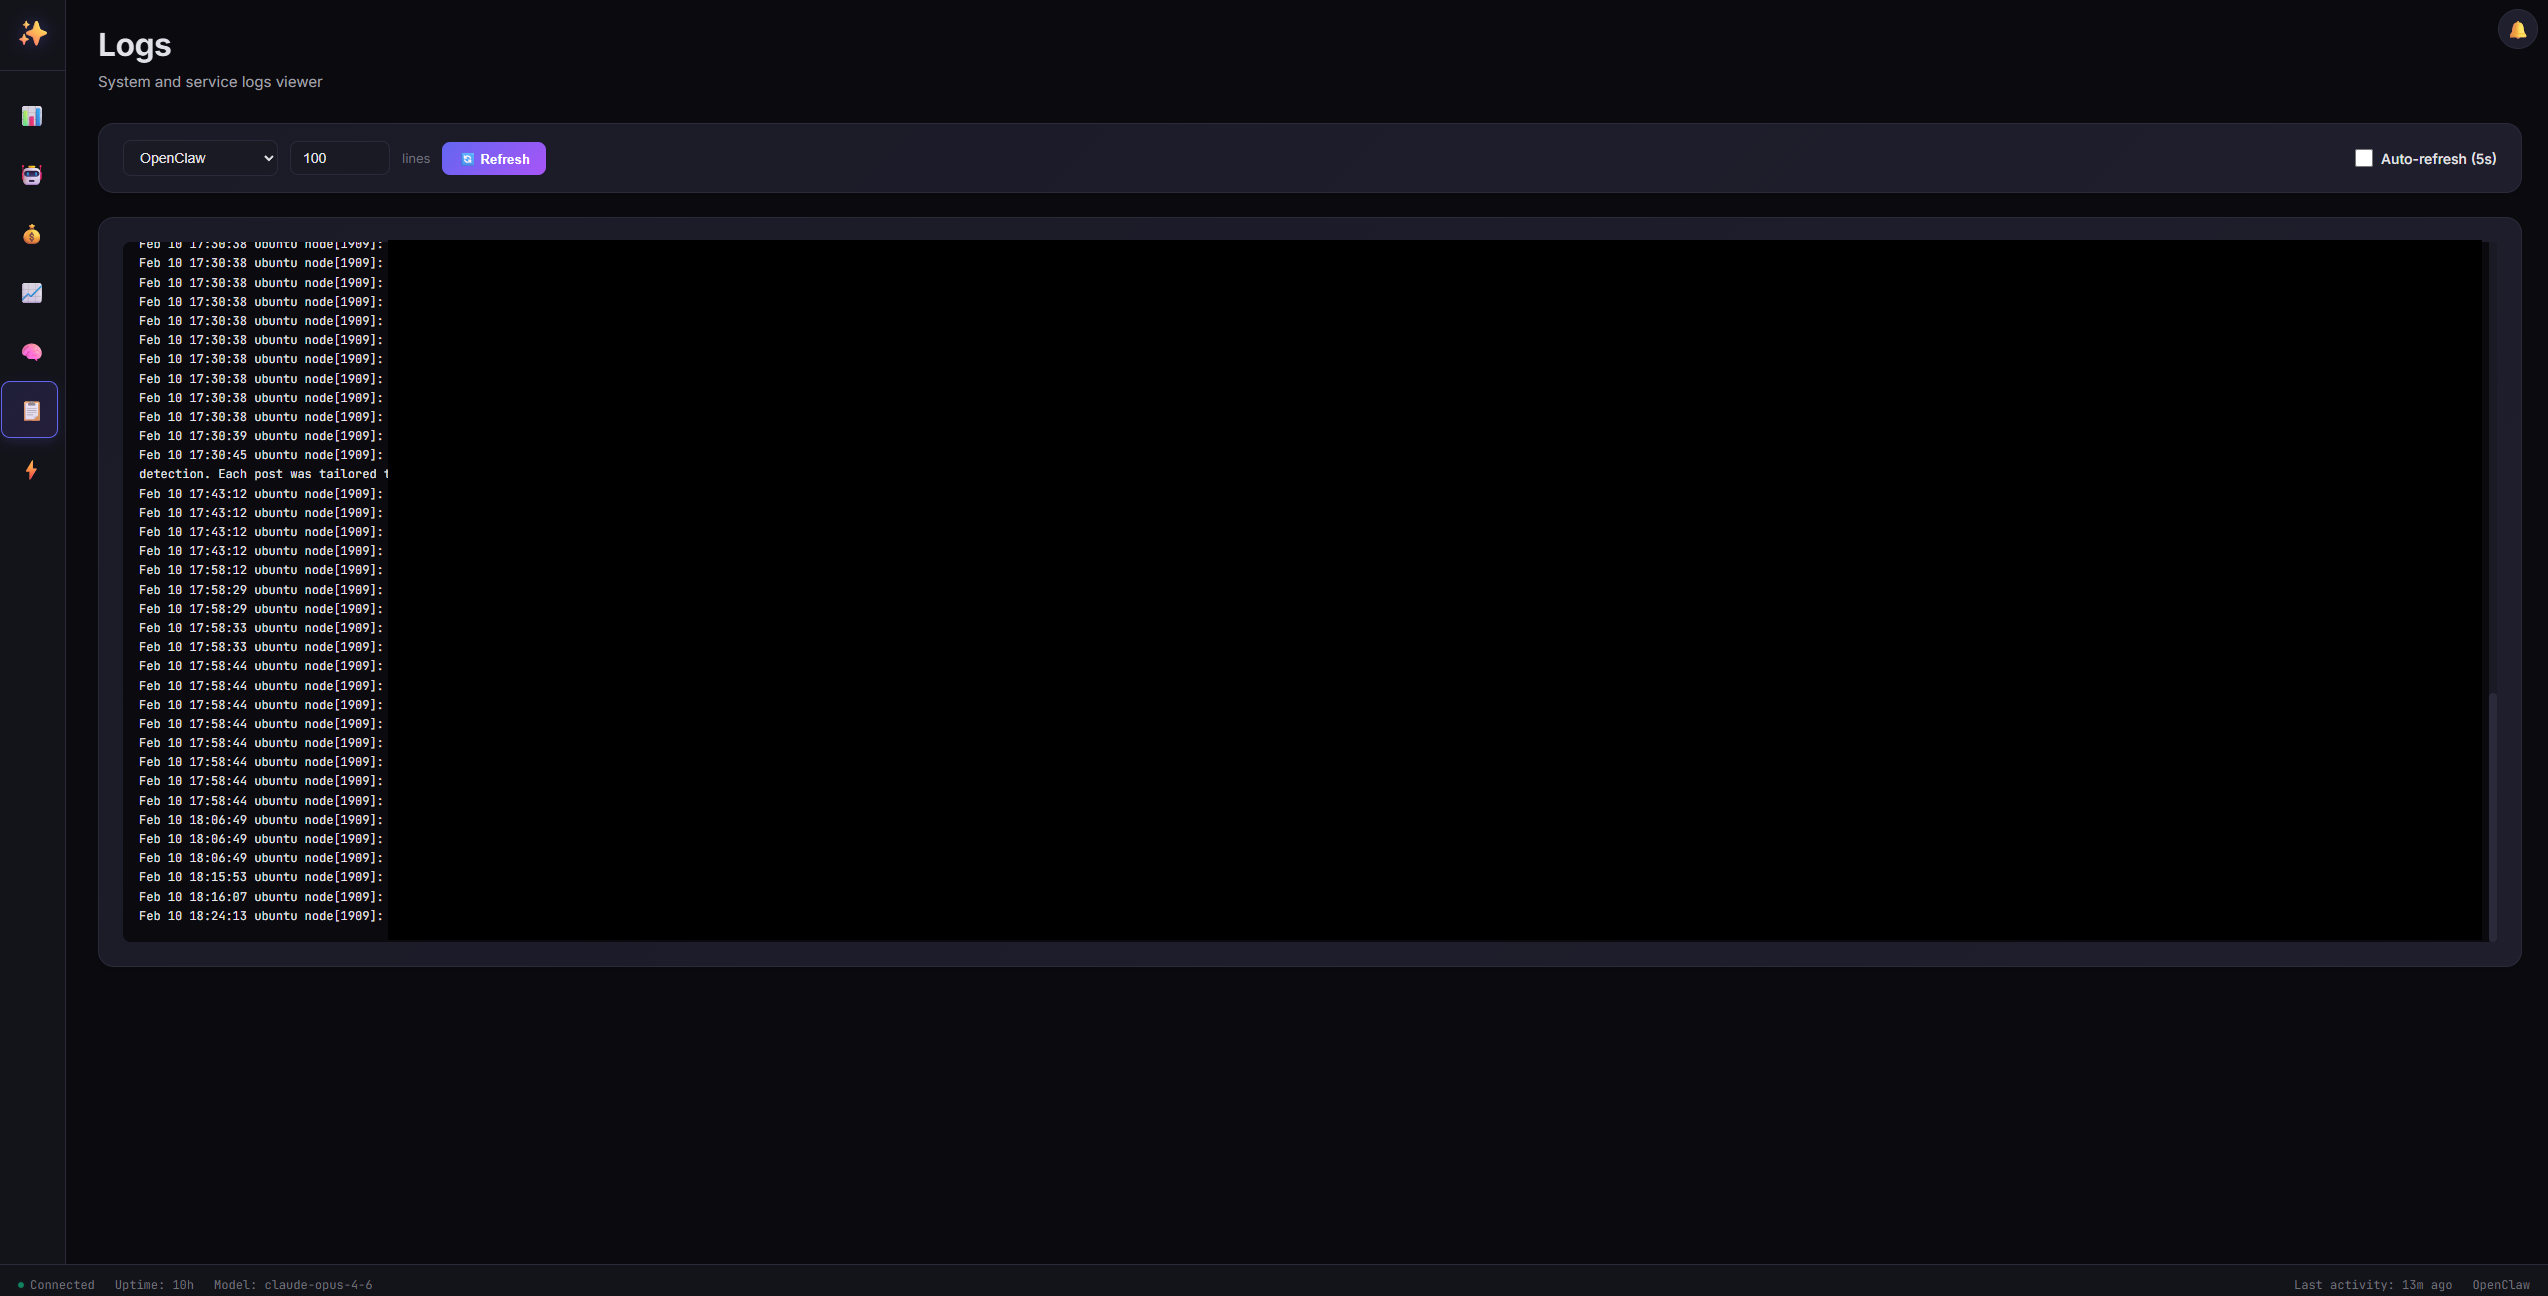 |
jq (Docker page), tmux + python3 (Claude CLI usage scraper), docker (Docker management)# Clone the repository git clone https://github.com/tugcantopaloglu/openclaw-dashboard.git cd openclaw-dashboard # Set your OpenClaw workspace path (optional, auto-detects if not set) export WORKSPACE_DIR=/path/to/your/openclaw/workspace # Start the dashboard node server.js
Visit http://localhost:7000 in your browser. On first visit, you'll see a registration screen where you create your username and password. After registration, log in with your credentials.
node --version)| Tool | Required for | Install |
|---|---|---|
jq |
Docker management page | sudo apt install jq |
tmux |
Claude CLI usage scraper | sudo apt install tmux |
python3 |
Claude CLI usage parser | Usually pre-installed |
docker |
Docker management page | docs.docker.com |
Clone the repository
git clone https://github.com/tugcantopaloglu/openclaw-dashboard.git
cd openclaw-dashboard
Configure environment (optional)
export DASHBOARD_PORT=7000
export WORKSPACE_DIR=/path/to/your/workspace
export OPENCLAW_DIR=$HOME/.openclaw
export OPENCLAW_AGENT=main
Start the server
node server.js
The server will print:
🚀 Dashboard running on http://localhost:7000
🔑 Recovery token: abc123def456...
Save the recovery token — you'll need it if you forget your password.
Access the dashboard
Open http://localhost:7000 and register your account.
To run the dashboard as a system service with auto-start and crash recovery:
sudo ./install.sh
This will:
/etc/systemd/system/agent-dashboard.service/etc/systemd/system/agent-dashboard.service.d/override.confView logs:
journalctl -u agent-dashboard -f
# Build
docker build -t openclaw-dashboard .

# Run
docker run -d \
  --name openclaw-dashboard \
  -p 3001:3001 \
  -e WORKSPACE_DIR=/app/workspace \
  -e DASHBOARD_ALLOW_HTTP=true \
  -v ~/.openclaw:/home/node/.openclaw:ro \
  -v ~/.openclaw/workspace:/app/workspace \
  openclaw-dashboard
For Docker management page access, pass the Docker socket:
docker run -d \
  --name openclaw-dashboard \
  -p 3001:3001 \
  -e WORKSPACE_DIR=/app/workspace \
  -e DASHBOARD_ALLOW_HTTP=true \
  -v ~/.openclaw:/home/node/.openclaw:ro \
  -v ~/.openclaw/workspace:/app/workspace \
  -v /var/run/docker.sock:/var/run/docker.sock:ro \
  --group-add $(stat -c '%g' /var/run/docker.sock) \
  openclaw-dashboard
| Variable | Description | Default |
|---|---|---|
DASHBOARD_PORT |
Server port | 7000 |
DASHBOARD_TOKEN |
Recovery token for password reset | Auto-generated on startup |
WORKSPACE_DIR |
OpenClaw workspace path | $OPENCLAW_WORKSPACE or current directory |
OPENCLAW_DIR |
OpenClaw config directory | ~/.openclaw |
OPENCLAW_AGENT |
Agent ID to monitor | main |
DASHBOARD_ALLOW_HTTP |
Allow HTTP from non-local IPs | false |
Examples:
# Custom port
DASHBOARD_PORT=8080 node server.js

# Custom recovery token
DASHBOARD_TOKEN=my_secret_token_12345 node server.js

# Different workspace
WORKSPACE_DIR=/mnt/data/openclaw node server.js
The dashboard uses username and password authentication with secure server-side sessions.
http://localhost:7000)localStorage)sessionStorage)To prevent brute-force attacks:
Add an extra layer of security with time-based one-time passwords (TOTP).
Once enabled, every login requires:
If you lose access to your authenticator app (lost phone, uninstalled app, etc.):
node -e "const fs=require('fs');const c=JSON.parse(fs.readFileSync('/root/clawd/data/credentials.json','utf8'));delete c.mfaSecret;fs.writeFileSync('/root/clawd/data/credentials.json',JSON.stringify(c,null,2));console.log('MFA cleared')"
systemctl restart agent-dashboard
Important: Adjust the path /root/clawd/data/credentials.json if your workspace is elsewhere.
If you forget your password:
The recovery token (DASHBOARD_TOKEN) is printed when the server starts. You can find it in several places:
journalctl -u agent-dashboard | grep "Recovery token"
Output:
🔑 Recovery token: 3e6b91f352418b486a9aa9d82fbbc1b1
cat /etc/systemd/system/agent-dashboard.service.d/override.conf
Look for:
Environment=DASHBOARD_TOKEN=3e6b91f352418b486a9aa9d82fbbc1b1
If you set it manually:
echo $DASHBOARD_TOKEN
To change your password while logged in:
If everything is locked and you can't log in:
rm /root/clawd/data/credentials.json
systemctl restart agent-dashboard
Warning: This deletes your username, password, and MFA settings. Memory files and audit logs are not affected.
The dashboard is built with security best practices:
data/audit.log*) allowed.bak files created before overwriting workspace filesThe dashboard is designed for local or Tailscale access:
http://localhost:7000http://100.x.x.x:7000
DASHBOARD_ALLOW_HTTP=true)By default, the dashboard blocks HTTP access from non-local IPs. Exemptions:
For other networks, the dashboard requires HTTPS or the X-Forwarded-Proto: https header (from a reverse proxy).
To allow HTTP from all IPs (not recommended):
DASHBOARD_ALLOW_HTTP=true node server.js
This dashboard is NOT hardened for public internet exposure. While it has authentication and rate limiting, it's designed for private networks. If you must expose it:
Problem: You see "Too many failed login attempts. Please try again later."
Solutions:
systemctl restart agent-dashboard
Problem: Your password was changed but you can't log in.
Solution: Use the "Forgot password?" flow with your recovery token to set a new password.
Problem: The 6-digit TOTP code is rejected.
Solutions:
Problem: Browser shows a blank page or connection error.
Solutions:
systemctl status agent-dashboard
journalctl -u agent-dashboard -n 50
curl http://localhost:7000/api/auth/statusShould return:
{"authenticated": false, "requiresRegistration": false}
Problem: Browser shows "HTTPS required. Access via localhost, Tailscale, or enable HTTPS."
Solutions:
http://localhost:7000http://100.x.x.x:7000DASHBOARD_ALLOW_HTTP=true in environment (not recommended):
# Add to /etc/systemd/system/agent-dashboard.service.d/override.conf
Environment=DASHBOARD_ALLOW_HTTP=true

# Reload and restart
systemctl daemon-reload
systemctl restart agent-dashboard
Problem: Dashboard shows a blank page after pulling new code.
Solutions:
Ctrl+Shift+R (Windows/Linux) or Cmd+Shift+R (macOS)The dashboard exposes a REST API for programmatic access. All endpoints require authentication via Authorization: Bearer <sessionToken> header.
GET /api/auth/status — Check authentication statusPOST /api/auth/login — Log in with username/password (+ TOTP if MFA enabled)POST /api/auth/register — Register a new account (only if no credentials exist)POST /api/auth/reset-password — Reset password with recovery tokenAll other endpoints require authentication:
GET /api/config — Dashboard configurationGET /api/sessions — List all agent sessionsGET /api/usage — 5-hour rolling window usage dataGET /api/costs — Spending data by day, model, and sessionGET /api/system — System health metricsGET /api/memory-files — List memory filesGET /api/memory-file?path=<path> — Read a memory fileGET /api/key-files — List workspace files (skills, configs)GET /api/key-file?path=<name> — Read a workspace filePOST /api/key-file — Write to a workspace file (with backup)GET /api/crons — List cron jobsPOST /api/cron/<id>/toggle — Enable/disable a cron jobPOST /api/cron/<id>/run — Manually trigger a cron jobGET /api/logs?service=<service>&lines=<N> — Fetch system logsPOST /api/action/<action> — Run quick actions (restart-openclaw, restart-dashboard, etc.)POST /api/claude-usage-scrape — Trigger Claude usage scrapeGET /api/claude-usage — Get last scraped Claude usagePOST /api/gemini-usage-scrape — Trigger Gemini usage scrapeGET /api/gemini-usage — Get last scraped Gemini usageGET /api/live — Server-Sent Events stream of real-time messagesGET /api/notifications?limit=<N> — Audit log events for notification centerPOST /api/reauth — Re-authenticate for sensitive pages (Security, Config)GET /api/openclaw-config — Read OpenClaw configuration filePUT /api/openclaw-config — Save config with auto-backup and gateway restartGET /api/sys-security — System security info (UFW, ports, fail2ban, SSH logs)GET /api/docker — List Docker containers, images, and system usagePOST /api/docker/action — Docker actions (start/stop/restart container, prune)GET /api/services — List systemd servicesPOST /api/services/action — Service actions (start/stop/restart, whitelisted only)For detailed request/response examples, see the previous version of this README or explore the API in the browser's Network tab.
The dashboard stores data in your workspace directory:
| File | Purpose |
|---|---|
data/credentials.json |
Username + hashed password + MFA secret |
data/audit.log |
Security audit trail (auto-rotates at 10MB) |
data/health-history.json |
CPU/RAM/Temp/Disk history for sparklines |
data/claude-usage.json |
Last scraped Claude usage data |
data/gemini-usage.json |
Last scraped Gemini usage data |
Credentials file structure:
{
  "username": "admin",
  "passwordHash": "pbkdf2_sha512$100000$...",
  "salt": "...",
  "mfaSecret": "BASE32SECRET..." // Only if MFA enabled
}
The dashboard automatically detects:
$OPENCLAW_DIR/agents/$AGENT_ID/sessions/$OPENCLAW_DIR/cron/jobs.json$WORKSPACE_DIR/MEMORY.md, HEARTBEAT.md, and memory/*.md$WORKSPACE_DIR/projects/*/$WORKSPACE_DIR/data/health-history.jsonThe dashboard works best when these files exist:
$WORKSPACE_DIR/MEMORY.md - Agent long-term memory$WORKSPACE_DIR/HEARTBEAT.md - Heartbeat task list$WORKSPACE_DIR/memory/YYYY-MM-DD.md - Daily memory notes$WORKSPACE_DIR/scripts/scrape-claude-usage.sh - Claude usage scraper$WORKSPACE_DIR/scripts/parse-claude-usage.py - Claude usage parser$WORKSPACE_DIR/scripts/scrape-gemini-usage.sh - Gemini usage scraper$WORKSPACE_DIR/scripts/parse-gemini-usage.py - Gemini usage parser| Key | Action |
|---|---|
1 |
Switch to Overview |
2 |
Switch to Sessions |
3 |
Switch to Costs |
4 |
Switch to Rate Limits |
5 |
Switch to Memory |
6 |
Switch to Files |
7 |
Switch to Live Feed |
8 |
Switch to Logs |
9 |
Switch to Security |
Space |
Pause/Resume Feed (when on Live Feed page) |
/ |
Focus search box |
Esc |
Close modals and overlays |
? |
Show keyboard shortcuts help |
Contributions are welcome! Please follow these guidelines:
git checkout -b feature/amazing-feature)git commit -m 'Add amazing feature')git push origin feature/amazing-feature)git clone https://github.com/tugcantopaloglu/openclaw-dashboard.git cd openclaw-dashboard export WORKSPACE_DIR=/path/to/test/workspace node server.js
The dashboard has no build step — edit server.js or index.html and reload.
MIT License - see LICENSE file for details.
Made with ✨ by Tuğcan Topaloğlu
more like this
🎉🌟✨🎈年会抽奖程序,基于 Express + Three.js的 3D 球体抽奖程序,奖品🧧🎁,文字,图片,抽奖规则均可配置,😜抽奖人员信息Excel一键导入😍,抽奖结果Excel导出😎,给你的抽奖活动带来全新酷炫体验🚀🚀🚀
Comprehensive analytics dashboard for AI coding agents — Cursor, Windsurf, Claude Code, VS Code Copilot, Zed, Antigravi…
Skill Claude Code de veille tech francophone. Agrège les flux RSS (Journal du Hacker, Human Coders News…) et produit un…
search projects, people, and tags