agentlytics
Comprehensive analytics dashboard for AI coding agents — Cursor, Windsurf, Claude Code, VS Code Copilot, Zed, Antigravi…
JavaScript★ 555
Tri color e-ink dashboard written in Python 3.7, running on Raspberry Pi
 zoharsf
git clone https://github.com/zoharsf/Raspberry-Pi-E-Ink-Dashboard.gitzoharsf/Raspberry-Pi-E-Ink-Dashboard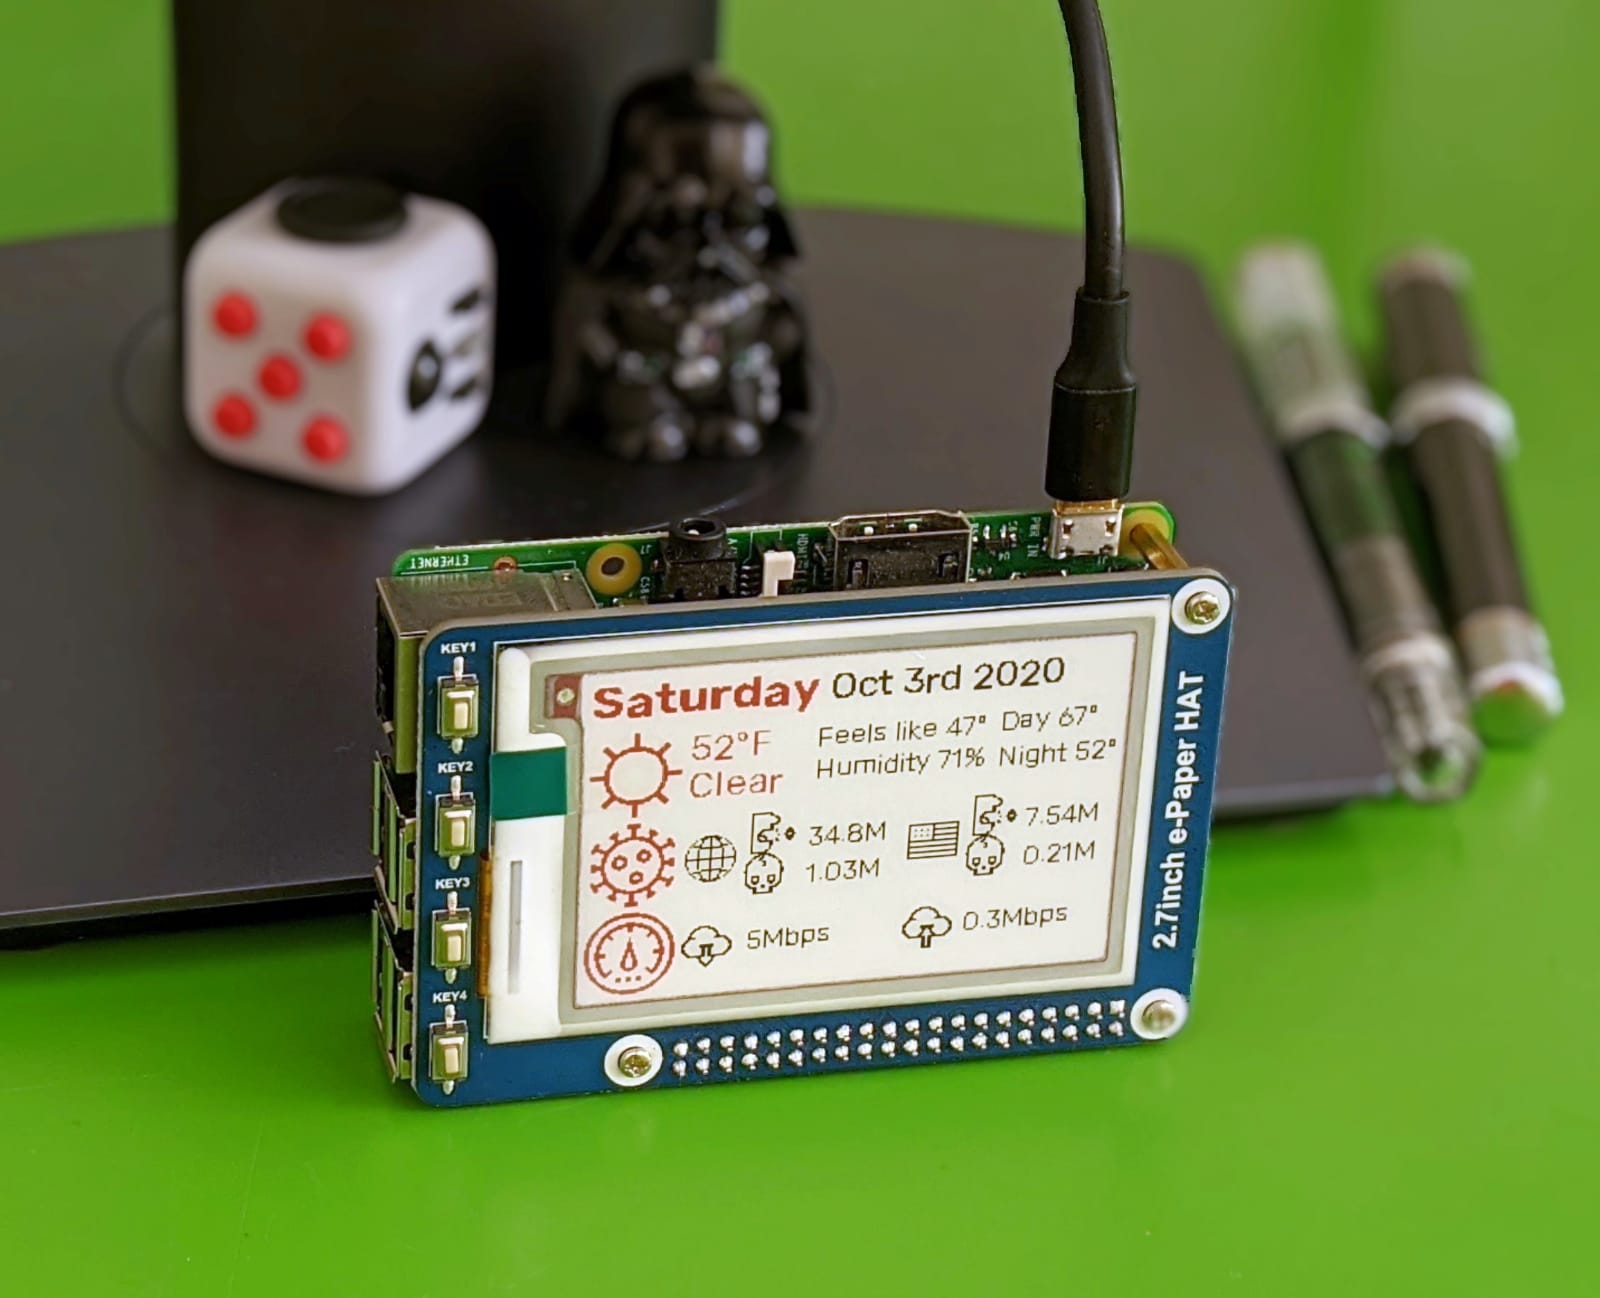
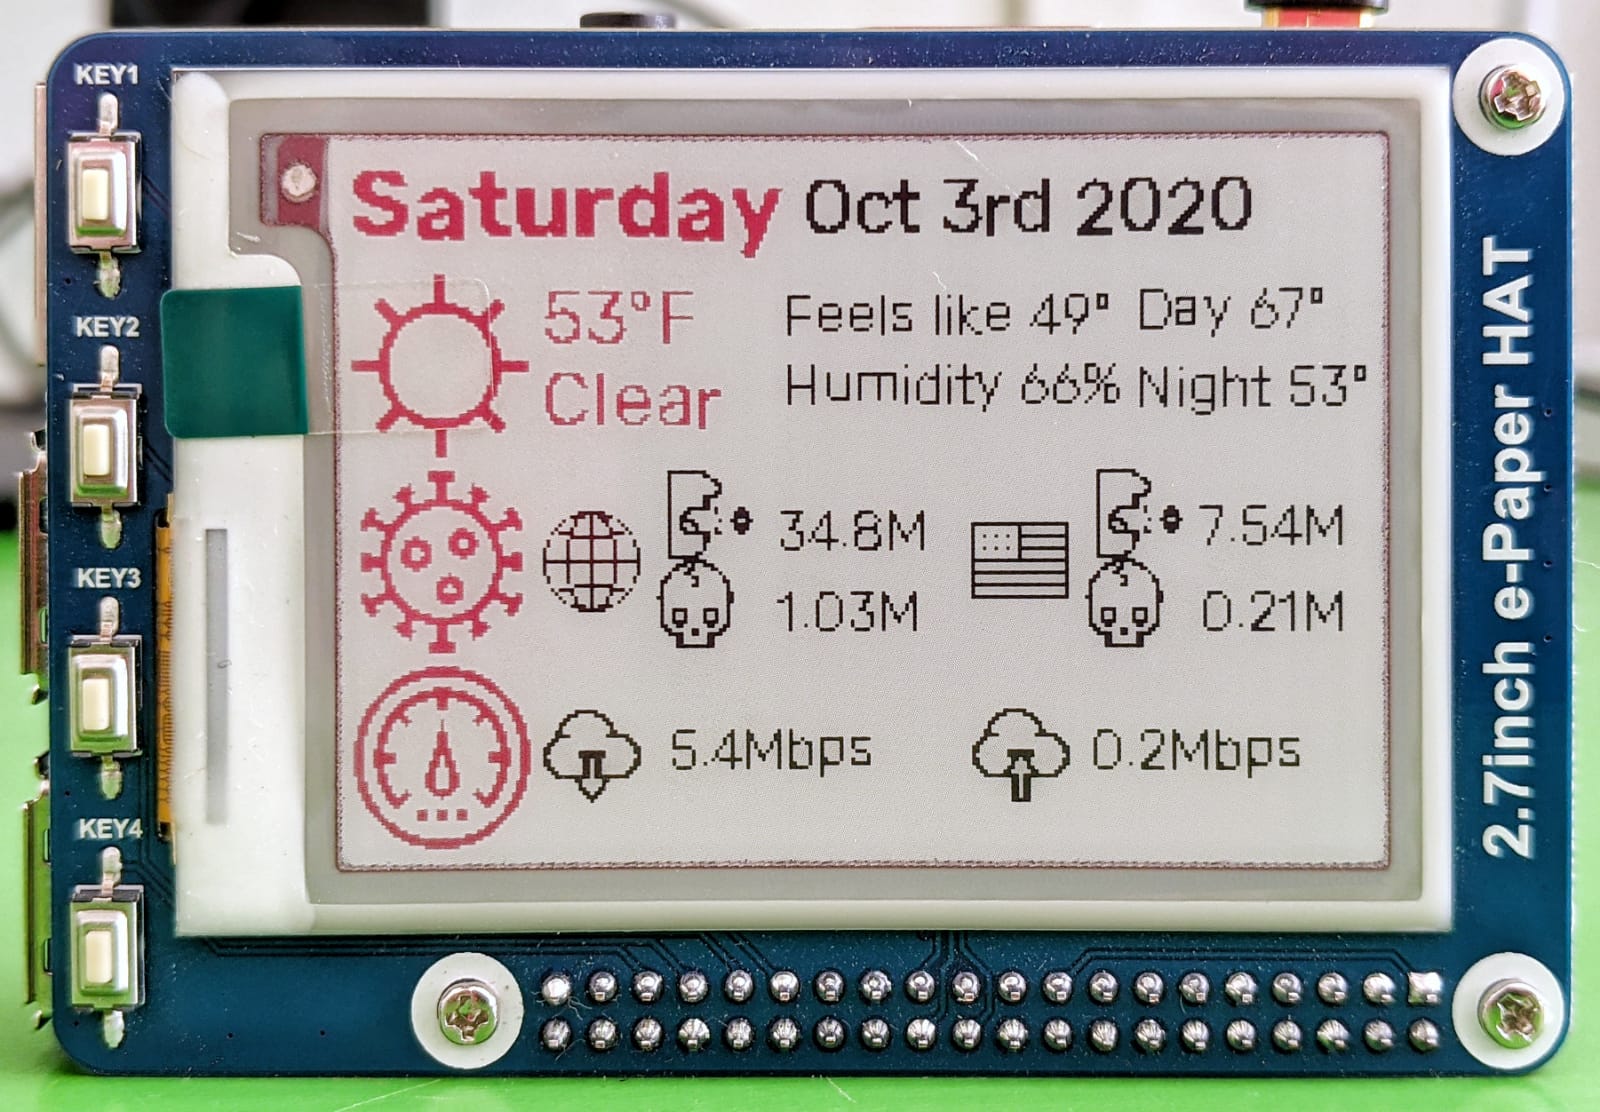
This dashboard displays information easily read at a glance:
Any information can be displayed on the display (to-do list items, calendar events for the day, current song playing on Spotify)
This dashboard uses two data sources accessed via REST API:
Any datasource can be used instead of the ones chosen for this dashboard, but changing the datasource will require modifying the parsing of the response
And two local data sources:
Any font may be used instead of Rubik, but not all fonts will look good on the display, especially in smaller sizes.
<country_name>.jpeg flag icon must be added under dashboard/assets/covid..env file to store user specific values that you would not want to include in your git commits. An example of this file and format can be found in the dotenv-example file.
lon and lat are used to gather weather information for the desired locationopen_weather_map_api_key is the openweathermap.org API key.
An account is required to access the openweathermap.org weather API, you can register for free here.
Config.py file which holds all the configurations required to run the dashboard. In order for the dashboard to run correctly, all of the properties must be provided:
units used to determine which temperature units will be used in the weather request. Options are imperial for Fahrenheit and metric for Celsiusunit_letter used to determine which temperature letter will be used in the display. F for Fahrenheit and C for Celsiuscountry is used to query Covid-19 data and to load the flag icon so it must match the <country_name>.jpeg[small\medium\large]_font_[size\name] were chosen to fit the size of the e-ink displayEvery application that includes usage of an e-ink display will require two files provided by the manufacturer:
epd2in7b.pyandepdconfig.py. These files have been provided and are in thelibfolder in the repository so no configuration is required.
Running the dashboard requires the following steps:
main.py scriptThis will display the dashboard on the display and will not be cleared even if the Raspberry Pi is shut down or disconnected from a power source. In order to refresh the dashboard in a predefined interval, using crontab is recommended:
crontab -e in the CLI*/30 * * * * cd /absolute/path/to/the/project/folder && python3 main.pyThe meaning of
*/30 * * * *is "run the following command at the top of the hour and 30 minutes past the top of the hour". More examples may be found here.
Keep in mind that it takes the dashboard approximately 70 seconds to load the required data and another 33 seconds for the display to clear and refresh, so running it too often won't be effective. Not to mention that the screen flickers when refreshing which is distracting.
lon and lat valueslon and lat valuesmore like this
Comprehensive analytics dashboard for AI coding agents — Cursor, Windsurf, Claude Code, VS Code Copilot, Zed, Antigravi…
meine 🌒 - A CLI file manager and system utility built with Textual. It combines intuitive command parsing with rich t…
Launcher and management utility for running an Astroneer Dedicated Server on Linux using WINE
search projects, people, and tags