 GuangchuangYu
agentlytics
Comprehensive analytics dashboard for AI coding agents — Cursor, Windsurf, Claude Code, VS Code Copilot, Zed, Antigravi…
JavaScript★ 555
Please visit https://github.com/YuLab-SMU/nCov2019 for an up-to-date version.
This package is one of the earliest R packages that designed to query COVID data. It is available since Jan. 2020, at the time there were few data resources available (see our blog post (in Chinese) (Feb. 03, 2020) and another blog post by third party (in English) (Feb. 11, 2020)).
Wuhan-2019-nCoV GitHub repository.
National Health Commission of the People’s Republic of China
We collect historical province level data for oversea countries form this source. (Start from 2020-03-15)
The user can obtain the historical provincial data in China, South Korea, United States, Japan, Iran, Italy, Germany and United Kingdom now.
For example, the below will return the historical data for Italy.
library(nCov2019)
nCov2019_set_country(country = 'Italy')
x['province'] # this will return Italy data only.
For more details see our vignette, Preprint, and Shiny app.
If you use nCov2019, please cite the following paper:
Wu T, Hu E, Ge X*, Yu G*. 2021. nCov2019: an R package for studying the COVID-19 coronavirus pandemic. PeerJ 9:e11421 https://doi.org/10.7717/peerj.11421
Get the development version from github:
## install.packages("remotes")
remotes::install_github("GuangchuangYu/nCov2019")
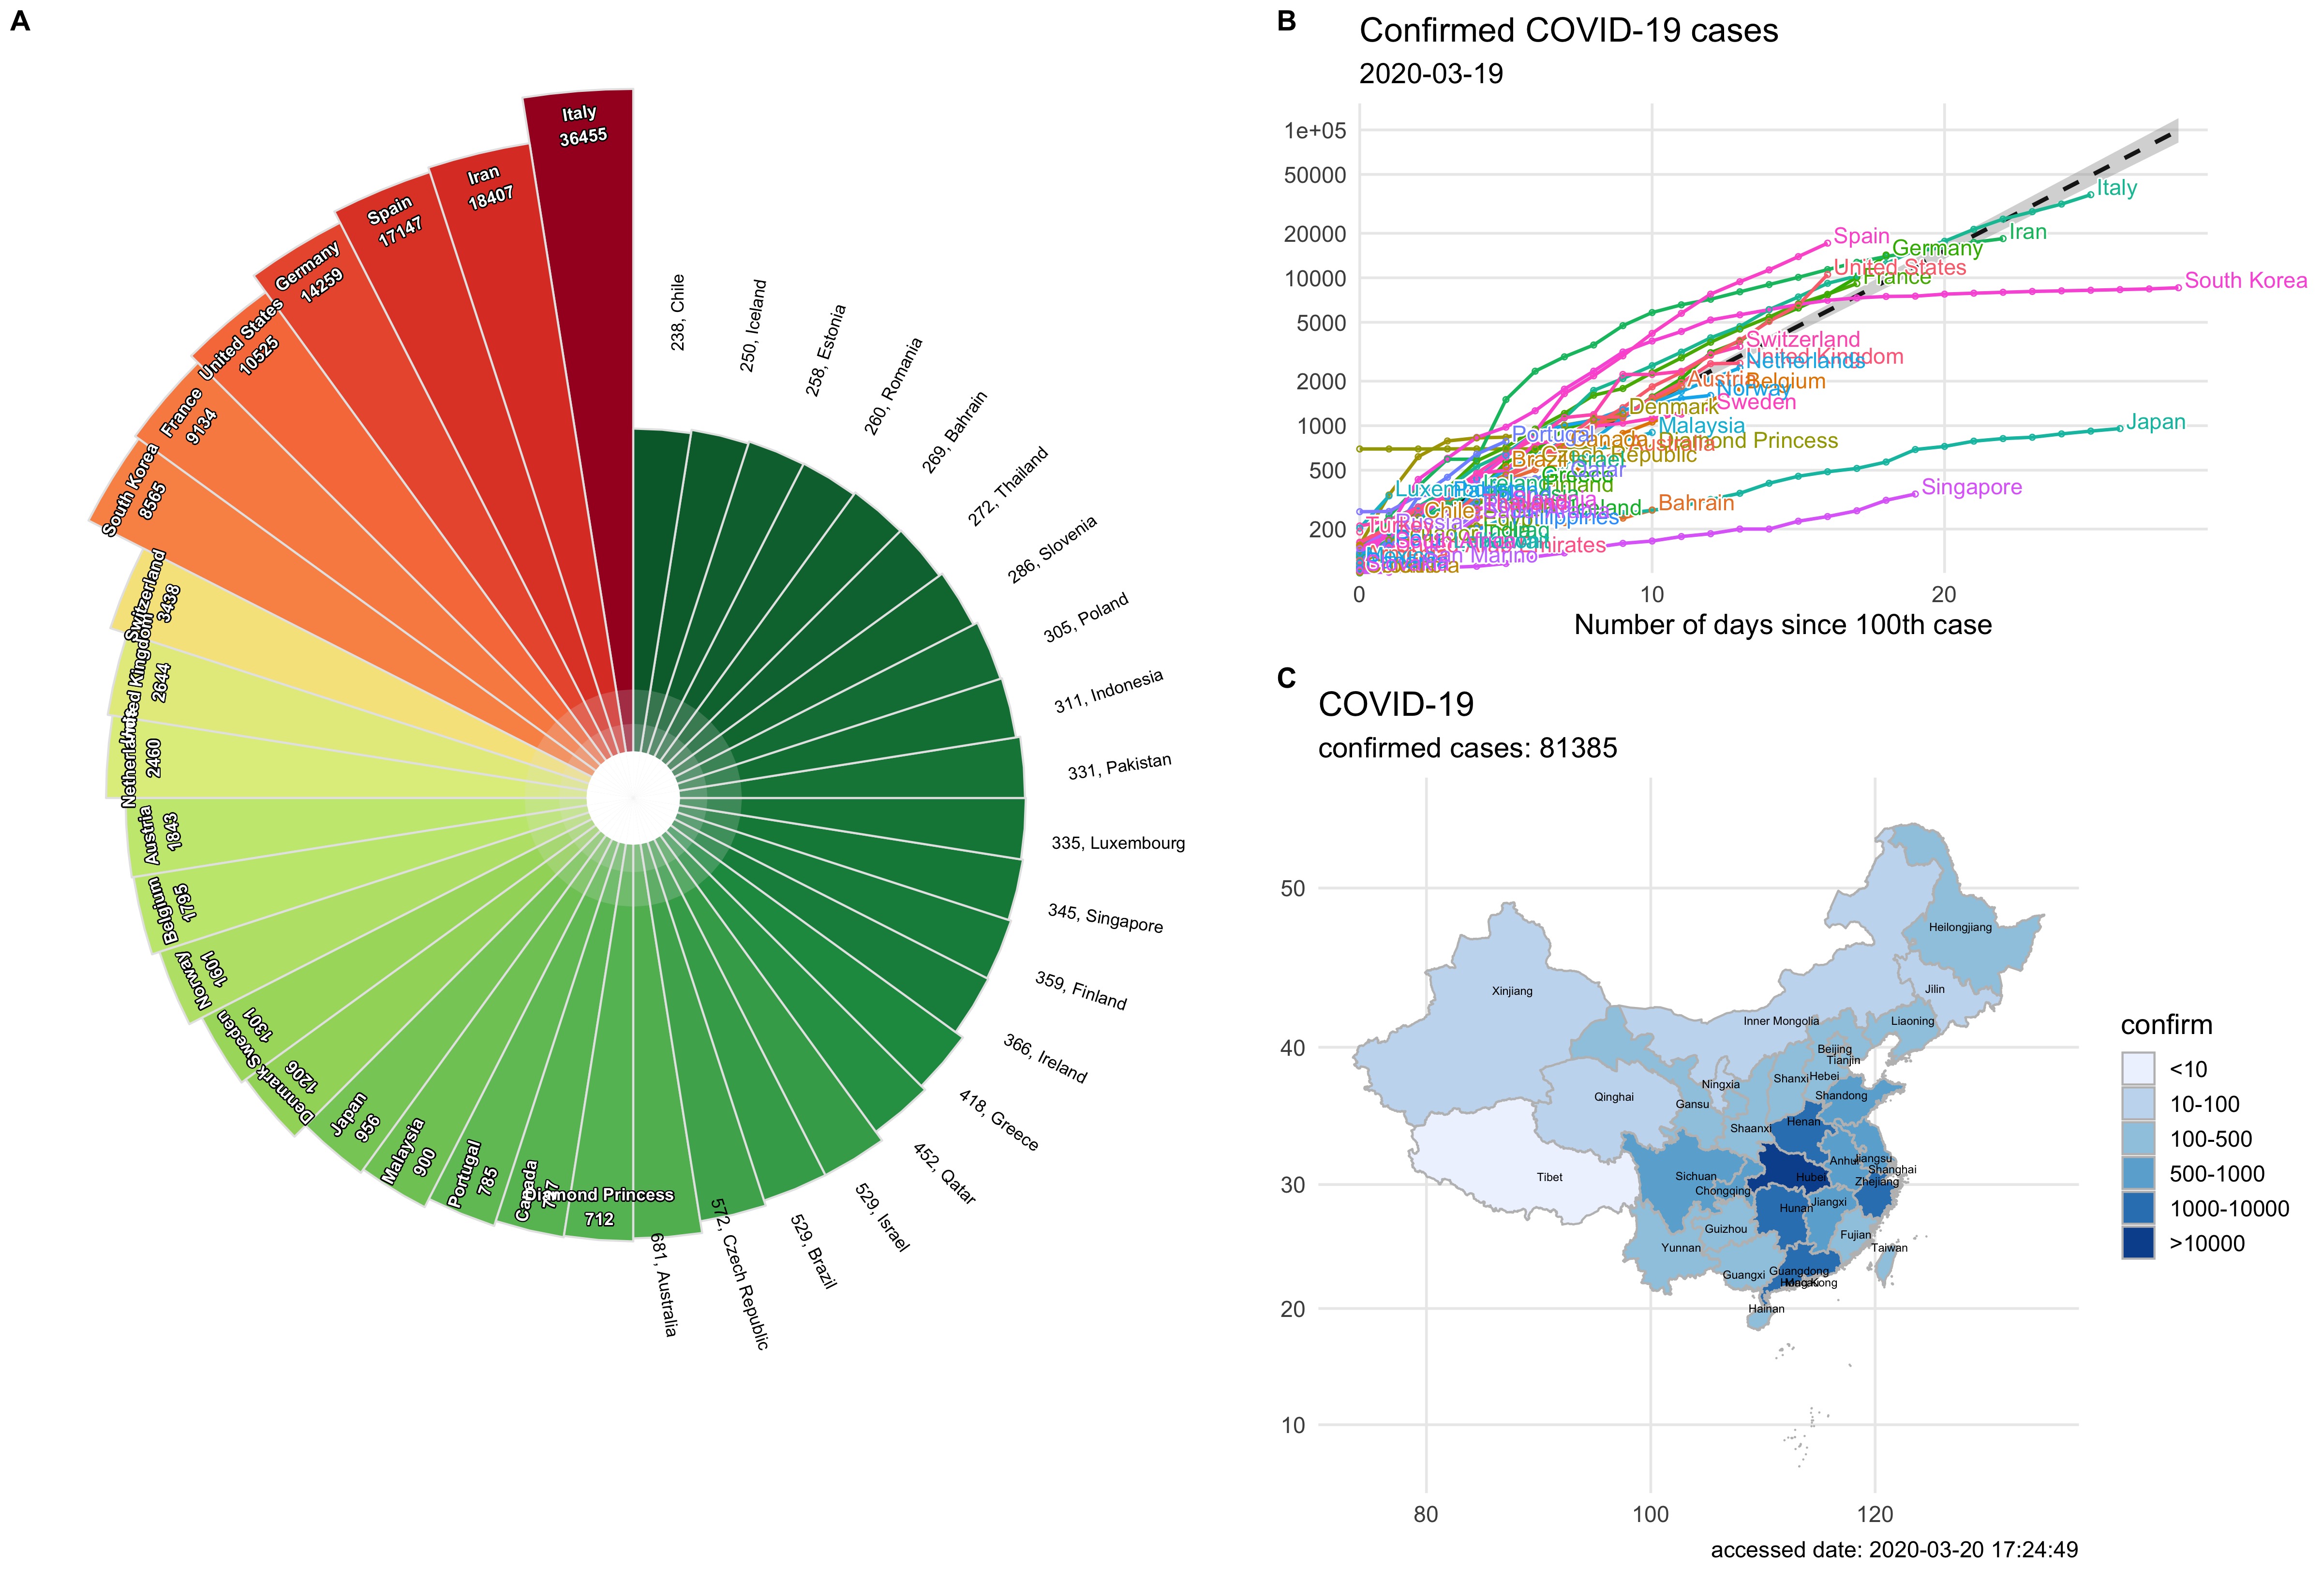
get_nCov2019() to query online latest informationload_nCov2019() to get historical datanCov2019_set_country() to set country optionssummary and [ to access dataplot to present data on mapdashboard() to open Shiny app dashboardRun the script example.R in R using source("example.R"), will produce the following figure:
nCov2019more like this
Comprehensive analytics dashboard for AI coding agents — Cursor, Windsurf, Claude Code, VS Code Copilot, Zed, Antigravi…
an efficient and user friendly OTA server equipped with a powerful WEB UI, designed to effortlessly manage both your ES…
PlexWatch is a Discord bot that provides a real-time dashboard for your Plex media server, featuring active stream moni…
search projects, people, and tags