lottery
🎉🌟✨🎈年会抽奖程序,基于 Express + Three.js的 3D 球体抽奖程序,奖品🧧🎁,文字,图片,抽奖规则均可配置,😜抽奖人员信息Excel一键导入😍,抽奖结果Excel导出😎,给你的抽奖活动带来全新酷炫体验🚀🚀🚀
JavaScript★ 4.6k
A data visualizer that uses " Node Application Metrics" (appmetrics) to monitor and display Node.js application data as…
 RuntimeTools
git clone https://github.com/RuntimeTools/appmetrics-dash.gitRuntimeTools/appmetrics-dash
Node Application Metrics Dashboard (appmetrics-dash) provides a very easy-to-use web based dashboard to show the performance metrics of your running Node.js application.
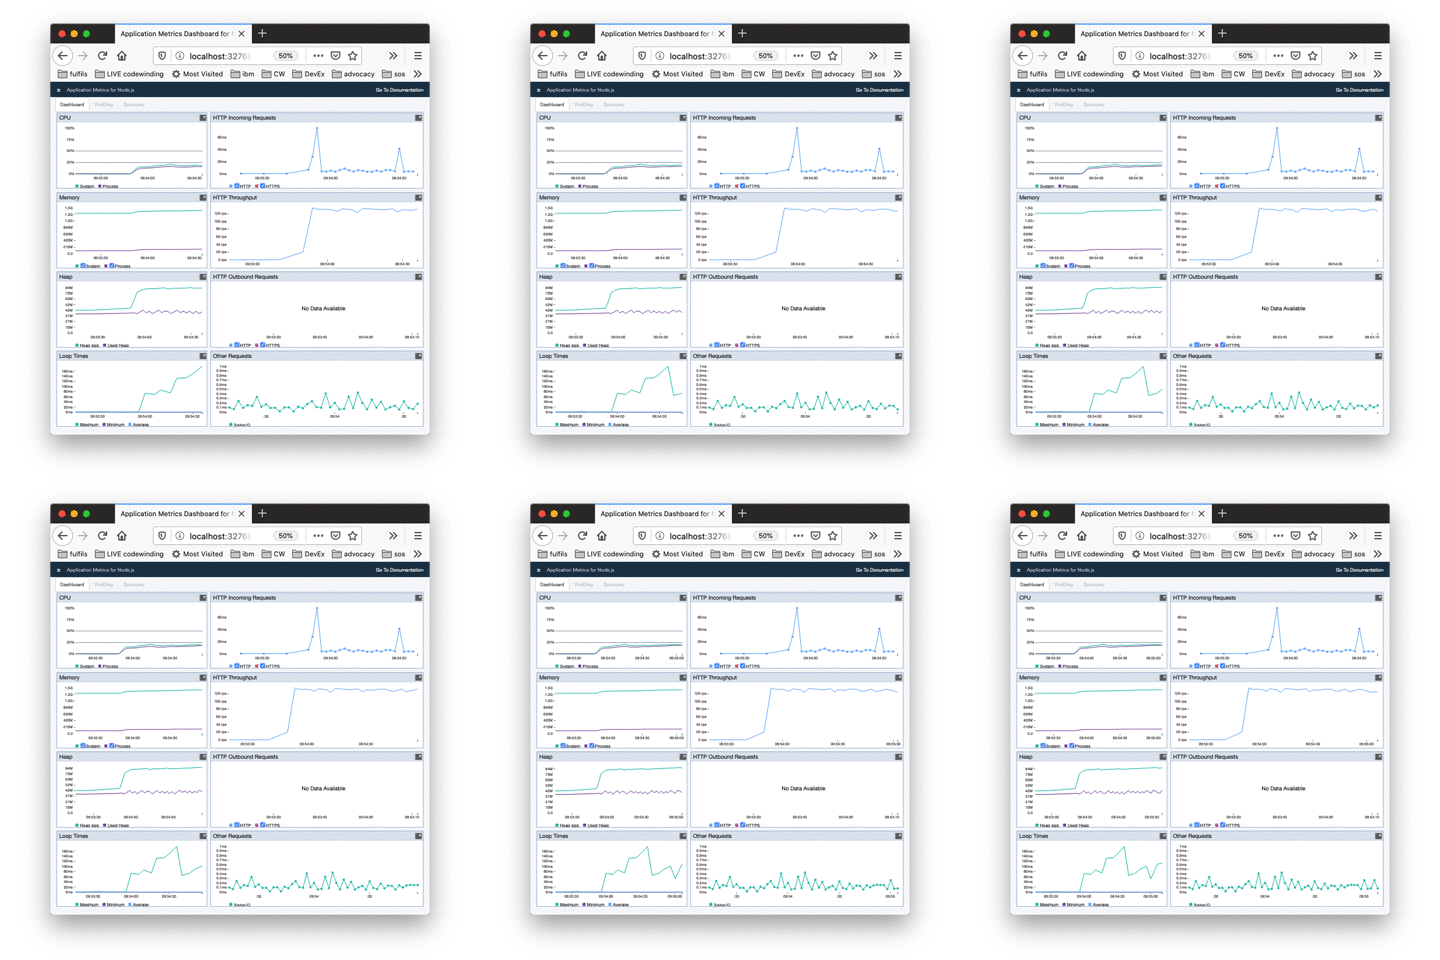
If you want to add the dashboard to all HTTP servers created by your application then simply add:
// Before all other 'require' statements:
require('appmetrics-dash').attach();
to the very top of your main JavaScript source file.
Alternatively, to use preloading:
$ node --require appmetrics-dash/attach app.js
or use the NODE_OPTIONS environment variable:
$ export NODE_OPTIONS="--require appmetrics-dash/attach"
If you want to add the dashboard to one specific HTTP server then use:
var dash = require('appmetrics-dash');
// Other 'require' statements here
// Create HTTP server 'myHttpServer' here
dash.monitor({server: myHttpServer});
If you are not creating an HTTP server then use:
// Before all other 'require' statements:
require('appmetrics-dash').monitor();
or run your program with
$ node --require appmetrics-dash/monitor app.js
or via the NODE_OPTIONS environment variable:
$ export NODE_OPTIONS="--require appmetrics-dash/monitor"
This creates a new server for the dashboard on port 3001 by default. The path defaults to /appmetrics-dash.
E.g. http://localhost:3001/appmetrics-dash
The data available on the dashboard is as follows:
As well as displaying data, it also provides the ability to generate both Node Report and Heap Snapshots directly from the dashboard. The Node Report will display in a new tab in the browser whilst the Heap Snapshot will be written to disk for loading into the Chrome DevTools for analysis. These can both be triggered from the options menu in the top left of the screen
The dashboard uses Node Application Metrics to monitor the application.
npm install appmetrics-dash
Our testing has shown that the performance overhead in terms of processing is minimal, adding less than 0.5 % to the CPU usage of your application. The additional memory required is around 30 MB to gather information about your system and application which is then visualized in the dashboard.
We gathered this information by monitoring the sample application Acme Air. We used MongoDB as our datastore and used JMeter to drive load though the program. We have performed this testing with Node.js version 6.10.3
dash.monitor().Auto-attach to all http servers created after this call, calling dash.monitor(options) for every server.
Simple example using attach
var dash = require('appmetrics-dash');
dash.attach();

var http = require('http');

const port = 3000;

const requestHandler = (request, response) => {
  response.end('Hello')
}

const server = http.createServer(requestHandler);

server.listen(port, (err) => {
  if (err) {
    return console.log('An error occurred', err)
  }
  console.log(`Server is listening on ${port}`)
});
'/appmetrics-dash'.console.log() and console.error(). Optional, defaults to the global
console object.http server to serve the
dashboard from. Optional, default is to create a server (see port and
host).server option is used.server option is used.require('appmetrics') can be
injected if the application wants to use appmetrics, since it is a singleton
module and only one can be present in an application. Optional, defaults to
the appmetrics dependency of this module.require('node-report') can be
injected if the application wants to use node-report, since it is a singleton
module and only one can be present in an application. Optional, defaults to
the node-report dependency of this module.
The ability to generate reports can be disabled by setting this to null or
undefined.We welcome contributions. Please see CONTRIBUTING.md for details about the contributor licence agreement and other information. If you want to do anything more involved than a bug fix or a minor enhancement then we would recommend discussing it in an issue first before doing the work to make sure that it's likely to be accepted. We're also keen to improve test coverage and may not accept new code unless there are accompanying tests.
This module adopts the Module Long Term Support (LTS) policy, with the following End Of Life (EOL) dates:
| Module Version | Release Date | Minimum EOL | EOL With | Status |
|---|---|---|---|---|
| V4.x.x | Jun 2018 | Dec 2019 | Current |
The Node Application Metrics Dashboard is licensed using an Apache v2.0 License.
more like this
🎉🌟✨🎈年会抽奖程序,基于 Express + Three.js的 3D 球体抽奖程序,奖品🧧🎁,文字,图片,抽奖规则均可配置,😜抽奖人员信息Excel一键导入😍,抽奖结果Excel导出😎,给你的抽奖活动带来全新酷炫体验🚀🚀🚀
Comprehensive analytics dashboard for AI coding agents — Cursor, Windsurf, Claude Code, VS Code Copilot, Zed, Antigravi…
an efficient and user friendly OTA server equipped with a powerful WEB UI, designed to effortlessly manage both your ES…
search projects, people, and tags