matplotplusplus
Matplot++: A C++ Graphics Library for Data Visualization 📊🗾
 alandefreitas
git clone https://github.com/alandefreitas/matplotplusplus.gitalandefreitas/matplotplusplusMatplot++
A C++ Graphics Library for Data Visualization

Data visualization can help programmers and scientists identify trends in their data and efficiently communicate these results with their peers. Modern C++ is being used for a variety of scientific applications, and this environment can benefit considerably from graphics libraries that attend the typical design goals toward scientific data visualization. Besides the option of exporting results to other environments, the customary alternatives in C++ are either non-dedicated libraries that depend on existing user interfaces or bindings to other languages. Matplot++ is a graphics library for data visualization that provides interactive plotting, means for exporting plots in high-quality formats for scientific publications, a compact syntax consistent with similar libraries, dozens of plot categories with specialized algorithms, multiple coding styles, and supports generic backends.
READ THE DOCUMENTATION FOR A QUICK START AND EXAMPLES
Table of Contents
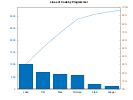
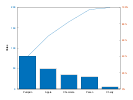
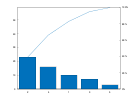
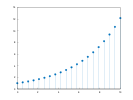
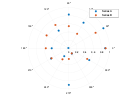
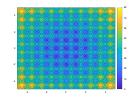
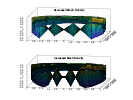
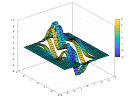
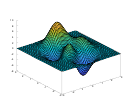
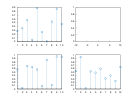
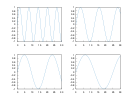
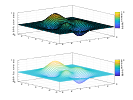
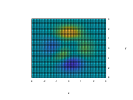
Gallery


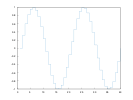


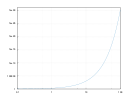


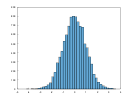
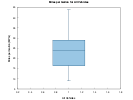










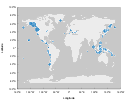









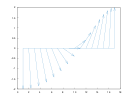
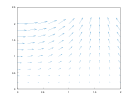













Complete Gallery





















































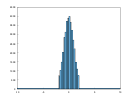



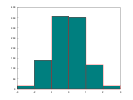

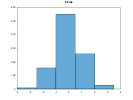
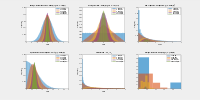























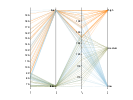
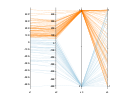





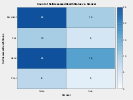
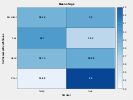
























































































































































































































































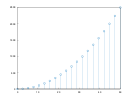




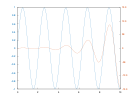

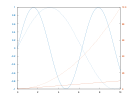


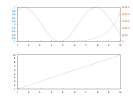




































































Integration
Package Managers
Vcpkg
Vcpkg users can install Matplot++ with the matplotplusplus port:
vcpkg install matplotplusplus
This formula is a contribution to vcpkg by @myd7349.
Homebrew
Mac users can install Matplot++ with Homebrew:
brew install matplotplusplus
This formula is a contribution to Homebrew by Andrew Kane.
Arch Linux
Matplot++ is available in the Arch User Repository
(AUR) as
matplotplusplus.
Note you can manually install the package by following the instructions on the
Arch Wiki
or use an AUR helper like
yay
(recommended for ease of install).
yay -S matplotplusplus
To discuss any issues related to this package refer to the comments section on
the AUR page of matplotplusplus here.
CMake
Embed as Subdirectory
You can use Matplot++ directly in CMake projects as a subproject, without installing it. This is convenient if you are experimenting with this library for the first time or don't expect your users to have Matplot++ installed on their systems.
Check if you have Cmake 3.14+ installed:
cmake --version
Clone the whole project
git clone https://github.com/alandefreitas/matplotplusplus/
and add the subdirectory to your CMake project:
add_subdirectory(matplotplusplus)
When creating your executable, link the library to the targets you want:
add_executable(my_target main.cpp)
target_link_libraries(my_target PUBLIC matplot)
Add this header to your source files:
#include <matplot/matplot.h>
However, in larger projects, it's always recommended to look for Matplot++ with find_package before including it as a subdirectory to avoid ODR errors.
Install as a Package via CMake
If you have CMake 3.21 or greater, you can use the system build preset to
build the package system-wide:
cmake --preset=system
cmake --build --preset=system
sudo cmake --install build/system
Alternatively, if the CMAKE_PREFIX_PATH environment variable is set to
$HOME/.local, then you can install it locally. This can be set in /etc/profile
or your shell config. This will not affect discovery of packages installed
system-wide.
export CMAKE_PREFIX_PATH="$HOME/.local"
This has the advantage of not
requiring sudo, and matplotplusplus will be installed in $HOME/.local.
cmake --preset=local
cmake --build --preset=local
cmake --install build/local
You can now use it from CMake with find_package:
find_package(Matplot++ REQUIRED)

target_link_libraries(<your target> Matplot++::matplot)
If you're using a version of CMake too old to support presets, then building with the system preset is equivilant to:
cmake -B build/system         \
    -DMATPLOTPP_BUILD_EXAMPLES=OFF      \
    -DMATPLOTPP_BUILD_SHARED_LIBS=ON    \
    -DMATPLOTPP_BUILD_TESTS=OFF         \
    -DCMAKE_BUILD_TYPE=Release \
    -DCMAKE_INTERPROCEDURAL_OPTIMIZATION=ON

cmake --build build/system
While building with the local preset is equivilant to:
cmake -B build/local                      \
    -DMATPLOTPP_BUILD_EXAMPLES=OFF                  \
    -DMATPLOTPP_BUILD_SHARED_LIBS=ON                \
    -DMATPLOTPP_BUILD_TESTS=OFF                     \
    -DCMAKE_BUILD_TYPE=Release            \
    -DCMAKE_INSTALL_PREFIX="$HOME/.local" \
    -DCMAKE_INTERPROCEDURAL_OPTIMIZATION=ON

cmake --build build/local
Embed with Automatic Download
FetchContent is a CMake command that can automatically download the Matplot++ repository. Check if you have Cmake 3.14+ installed:
cmake --version
Include FetchContent in your CMake build script:
include(FetchContent)
Declare the source for the contents:
FetchContent_Declare(matplotplusplus
        GIT_REPOSITORY https://github.com/alandefreitas/matplotplusplus
        GIT_TAG origin/master) # or whatever tag you want
Let CMake download the repository and include it as a subdirectory.
FetchContent_GetProperties(matplotplusplus)
if(NOT matplotplusplus_POPULATED)
    FetchContent_Populate(matplotplusplus)
    add_subdirectory(${matplotplusplus_SOURCE_DIR} ${matplotplusplus_BINARY_DIR} EXCLUDE_FROM_ALL)
endif()
When creating your executable, link the library to the targets you want:
add_executable(my_target main.cpp)
target_link_libraries(my_target PUBLIC matplot)
Then add this header to your source files:
#include <matplot/matplot.h>
However, in larger projects, it's always recommended to look for Matplot++ with find_package before including it as a subdirectory to avoid ODR errors.
Embed with CPM.cmake
CPM.cmake is a nice wrapper around the CMake FetchContent function.
Check if you have Cmake 3.14+ installed:
cmake --version
Install CPM.cmake and then use this command to add Matplot++ to your build script:
CPMAddPackage(
    NAME matplotplusplus
    GITHUB_REPOSITORY alandefreitas/matplotplusplus
    GIT_TAG origin/master # or whatever tag you want
)
# ...
target_link_libraries(my_target PUBLIC matplot)
Then add this header to your source files:
#include <matplot/matplot.h>
However, in larger projects, it's always recommended to look for Matplot++ with find_package before including it as a subdirectory to avoid ODR errors.
You can use:
option(CPM_USE_LOCAL_PACKAGES "Try `find_package` before downloading dependencies" ON)
in your build script to let CPM.cmake do that for you.
Find as External Package
If you have the library installed on your system, you can call find_package() from your CMake build script.
find_package(Matplot++ REQUIRED)
When creating your executable, link the library to the targets you want:
add_executable(my_target main.cpp)
target_link_libraries(my_target PUBLIC Matplot++::matplot)
Then add this header to your source files:
#include <matplot/matplot.h>
You can see a complete example in test/integration/CMakeLists.txt.
CMake should be able to locate the Matplot++Config.cmake script automatically if you installed the library under /usr/local/ (Linux / Mac OS). Unfortunately, there is no easy default directory for find_package on Windows.
!!! warning "Default directories"
By default, the library is likely to be in `/usr/local/` (Linux / Mac OS) or `C:/Program Files/` (Windows). The installer will try to find the directory where you usually keep your libraries but that's not always perfect.
!!! warning "Finding packages on Windows"
Unfortunately, CMake does not have a single default directory for packages on Windows like `/usr/local/lib`. If CMake cannot find Matplot++ on Windows or if you installed the library outside the default directory on Linux/Mac OS, there are a few [options](https://stackoverflow.com/questions/21314893/what-is-the-default-search-path-for-find-package-in-windows-using-cmake):

* **Environment Variables**: The most reliable way to set this default directory is through environment variables. You can create an environment variable `MATPLOTPP_DIR` and then add `$ENV{MATPLOTPP_DIR}` to the `HINTS` section of the `find_package` command. This tends to be more convenient than requiring the path on the command line every time. Starting with version 3.12, CMake now implicitly considers the `<PackageName>_Root` environment variable a HINT for every `find_package` call.
* **Package Registry**: CMake offers the [Package Registry](https://cmake.org/cmake/help/v3.5/manual/cmake-packages.7.html#package-registry) as an alternative mechanism for finding package locations. CMake maintains a list of package information in the Windows registry under `HKEY_CURRENT_USER\Software\Kitware\CMake\Packages\`.
* **Append CMAKE_MODULE_PATH**: You can append more directories to [`CMAKE_MODULE_PATH`](https://cmake.org/cmake/help/latest/variable/CMAKE_MODULE_PATH.html) with something like `list(APPEND CMAKE_MODULE_PATH "C:\\Program Files\\matplotplusplus 1.0.1")`. `CMAKE_MODULE_PATH` is a list of search paths for CMake modules to be loaded by the `include()` or `find_package()` commands.
* **Set the DIR variable directly**: Directly set the `Matplot++_DIR` variable with something like `set(Matplot++_DIR "C:\\Program Files\\matplotplusplus 1.0.1\\lib\\cmake\\Matplot++")`. This might be good enough for small local projects but it is hard-coding the directory in your build script. When your library gets out of your local environment, you need to choose one of the other options above (better) or make this variable an option and require the user to provide the directory on the command line every time (worse).
Supporting Both
It's often useful to let your build script download Matplot++ when find_package fails. If using CPM.cmake, you can set the CPM_USE_LOCAL_PACKAGES option to try to find_package(Matplot++) before download Matplot++.
If using FetchContent, you can use the following pattern:
find_package(Matplot++ QUIET)
if(NOT Matplot++_FOUND)
    # Put your FetchContent or CPM.cmake script here
endif()
Install
Binary Packages
Get the binary package from the release section. These binaries refer to the last release version of Matplot++.
If you need a more recent version of Matplot++, you can download the binary packages from the CI artifacts or build the library from the source files.
Build from Source
Dependencies
C++17
Make sure your C++ compiler supports C++17:
=== "Ubuntu + GCC"
g++ --version
=== "Mac Os + Clang"
clang --version
=== "Windows + MSVC"
!!! warning ""
    * Visit the [Visual Studio](https://visualstudio.microsoft.com) website
    * Download Git from [https://git-scm.com/download/win](https://git-scm.com/download/win) and install it
The output should be something like:
=== "Ubuntu + GCC"
g++-8 (Ubuntu 8.4.0-1ubuntu1~18.04) 8.4.0
=== "Mac Os + Clang"
Apple clang version 11.0.0 (clang-1100.0.33.8)
=== "Windows + MSVC"
!!! warning ""
    * Visit the [Visual Studio](https://visualstudio.microsoft.com) website
    * Download Git from [https://git-scm.com/download/win](https://git-scm.com/download/win) and install it
If you need to update your compiler:
=== "Ubuntu + GCC"
# install GCC-8
sudo apt update
sudo apt install gcc-8
sudo apt install g++-8
To update to any other version, like GCC-9 or GCC-10:
sudo apt install build-essential
sudo add-apt-repository ppa:ubuntu-toolchain-r/test
sudo apt-get update
sudo apt install g++-10
Once you installed a newer version of GCC, you can link it to update-alternatives. For instance, if you have GCC-7 and GCC-10, you can link them with:
sudo update-alternatives --install /usr/bin/gcc gcc /usr/bin/gcc-7 7
sudo update-alternatives --install /usr/bin/g++ g++ /usr/bin/g++-7 7
sudo update-alternatives --install /usr/bin/gcc gcc /usr/bin/gcc-10 10
sudo update-alternatives --install /usr/bin/g++ g++ /usr/bin/g++-10 10
You can now use update-alternatives to set your default gcc and g++ to a more recent version:
update-alternatives --config g++
update-alternatives --config gcc
=== "Mac Os + Clang"
# download clang
curl --output clang.tar.xz -L https://github.com/llvm/llvm-project/releases/download/llvmorg-11.0.0/clang+llvm-11.0.0-x86_64-apple-darwin.tar.xz
mkdir clang
tar -xvJf clang.tar.xz -C clang

# copy files to /usr/local
cd clang/clang+llvm-11.0.0-x86_64-apple-darwin
sudo cp -R * /usr/local/

# update default compiler
export CXX=/usr/local/bin/clang++
=== "Windows + MSVC"
!!! warning ""
    * Visit the [Visual Studio](https://visualstudio.microsoft.com) website
    * Download Git from [https://git-scm.com/download/win](https://git-scm.com/download/win) and install it
CMake 3.14+
Also check your CMake version is at least 3.14+:
=== "Ubuntu + GCC"
cmake --version
=== "Mac Os + Clang"
cmake --version
=== "Windows + MSVC"
cmake --version
If CMake is not installed or its version is older than CMake 3.14, update it with
=== "Ubuntu + GCC"
sudo apt upgrade cmake
!!! warning ""
    Alternatively, download the most recent version from [cmake.org](https://cmake.org/).
=== "Mac Os + Clang"
brew upgrade cmake
!!! warning "Homebrew"
    If this command fails because you don't have [Homebrew](https://brew.sh) on your computer, you can install it with
/bin/bash -c "$(curl -fsSL https://raw.githubusercontent.com/Homebrew/install/master/install.sh)"
    or you can follow the instructions in [https://brew.sh](https://brew.sh).


!!! warning ""
    Alternatively, download the most recent version from [cmake.org](https://cmake.org/).
=== "Windows + MSVC"
!!! warning ""
    Download the most recent version from [cmake.org](https://cmake.org/).
Gnuplot 5.2.6+
Install Gnuplot 5.2.6+ (Required at runtime)
=== "Ubuntu + GCC"
sudo apt update
sudo apt install gnuplot
!!! note ""
    Or download the latest version from [www.gnuplot.info](http://www.gnuplot.info). If you're using an installer, make sure you mark the option "Add application directory to your PATH environment variable".
=== "Mac Os + Clang"
brew install gnuplot
!!! note ""
    Or download the latest version from [www.gnuplot.info](http://www.gnuplot.info). If you're using an installer, make sure you mark the option "Add application directory to your PATH environment variable".
=== "Windows + MSVC"
!!! warning ""
    Download Gnuplot from [www.gnuplot.info](http://www.gnuplot.info) and install it.

    If you're using the Gnuplot installer, make sure you mark the option "Add application directory to your PATH environment variable"

!!! warning "Windows Gnuplot Terminals"

    If the Matplot++ examples don't display without console errors and gnuplot running, try to re-install Gnuplot with the wxt terminal.
Optional Dependencies
The build script will also look for these optional dependencies for manipulating images:
- JPEG
- TIFF
- ZLIB
- PNG
- LAPACK
- BLAS
- FFTW
- OpenCV
Embedded Dependencies
There are two dependencies in source/3rd_party. These dependencies are bundled, so you don't have to worry about them:
- olvb/nodesoup
- dtschump/CImg
You can define MATPLOTPP_WITH_SYSTEM_NODESOUP=ON or MATPLOTPP_WITH_SYSTEM_CIMG=ON in the cmake command line to use a system-provided version of these dependencies.
OpenGL Dependencies
There's an extra target matplot_opengl with the experimental OpenGL backend. You need to define MATPLOTPP_BUILD_EXPERIMENTAL_OPENGL_BACKEND=ON in the CMake command line to build that target. In that case, the build script will also look for these extra dependencies:
- OpenGL
- GLAD
- GLFW3
If these dependencies are not found, the build script will download them. In any case, you can install these dependencies with:
=== "Ubuntu + GCC"
sudo apt-get install libglfw3-dev
=== "Mac Os + Clang"
!!! note ""
    Download GLFW3 from https://www.glfw.org
=== "Windows + MSVC"
!!! note ""
    Download GLFW3 from https://www.glfw.org
You can also see all dependencies in source/3rd_party/CMakeLists.txt.
Build and Install
Building Examples
This will build the examples in the build/examples directory:
=== "Ubuntu + GCC"
mkdir build
cd build
cmake .. -DCMAKE_BUILD_TYPE=Release -DCMAKE_CXX_FLAGS="-O2"
sudo cmake --build . --parallel 2 --config Release
=== "Mac Os + Clang"
mkdir build
cd build
cmake .. -DCMAKE_BUILD_TYPE=Release -DCMAKE_CXX_FLAGS="-O2"
cmake --build . --parallel 2 --config Release
=== "Windows + MSVC"
mkdir build
cd build
cmake .. -DCMAKE_BUILD_TYPE=Release -DCMAKE_CXX_FLAGS="/O2"
cmake --build . --parallel 2 --config Release
!!! hint "Parallel Build"
Replace --parallel 2 with --parallel <number of cores in your machine>
!!! note "Setting C++ Compiler"
If your C++ compiler that supports C++17 is not your default compiler, make sure you provide CMake with the compiler location with the DCMAKE_C_COMPILER and DCMAKE_CXX_COMPILER options. For instance:
cmake .. -DCMAKE_BUILD_TYPE=Release -DCMAKE_CXX_FLAGS="-O2" -DCMAKE_C_COMPILER=/usr/bin/gcc-8 -DCMAKE_CXX_COMPILER=/usr/bin/g++-8
Installing
You can 1) use -DMATPLOTPP_BUILD_EXAMPLES=OFF -DMATPLOTPP_BUILD_TESTS=OFF to bypass the examples and tests, and then 2) cmake --install . to install Matplot++ on your system:
=== "Ubuntu + GCC"
mkdir build
cd build
cmake .. -DCMAKE_BUILD_TYPE=Release -DCMAKE_CXX_FLAGS="-O2" -DMATPLOTPP_BUILD_EXAMPLES=OFF -DMATPLOTPP_BUILD_TESTS=OFF
sudo cmake --build . --parallel 2 --config Release
sudo cmake --install .
=== "Mac Os + Clang"
mkdir build
cd build
cmake .. -DCMAKE_BUILD_TYPE=Release -DCMAKE_CXX_FLAGS="-O2" -DMATPLOTPP_BUILD_EXAMPLES=OFF -DMATPLOTPP_BUILD_TESTS=OFF
cmake --build . --parallel 2 --config Release
cmake --install .
=== "Windows + MSVC"
mkdir build
cd build
cmake .. -DCMAKE_BUILD_TYPE=Release -DCMAKE_CXX_FLAGS="/O2" -DMATPLOTPP_BUILD_EXAMPLES=OFF -DMATPLOTPP_BUILD_TESTS=OFF
cmake --build . --parallel 2 --config Release
cmake --install .
!!! hint "Parallel Build"
Replace --parallel 2 with --parallel <number of cores in your machine>
Create Packages
You can also create the binary packages to install Matplot++ on other systems:
=== "Ubuntu + GCC"
sudo cpack .
=== "Mac Os + Clang"
cpack .
=== "Windows + MSVC"
cpack .
Plot Types
Line Plots
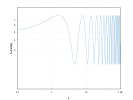
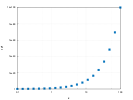
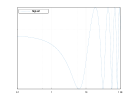
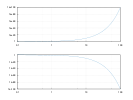
Line Plot | Line Plot 3D | Stairs | Error Bars | Area | Loglog Plot | Semilogx Plot | Semilogy Plot | Function Plot | Function Plot 3D | Implicit function
Line Plot
!!! tip Use these examples to understand how to quickly use the library for data visualization. If you are interested in understanding how the library works, you can later read the details in the complete article.
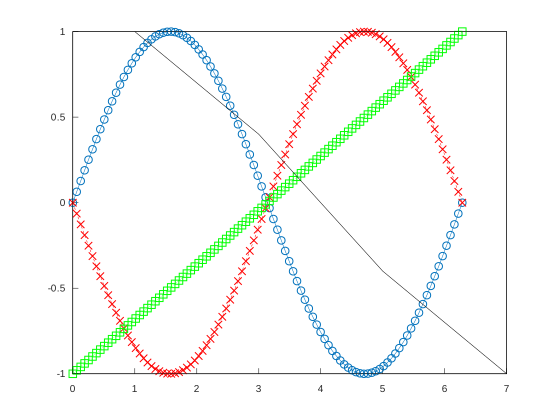
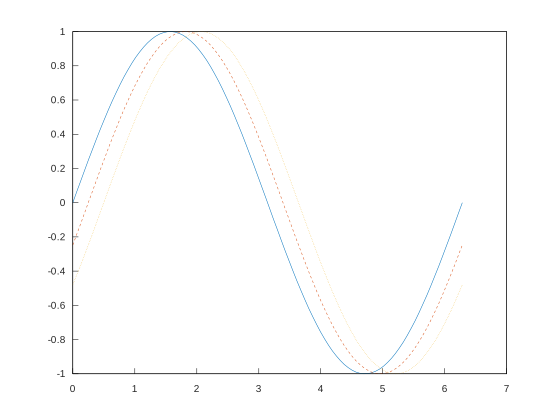
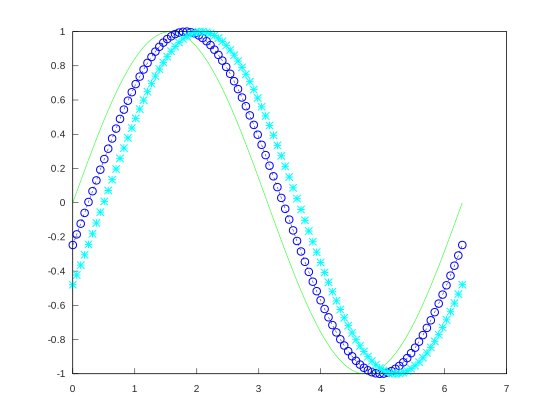
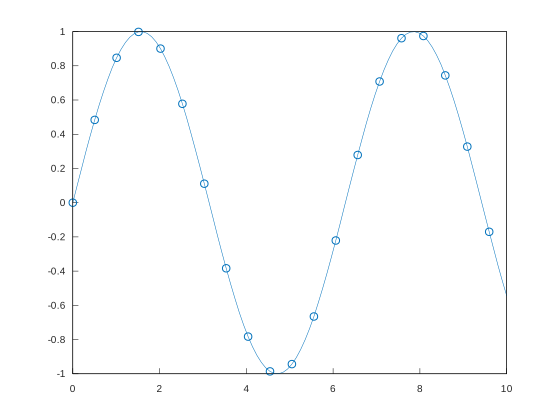
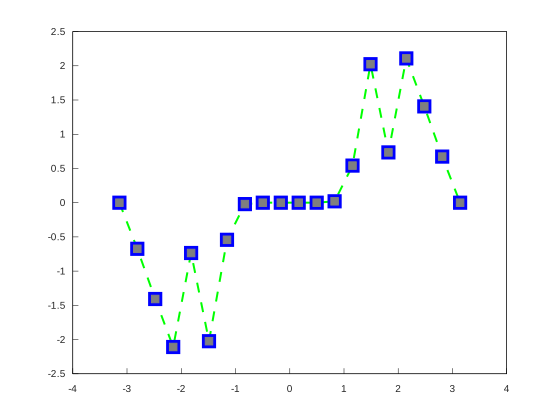
plot(x,y);
Where x and y are are any value ranges.
READ THE DOCUMENTATION TO SEE THESE EXAMPLES WITH THE IMAGES
=== "Plot"
=== "C++"
--8<-- "examples/line_plot/plot/plot_1.cpp"
More examples
!!! tip
Setters return a reference to *this to allow method chaining:
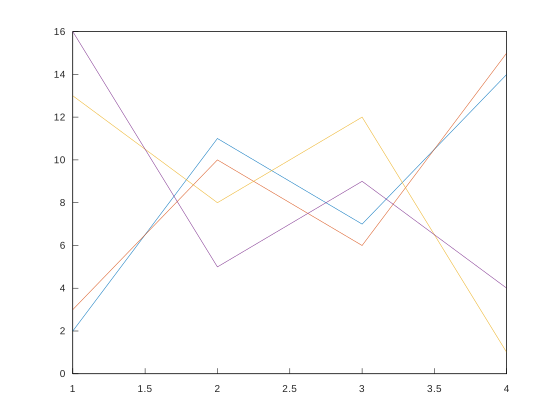
plot(x,y)->line_width(2).color("red");
!!! tip These examples use free-standing functions to create plots. You can also use a object-oriented style for plots. We discuss these coding styles in the Section Coding Styles.
More Examples:
===! "Plot"
=== "C++"
--8<-- "examples/line_plot/plot/plot_2.cpp"
===! "Plot"
=== "C++"
--8<-- "examples/line_plot/plot/plot_3.cpp"
===! "Plot"
=== "C++"
--8<-- "examples/line_plot/plot/plot_4.cpp"
===! "Plot"
=== "C++"
--8<-- "examples/line_plot/plot/plot_5.cpp"
===! "Plot"
=== "C++"
--8<-- "examples/line_plot/plot/plot_6.cpp"
===! "Plot"
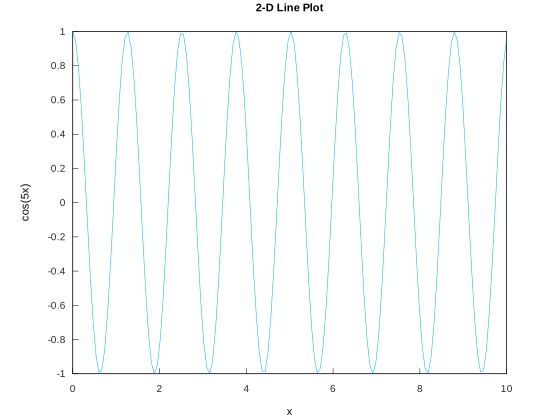
=== "C++"
--8<-- "examples/line_plot/plot/plot_7.cpp"
===! "Plot"
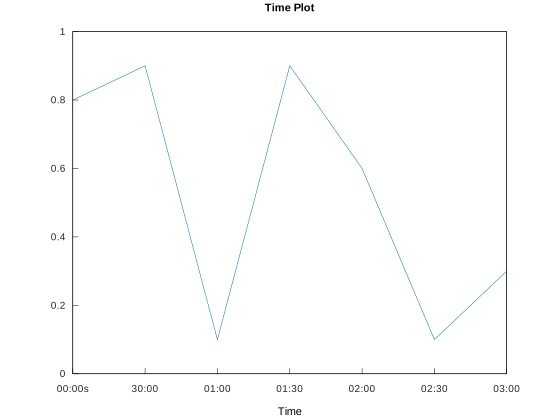
=== "C++"
--8<-- "examples/line_plot/plot/plot_8.cpp"
===! "Plot"
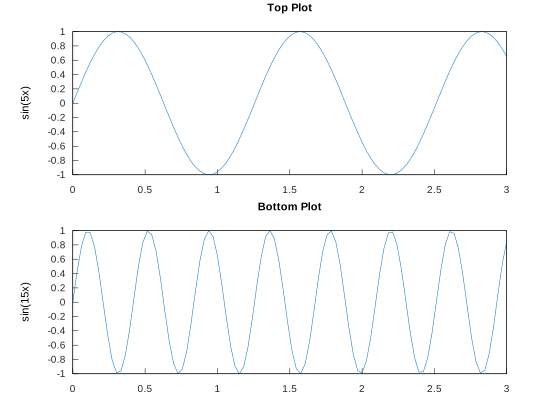
=== "C++"
--8<-- "examples/line_plot/plot/plot_9.cpp"
===! "Plot"
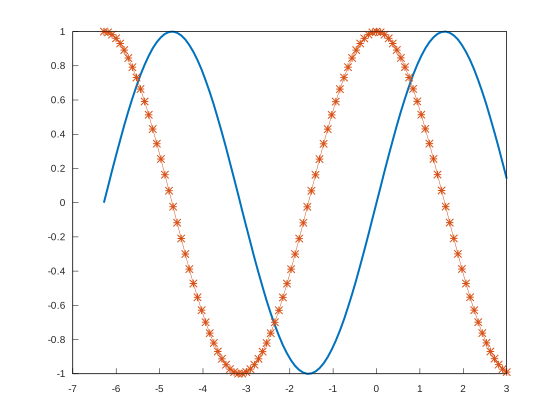
=== "C++"
--8<-- "examples/line_plot/plot/plot_10.cpp"
===! "Plot"
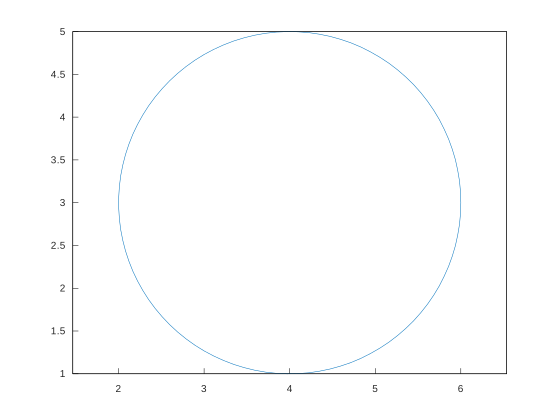
=== "C++"
--8<-- "examples/line_plot/plot/plot_11.cpp"
===! "Plot"
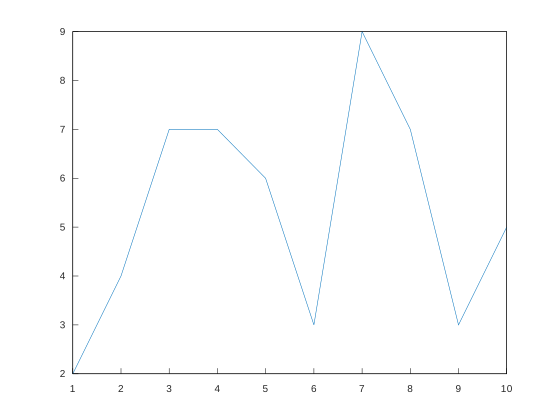
=== "C++"
--8<-- "examples/line_plot/plot/plot_12.cpp"
Line Plot 3D
plot3(x,y);
=== "Plot"
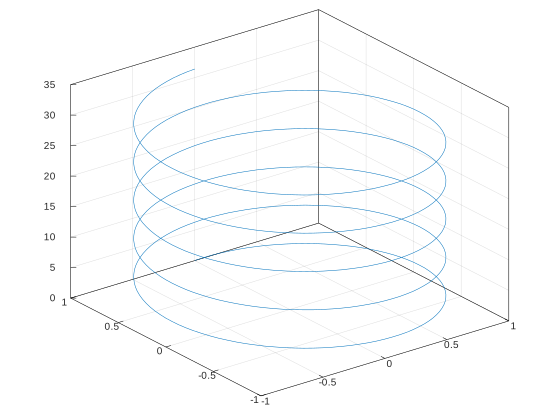
=== "C++"
--8<-- "examples/line_plot/plot3/plot3_1.cpp"
!!! tip With method chaining:
plot3(x,y)->line_width(2).color("red");
More examples
More Examples:
===! "Plot"
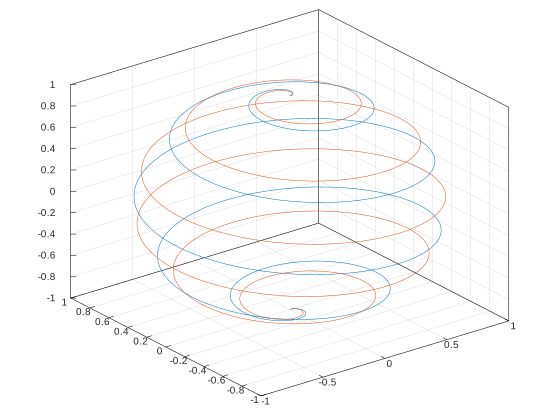
=== "C++"
--8<-- "examples/line_plot/plot3/plot3_2.cpp"
===! "Plot"
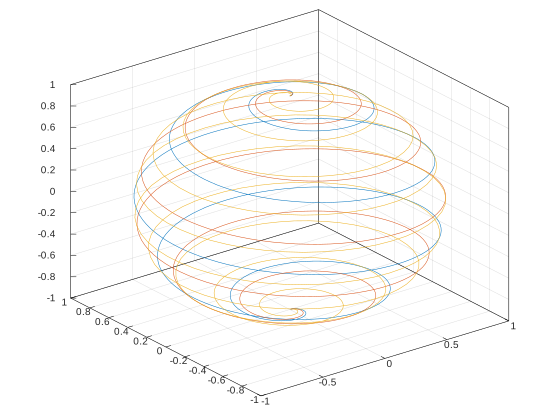
=== "C++"
--8<-- "examples/line_plot/plot3/plot3_3.cpp"
===! "Plot"

=== "C++"
--8<-- "examples/line_plot/plot3/plot3_4.cpp"
===! "Plot"
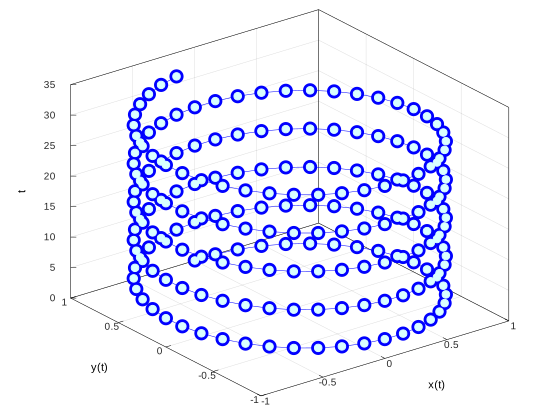
=== "C++"
--8<-- "examples/line_plot/plot3/plot3_5.cpp"
===! "Plot"
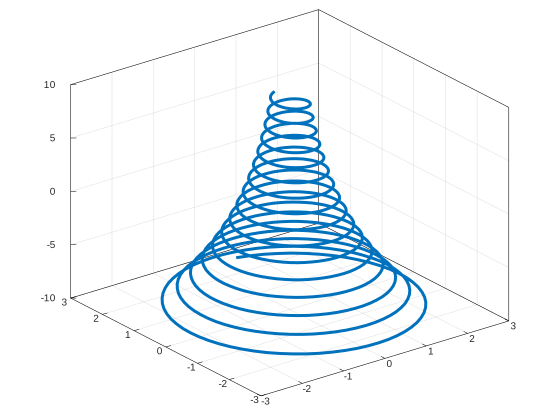
=== "C++"
--8<-- "examples/line_plot/plot3/plot3_7.cpp"
===! "Plot"
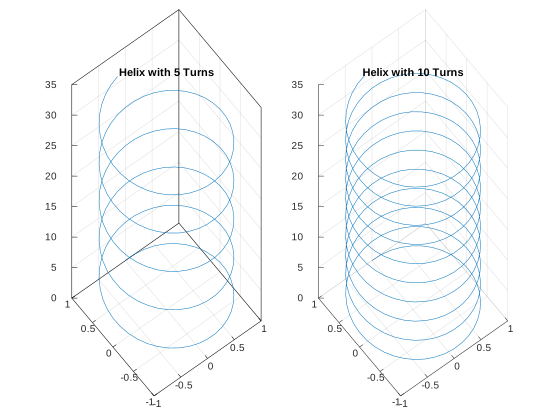
=== "C++"
--8<-- "examples/line_plot/plot3/plot3_8.cpp"
===! "Plot"
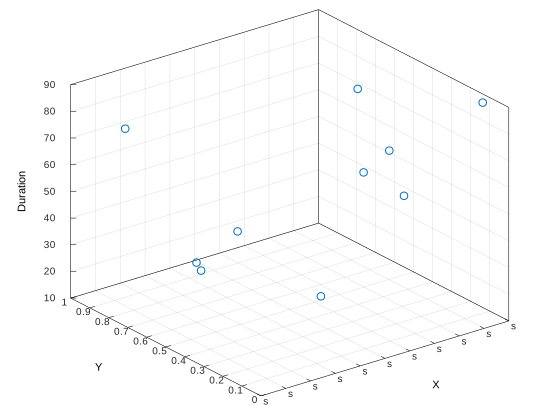
=== "C++"
--8<-- "examples/line_plot/plot3/plot3_9.cpp"
===! "Plot"
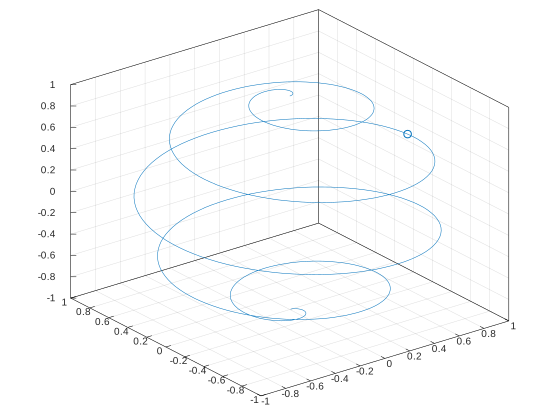
=== "C++"
--8<-- "examples/line_plot/plot3/plot3_10.cpp"
Stairs
more like this