agentlytics
Comprehensive analytics dashboard for AI coding agents — Cursor, Windsurf, Claude Code, VS Code Copilot, Zed, Antigravi…
JavaScript★ 555
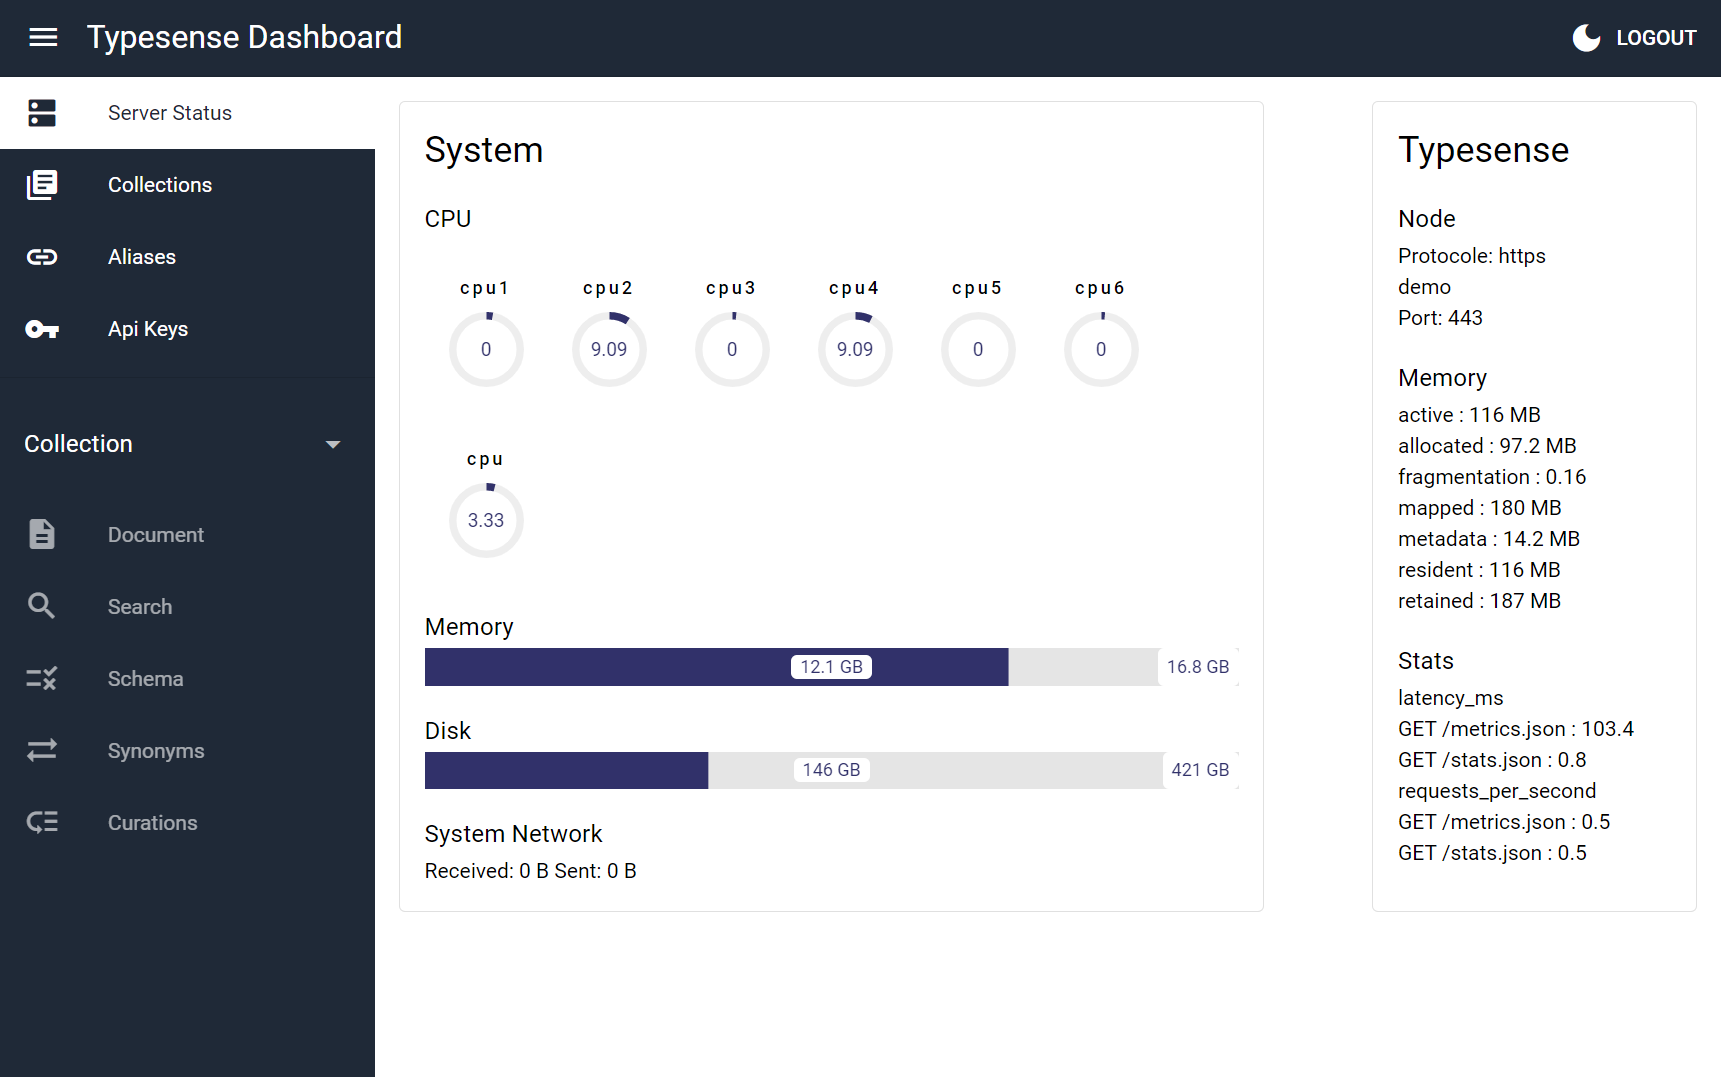
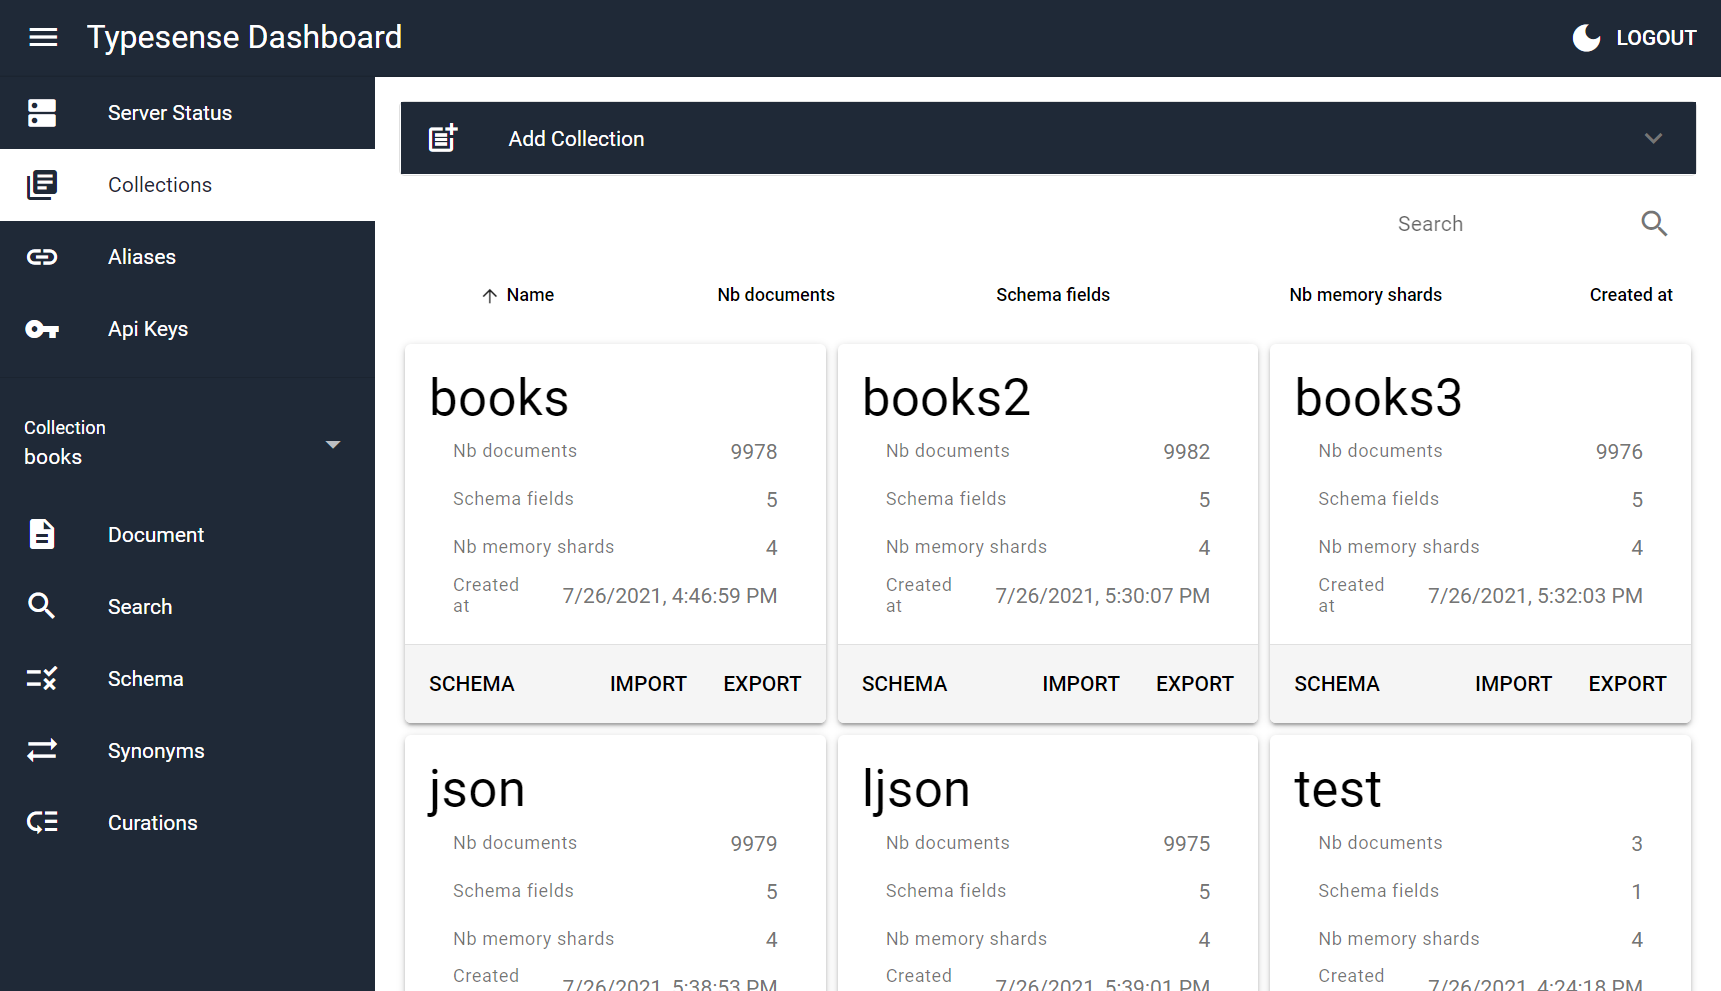
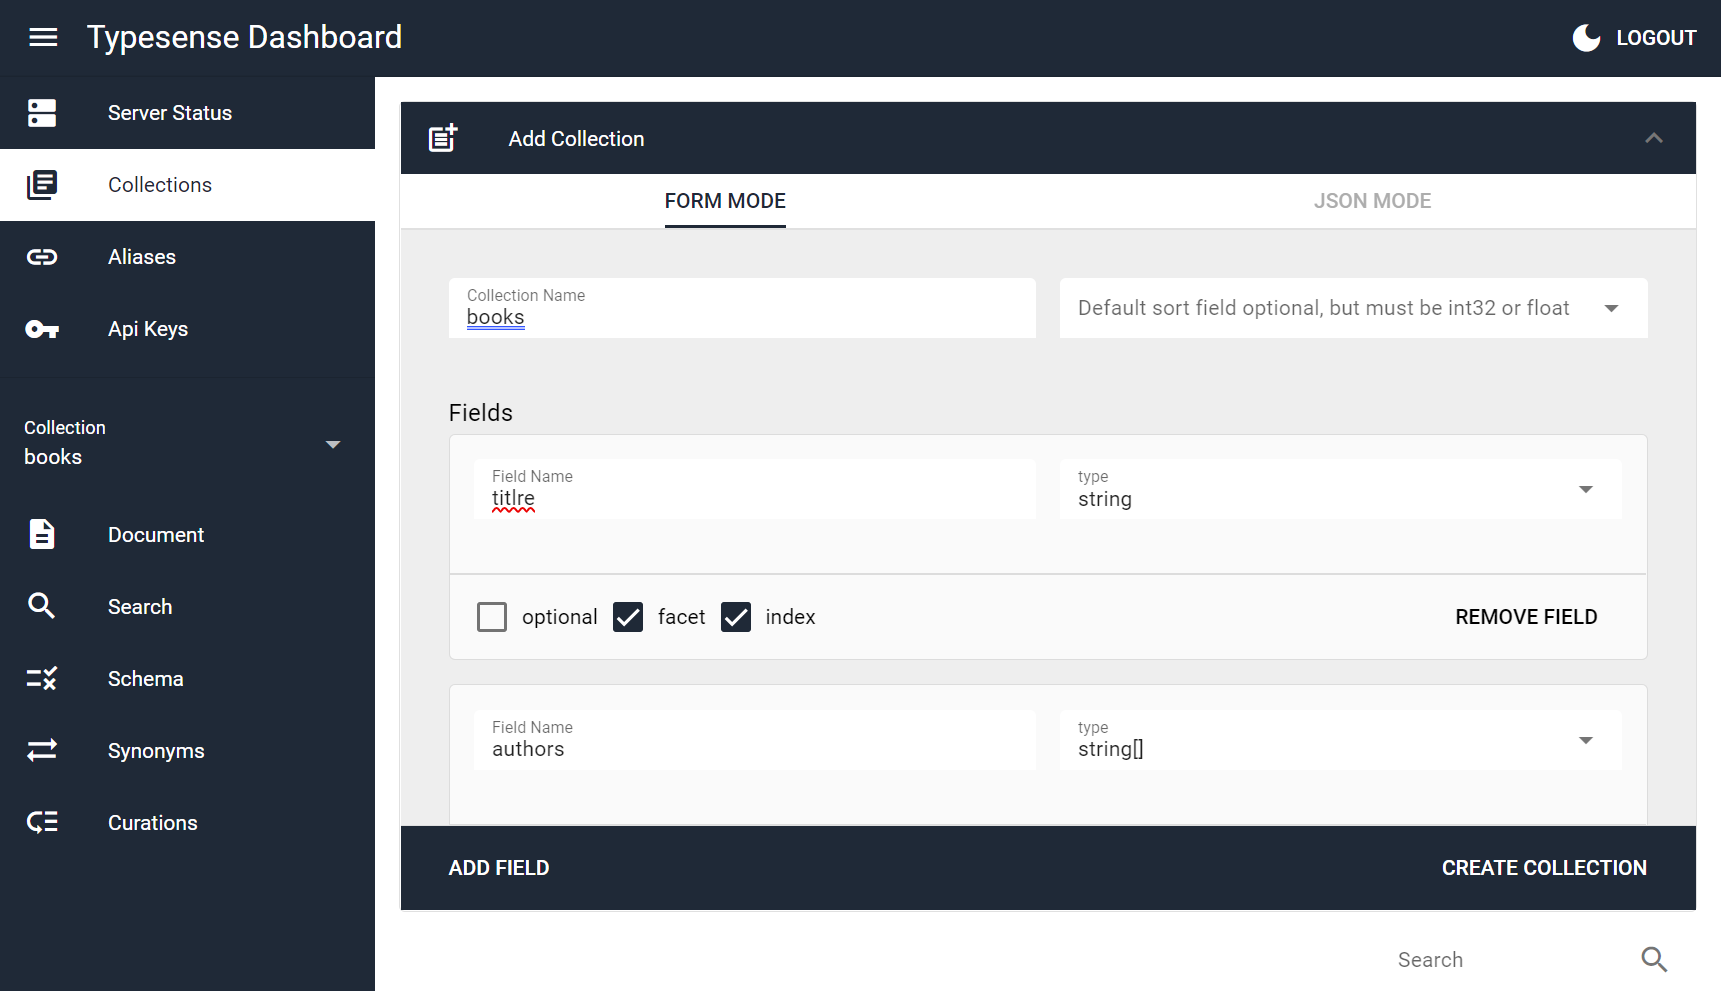
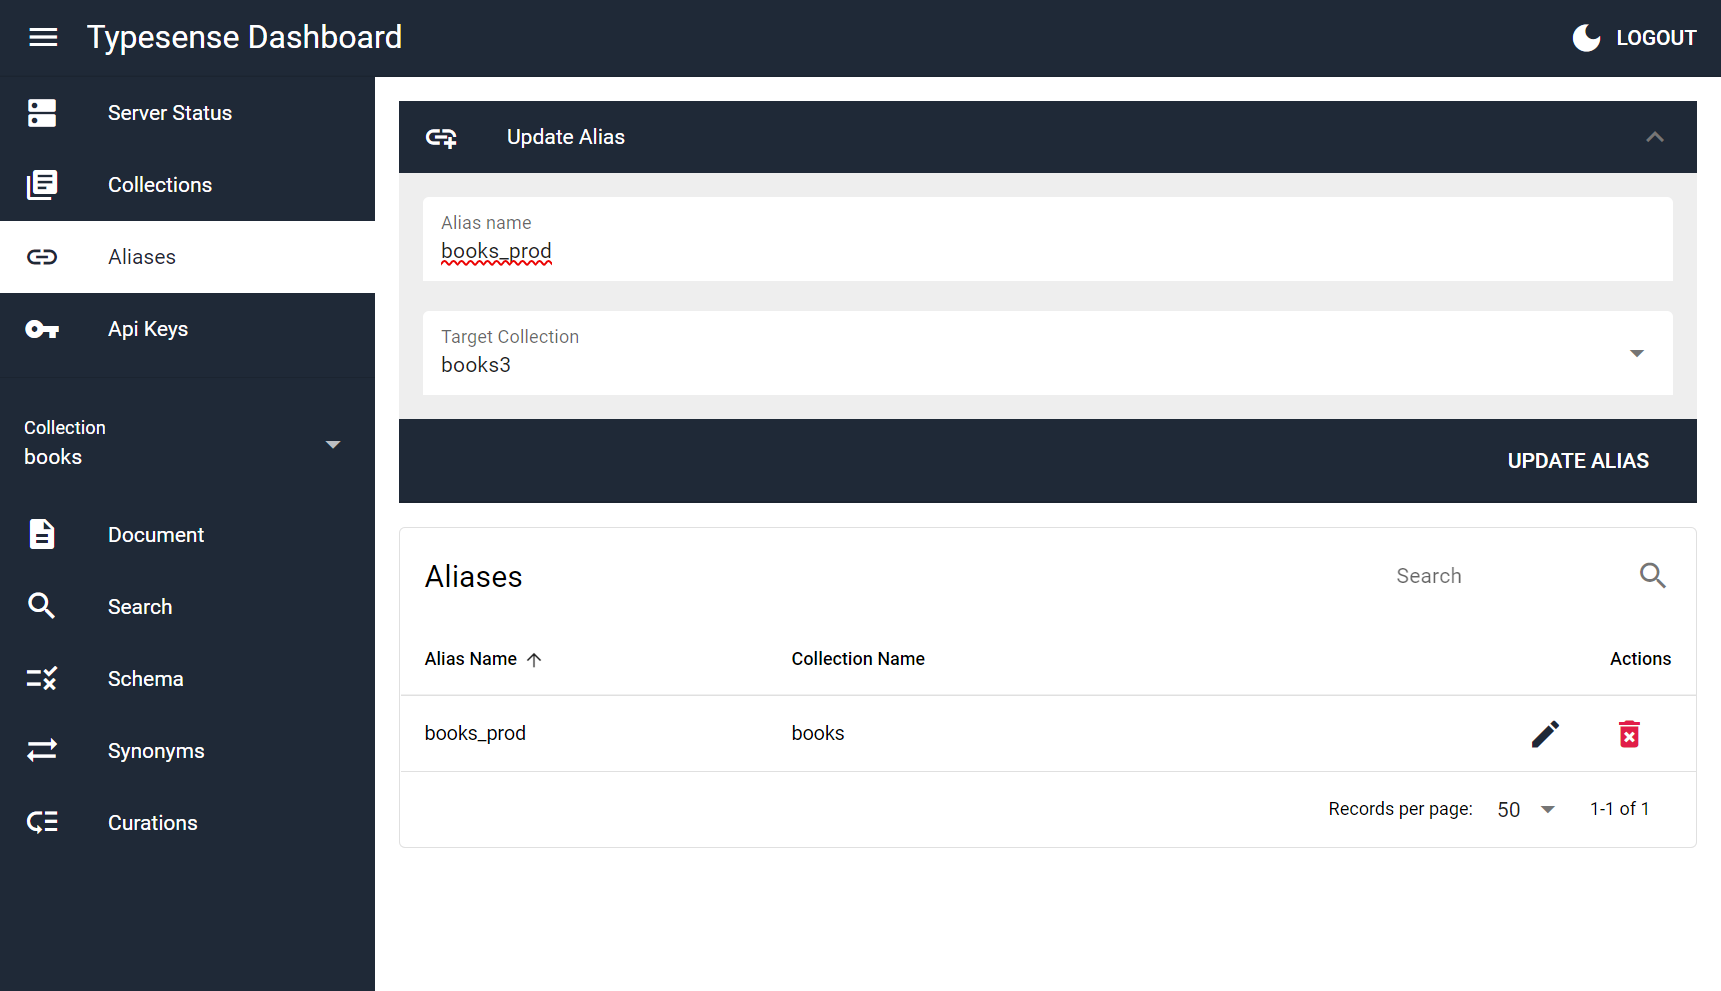
A Typesense Dashboard to manage and browse collections.
 bfritscher
git clone https://github.com/bfritscher/typesense-dashboard.gitbfritscher/typesense-dashboardA Typesense Dashboard to manage and browse collections.
A side project to test the Typesense API and Quasar with electron.
As a web application, only typesense server started with --enable-cors will work.
Use https://bfritscher.github.io/typesense-dashboard/ or build and install on your own server
When using in your browser from an https address your server must also be behind SSL. Or you will get a MixedContent Network Error. (You might allow mix content in your browser, but this is not recommended).
self-host this dashboard with docker* (web version has some limitations import/export size of files)
use environment variable PUBLIC_PATH if you need something else than /
Example usage:
$ docker build -t typesense-dashboard .
$ docker run -d -p 80:80 typesense-dashboard
caddy is used for serving the actual files.
One could also copy /srv from the final Docker Image into another:
FROM alpine
COPY --from=typesense-dashboard /srv /typesense-dashboard
To build and serve from a subfolder /example (must start with /)
docker build --build-arg=PUBLIC_PATH=/example -t typesense-dashboard .
You can also use the pre-built docker image for example like this:
docker run -d -p 80:80 ghcr.io/bfritscher/typesense-dashboard:latest
/api)When running npm run dev, you can optionally proxy /api to a remote Typesense server to avoid CORS issues during local development.
Set DEV_API_PROXY_TARGET to the remote origin (protocol + host + optional port). The dev server will forward /api/* to the target and strip the /api prefix.
PowerShell example:
$env:DEV_API_PROXY_TARGET = "https://my-typesense.example.com"; npm run dev
Multiple settings are available to configure the dashboard behaviour: autologin, UI options, bookmarks (via history) and cluster tagging.
The application looks for the configuration in /config.json on initial page load. There are two ways to provide this file when running in Docker:
config.json file to /srv/config.json in the containerTYPESENSE_DASHBOARD_CONFIG containing the configuration JSON file in base64 encoded format (the container will generate config.json at startup)docker run -d -p 80:80 -v /path/to/config.json:/srv/config.json typesense-dashboard
docker run -d -p 80:80 -e TYPESENSE_DASHBOARD_CONFIG=$(base64 -w 0 /path/to/config.json) typesense-dashboard
Sample config.json (same data as saved in localStorage of the browser). A sample configuration file is available at config.json.sample in the project root.
SAMEFor the web version, you can set node.host to "SAME" to connect to a Typesense node on the same hostname as the dashboard is being served from.
When host is "SAME", the dashboard resolves:
host from window.location.hostnameprotocol from window.location.protocol (http / https)port from window.location.port (or 80/443 if not present)This is useful when you reverse-proxy the dashboard and Typesense under the same domain.
Example:
{
  "node": {
    "host": "SAME",
    "path": "/api"
  }
}
{
  "apiKey": "xyz",
  "node": {
    "host": "somehost",
    "port": "443",
    "protocol": "https",
    "path": "",
    "tls": true
  },
  "ui": {
    "hideProjectInfo": false
  },
  "history": [
    {
      "apiKey": "abc",
      "node": {
        "host": "anotherhost",
        "port": "80",
        "protocol": "http",
        "path": "",
        "tls": false
      }
    },
    {
      "apiKey": "def",
      "node": {
        "host": "yetanotherhost",
        "port": "8080",
        "protocol": "http",
        "path": "",
        "tls": true
      },
      "clusterTag": "dev-cluster"
    }
  ]
}
The history is used to populate the client history to act as bookmarks.
The ui section allows you to customize the dashboard interface:
hideProjectInfo: Set to true to hide the project information section (version, GitHub link, and issue tracker) from the navigation menu. Default is false.The Cluster Status page lets you see multiple Typesense nodes side-by-side and poll their status in parallel. Each node card shows:
How it works:
clusterTag field embedded in each login history entry.Ways to define clusters:
config.json: pre-populate history entries with an optional clusterTag to group them. If a history entry omits clusterTag, it is not part of any cluster. The Cluster Status page is shown only when the currently connected node has a clusterTag.With the desktop application everything except instant search will work without cors. To export or import large json or jsonl files, desktop version is required, because the browser version times out.
Download from the release page or build your own.
App cannot be started by clicking on it, on Nautilus*
Make it executable and then you can run it from command line.
./'Typesense-Dashboard'
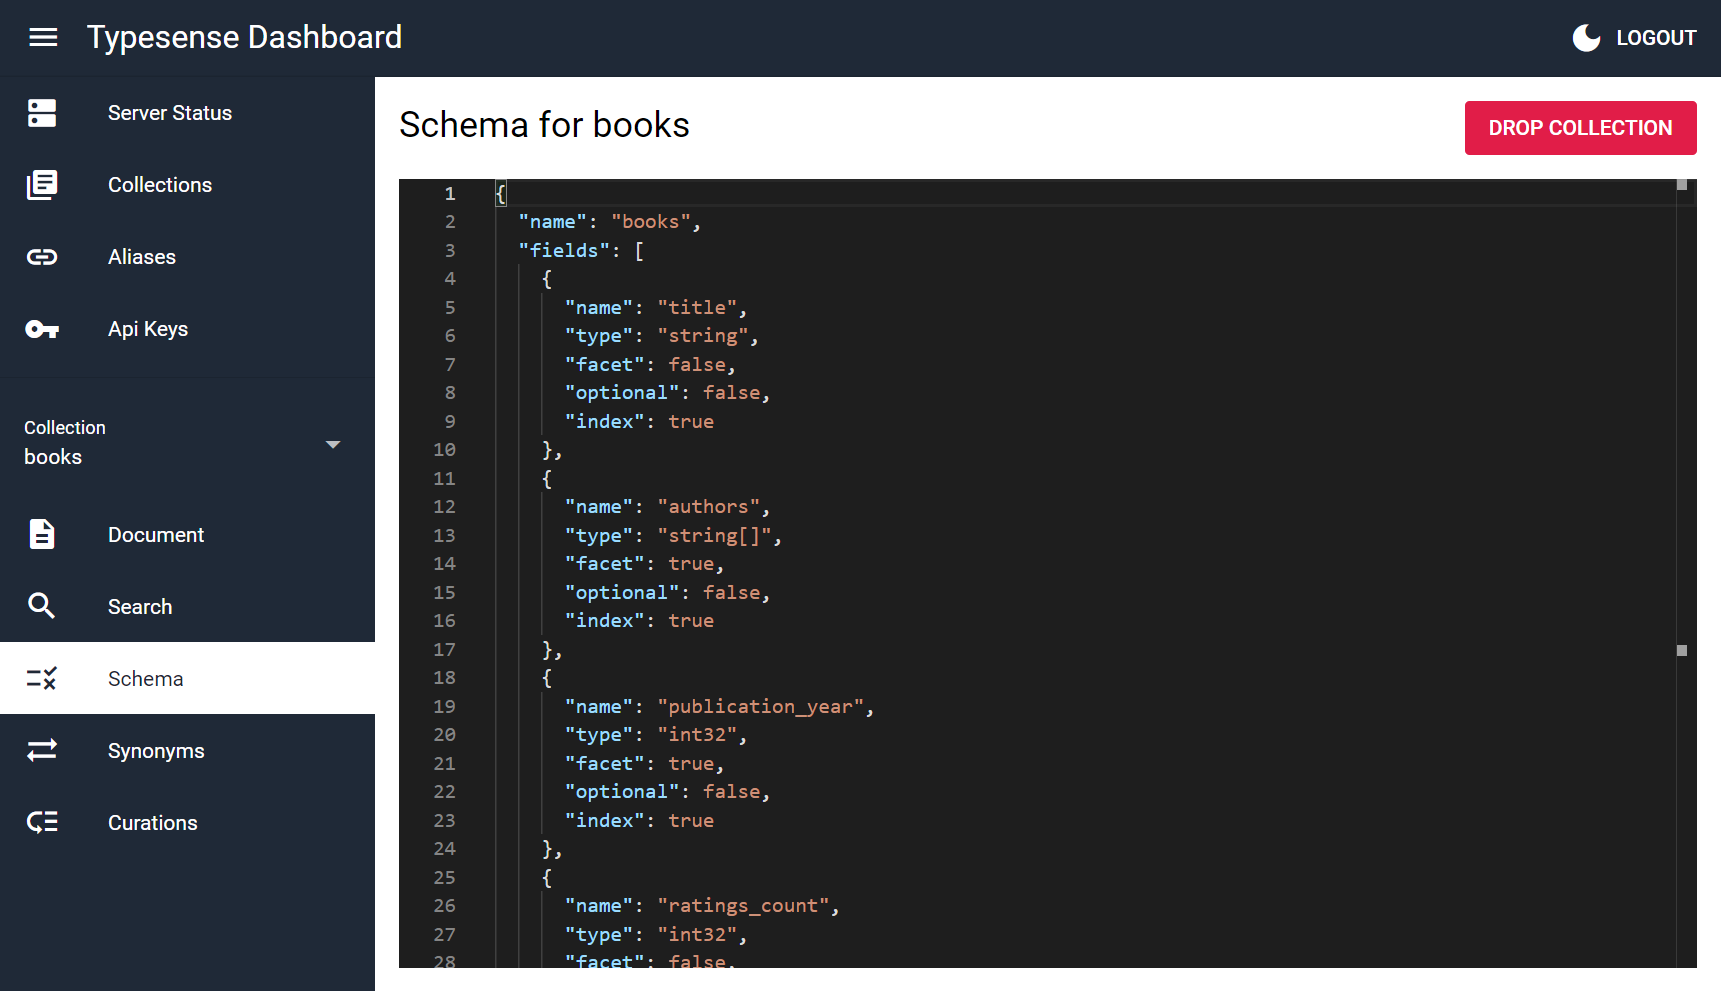
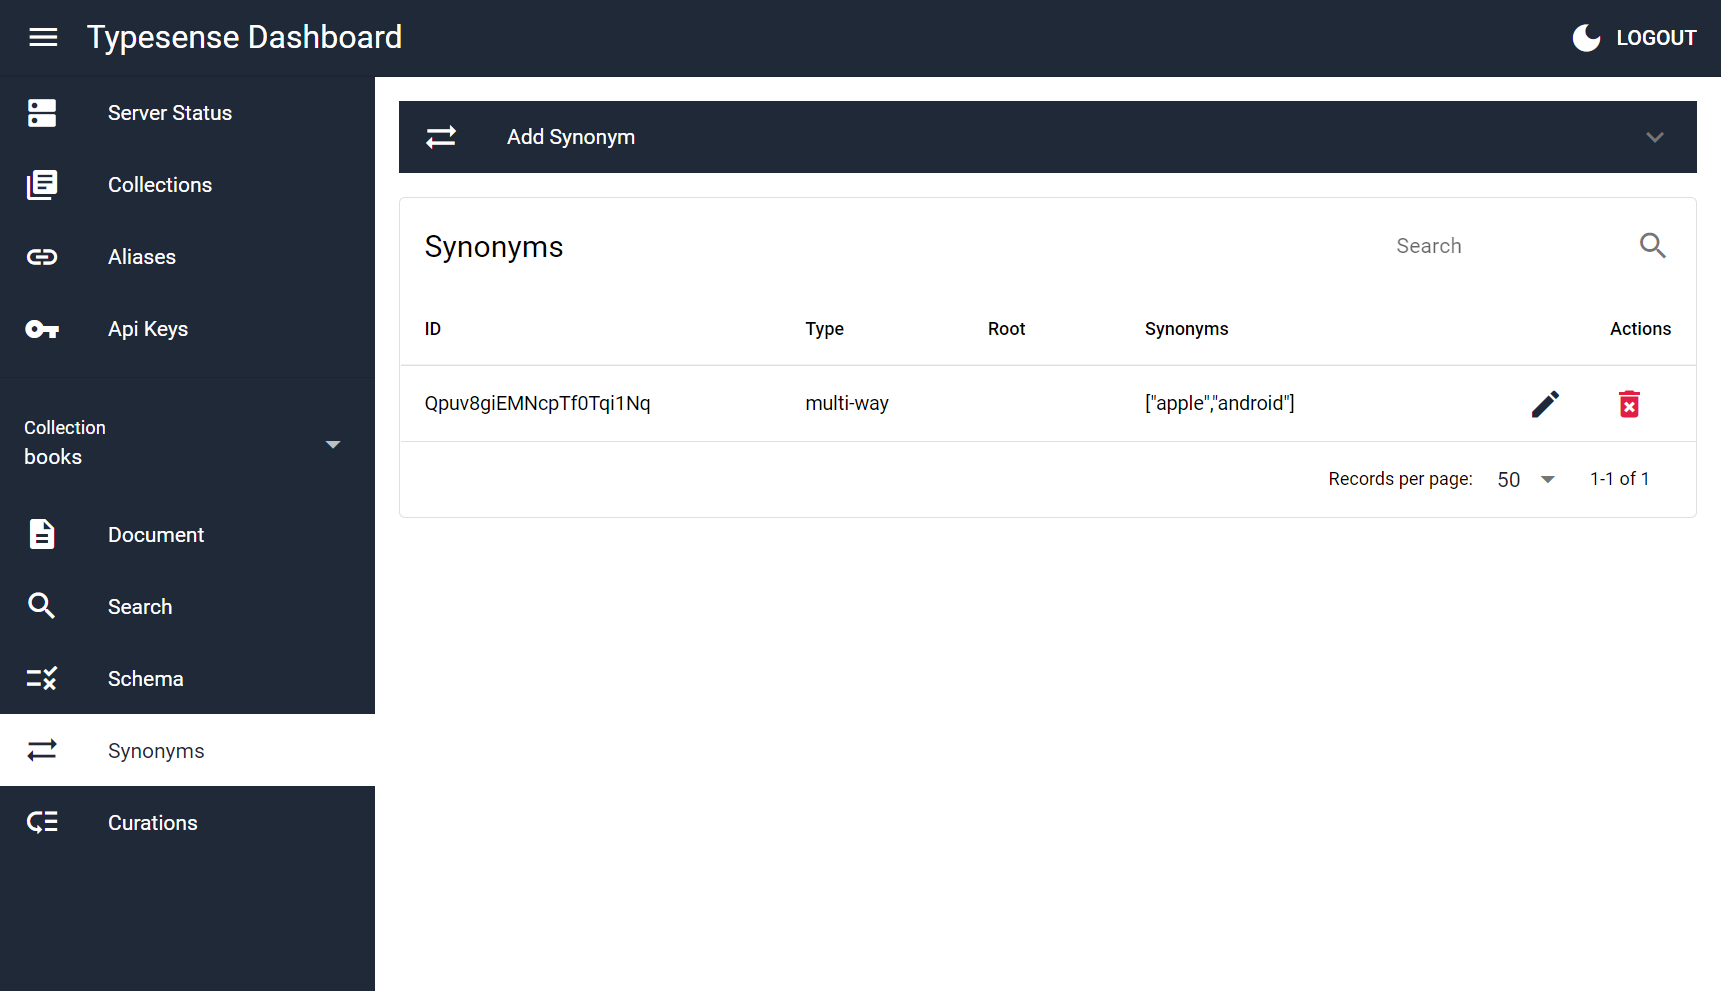
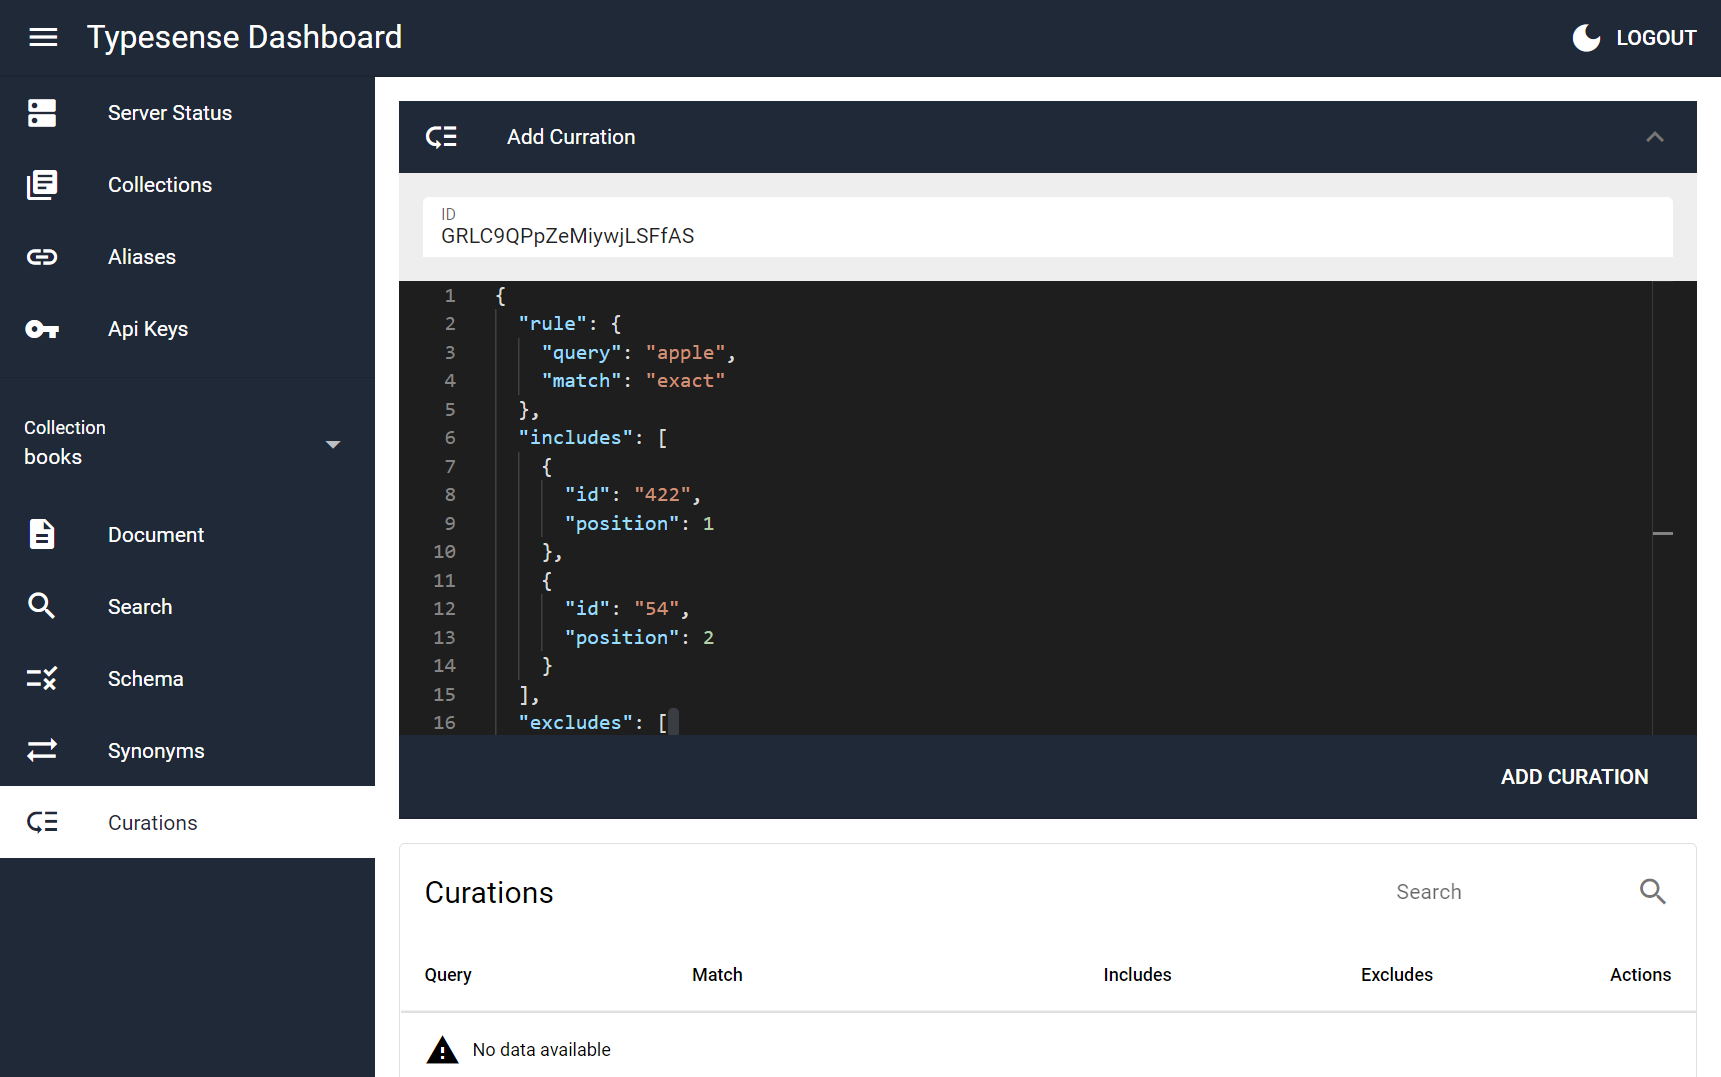
yarn
quasar dev
quasar dev -m electron --devtools
yarn lint
# or
npm run lint
yarn format
# or
npm run format
quasar build
quasar build --mode electron --target all
more like this
Comprehensive analytics dashboard for AI coding agents — Cursor, Windsurf, Claude Code, VS Code Copilot, Zed, Antigravi…
Open-source, offline-first face recognition attendance platform that runs on any webcam.
an efficient and user friendly OTA server equipped with a powerful WEB UI, designed to effortlessly manage both your ES…
search projects, people, and tags