ForwardWidgets
Widgets for Douban and Trakt watchlists plus personalized recommendations, live TV streaming including PlutoTV, Yatu ra…
JavaScript★ 247
A small library for creating pretty heatmaps of daily data.
 e-hulten
git clone https://github.com/e-hulten/july.gite-hulten/july
A small library for creating pretty heatmaps of daily data.
July does not rely only pandas (though it accepts it). Only numpy arrays and native Python data structures are used internally.datetime.datetime, datetime.date, str, pd.DatetimeIndex$ pip install july
import numpy as np
import matplotlib.pyplot as plt
import july
from july.utils import date_range

dates = date_range("2020-01-01", "2020-12-31")
data = np.random.randint(0, 14, len(dates))
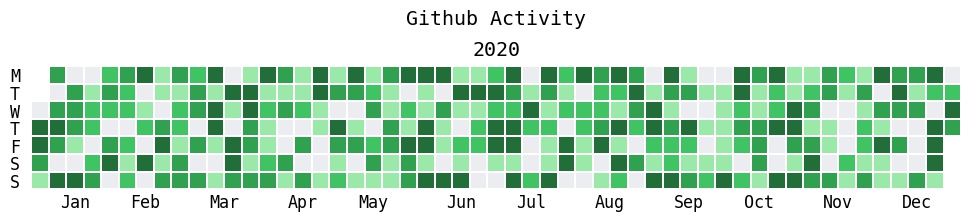
# GitHub Activity like plot (for someone with consistently random work patterns).
july.heatmap(dates, data, title='Github Activity', cmap="github")
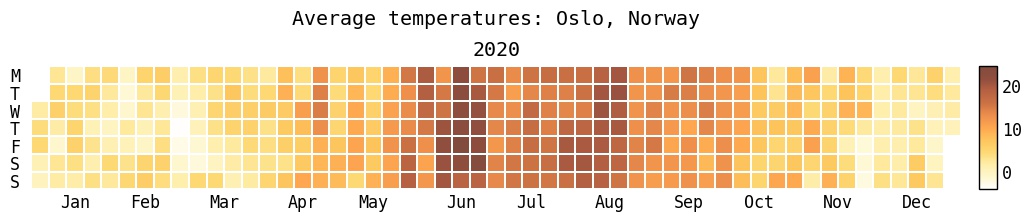
# Here, 'osl_df' is a pandas df.
july.heatmap(osl_df.date, osl_df.temp, cmap="golden", colorbar=True, title="Average temperatures: Oslo , Norway")
# More exhaustive example using useless, but pretty colours.
july.heatmap(dates=dates,
             data=data,
             cmap='Pastel1',
             month_grid=True,
             horizontal=True,
             value_label=False,
             date_label=False,
             weekday_label=True,
             month_label=True,
             year_label=True,
             colorbar=False,
             fontfamily="monospace",
             fontsize=12,
             title=None,
             titlesize='large',
             dpi=100)

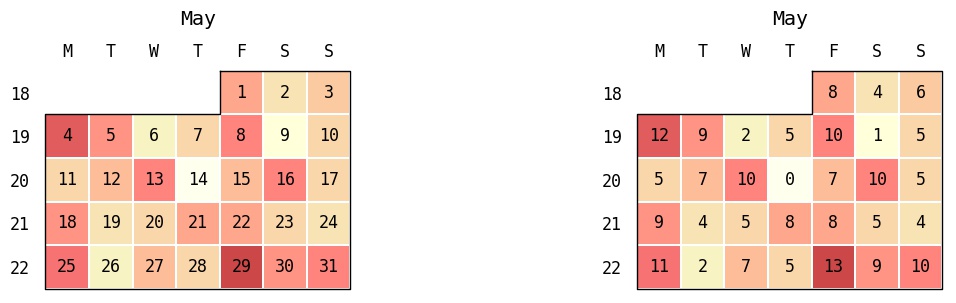
# Month plot with dates.
july.month_plot(dates, data, month=5, date_label=True, ax=axes[0])
# Month plot with values.
july.month_plot(dates, data, month=5, value_label=True, ax=axes[1])
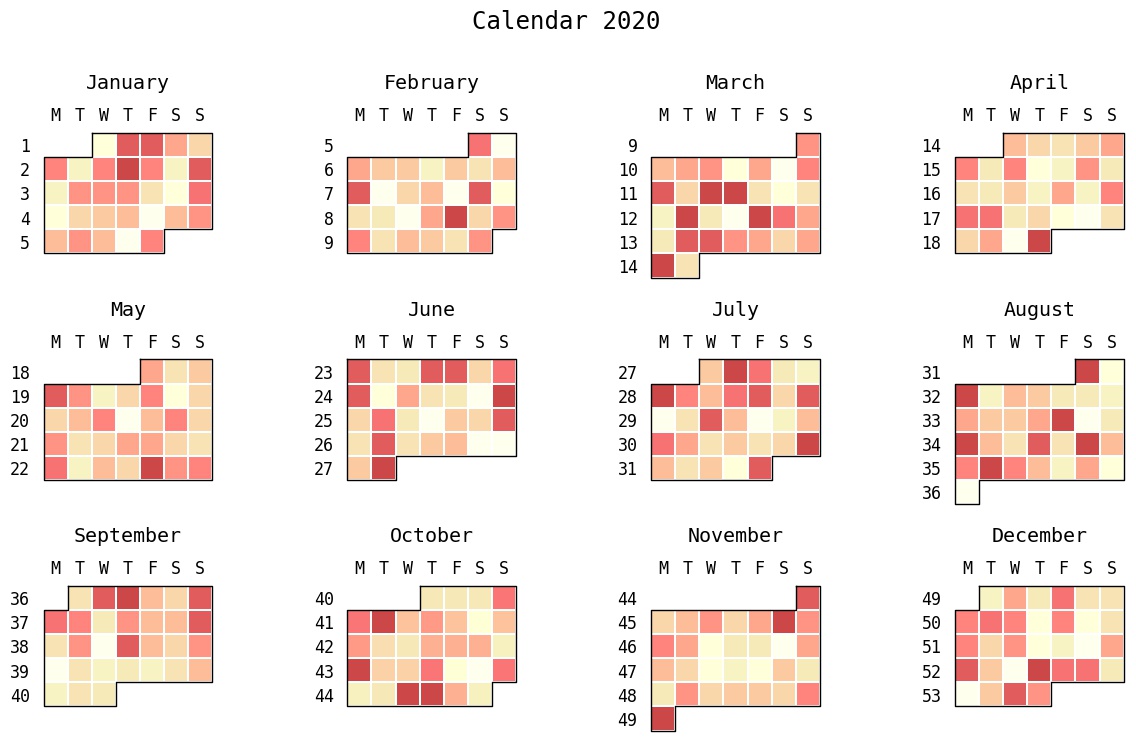
# Calendar plot.
july.calendar_plot(dates, data)
Main reason: All the obvious names like calplot, calmap, and calendarplot were all already taken by similar packages. This had me looking for a new name that wouldn't get easily mixed up with the other packages.
The reasoning was roughly as follows:
Heatmap + month → Hot month → July ✨Also, as a summer loving person stuck in the Northern hemisphere, July is my favourite month by a light year.
v0.1.0: Working build but with minimal documentation.v0.1.1: Fix relative image link in readme.v0.1.2: Remove unnecessary argument from rcmod to be compatible with matplotlib versions earlier than v3.4.x.v0.1.3: Fix week number labelling bug in month_plot() and calendar_plot()date_grid and colorbar are used in conjunction.YYYY-MM-DD.more like this
Widgets for Douban and Trakt watchlists plus personalized recommendations, live TV streaming including PlutoTV, Yatu ra…
A lightweight, simplified, RedNotebook-inspired journal/diary app. Built with Electron. Makes dated text files.
View and plan your life in an online calendar by visually by seeing it from days to decades
search projects, people, and tags