agentlytics
Comprehensive analytics dashboard for AI coding agents — Cursor, Windsurf, Claude Code, VS Code Copilot, Zed, Antigravi…
JavaScript★ 555
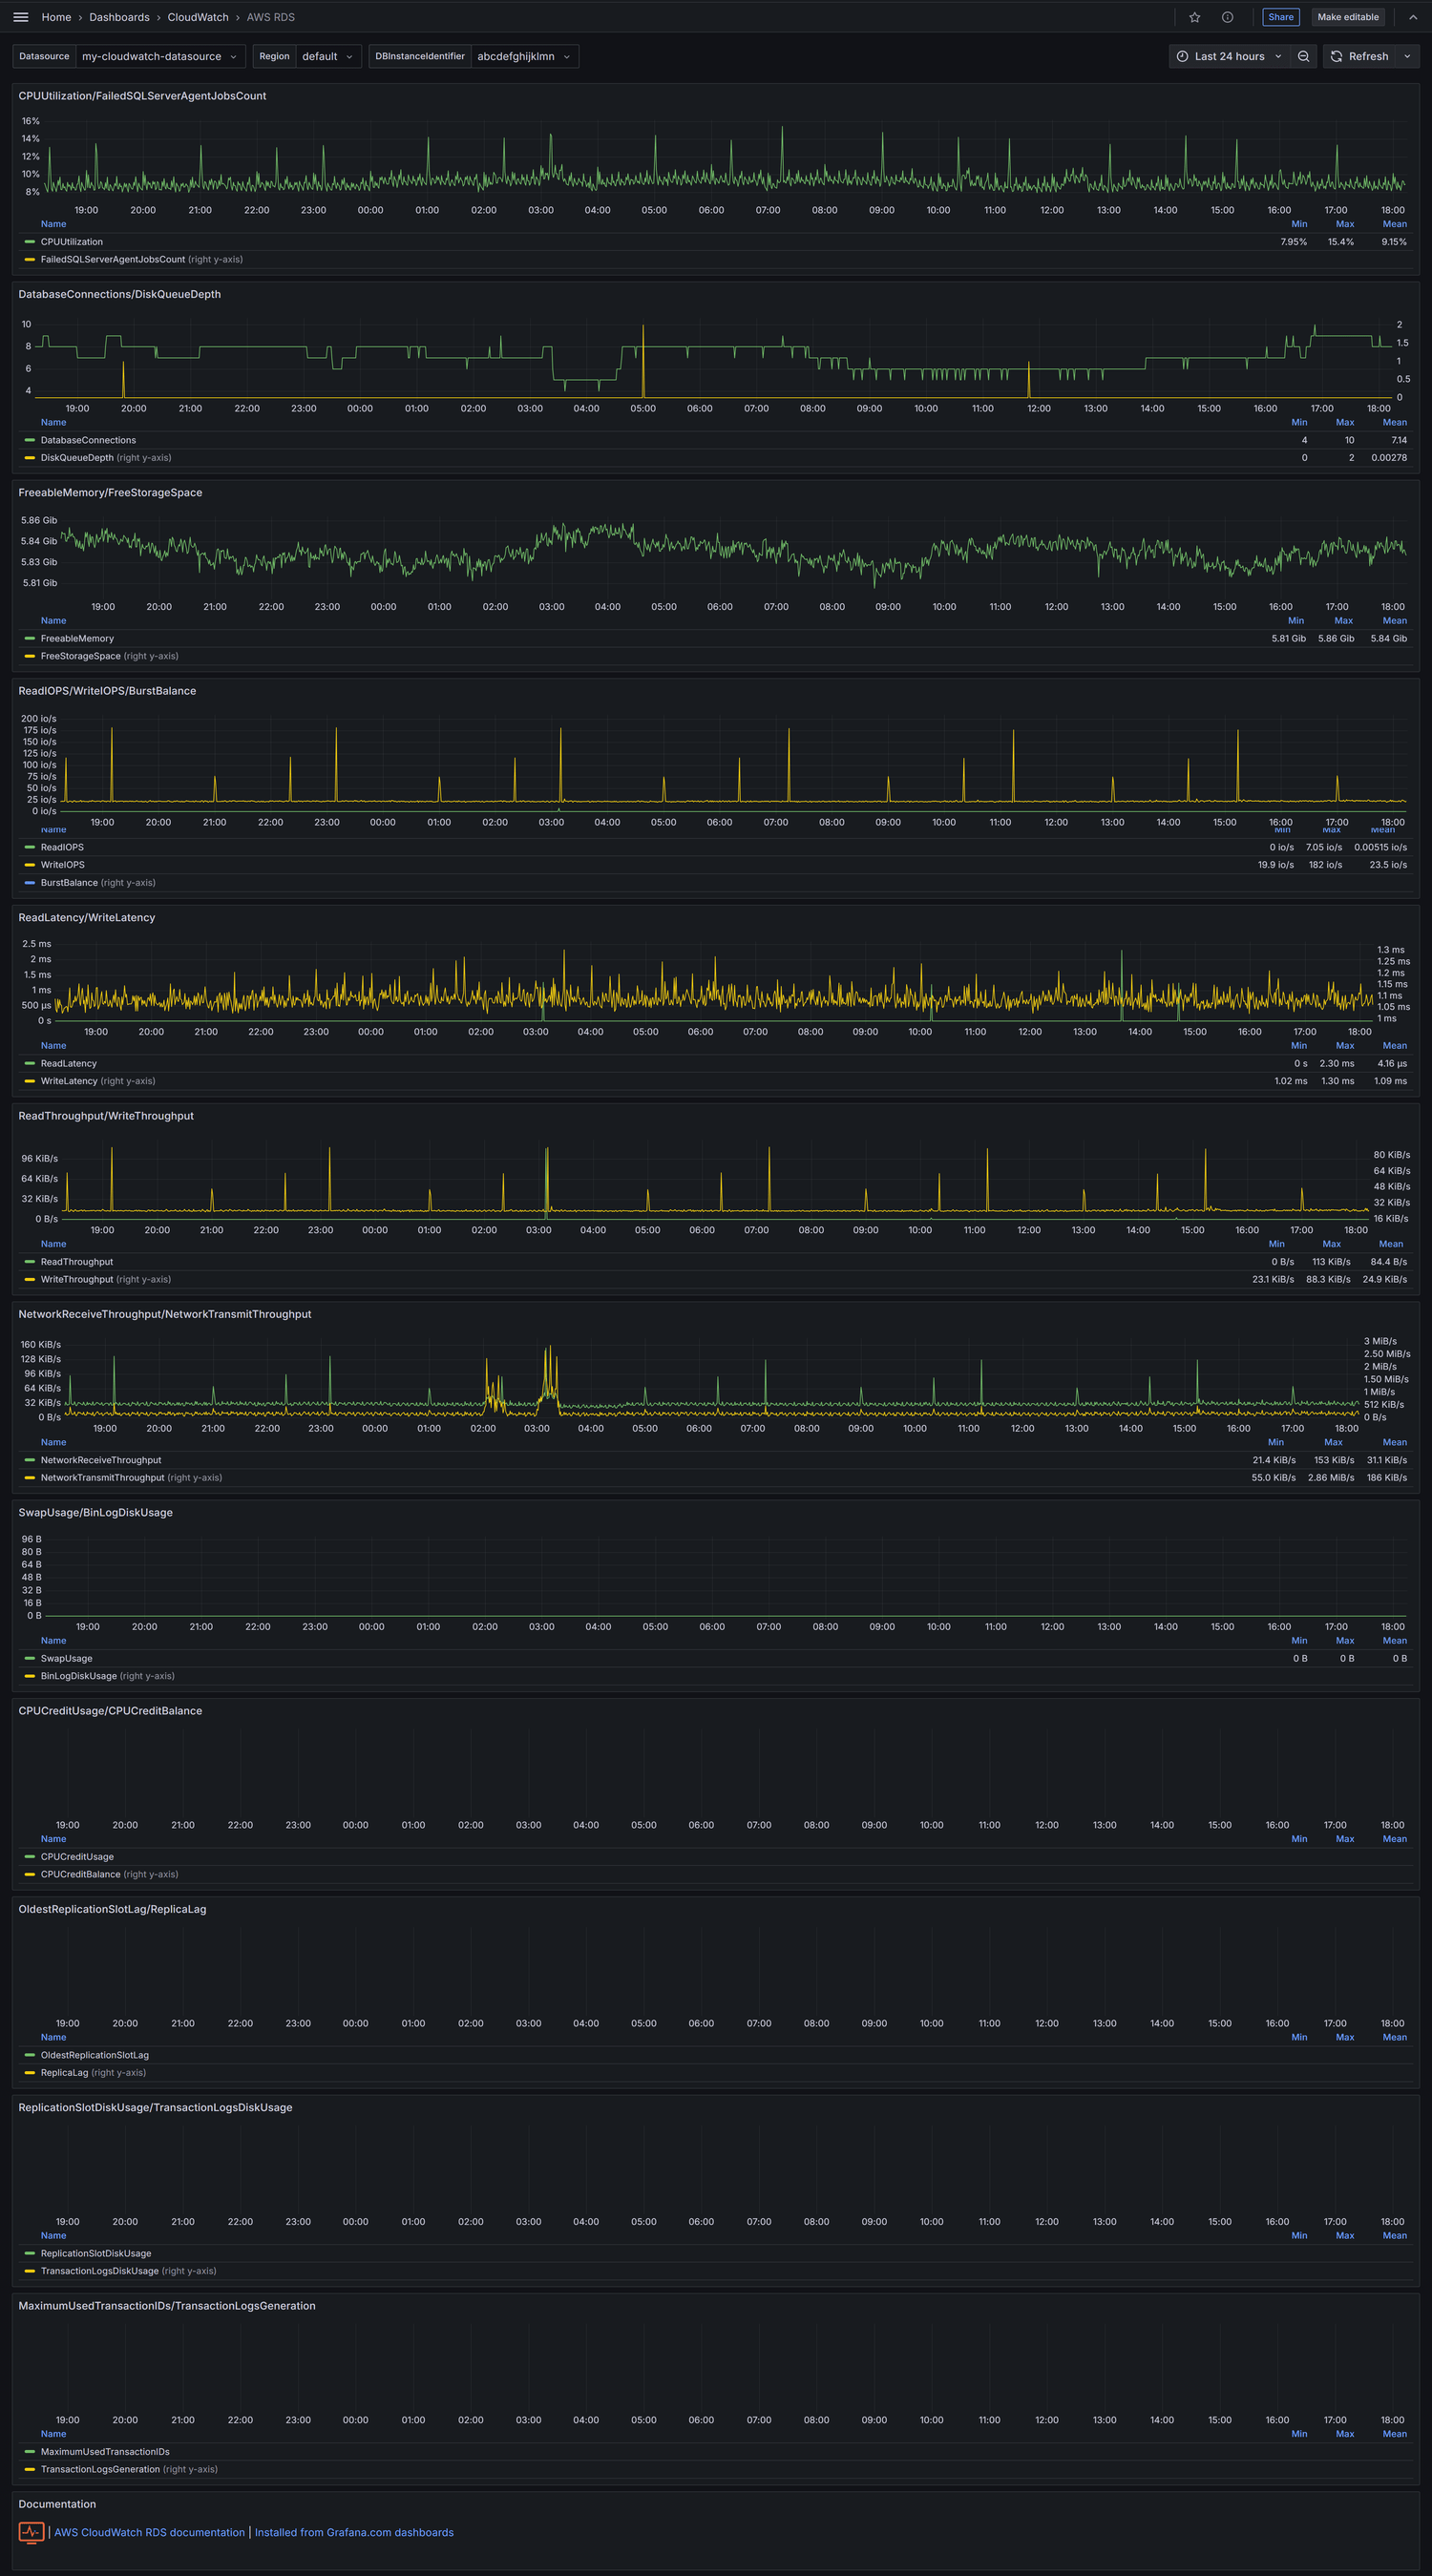
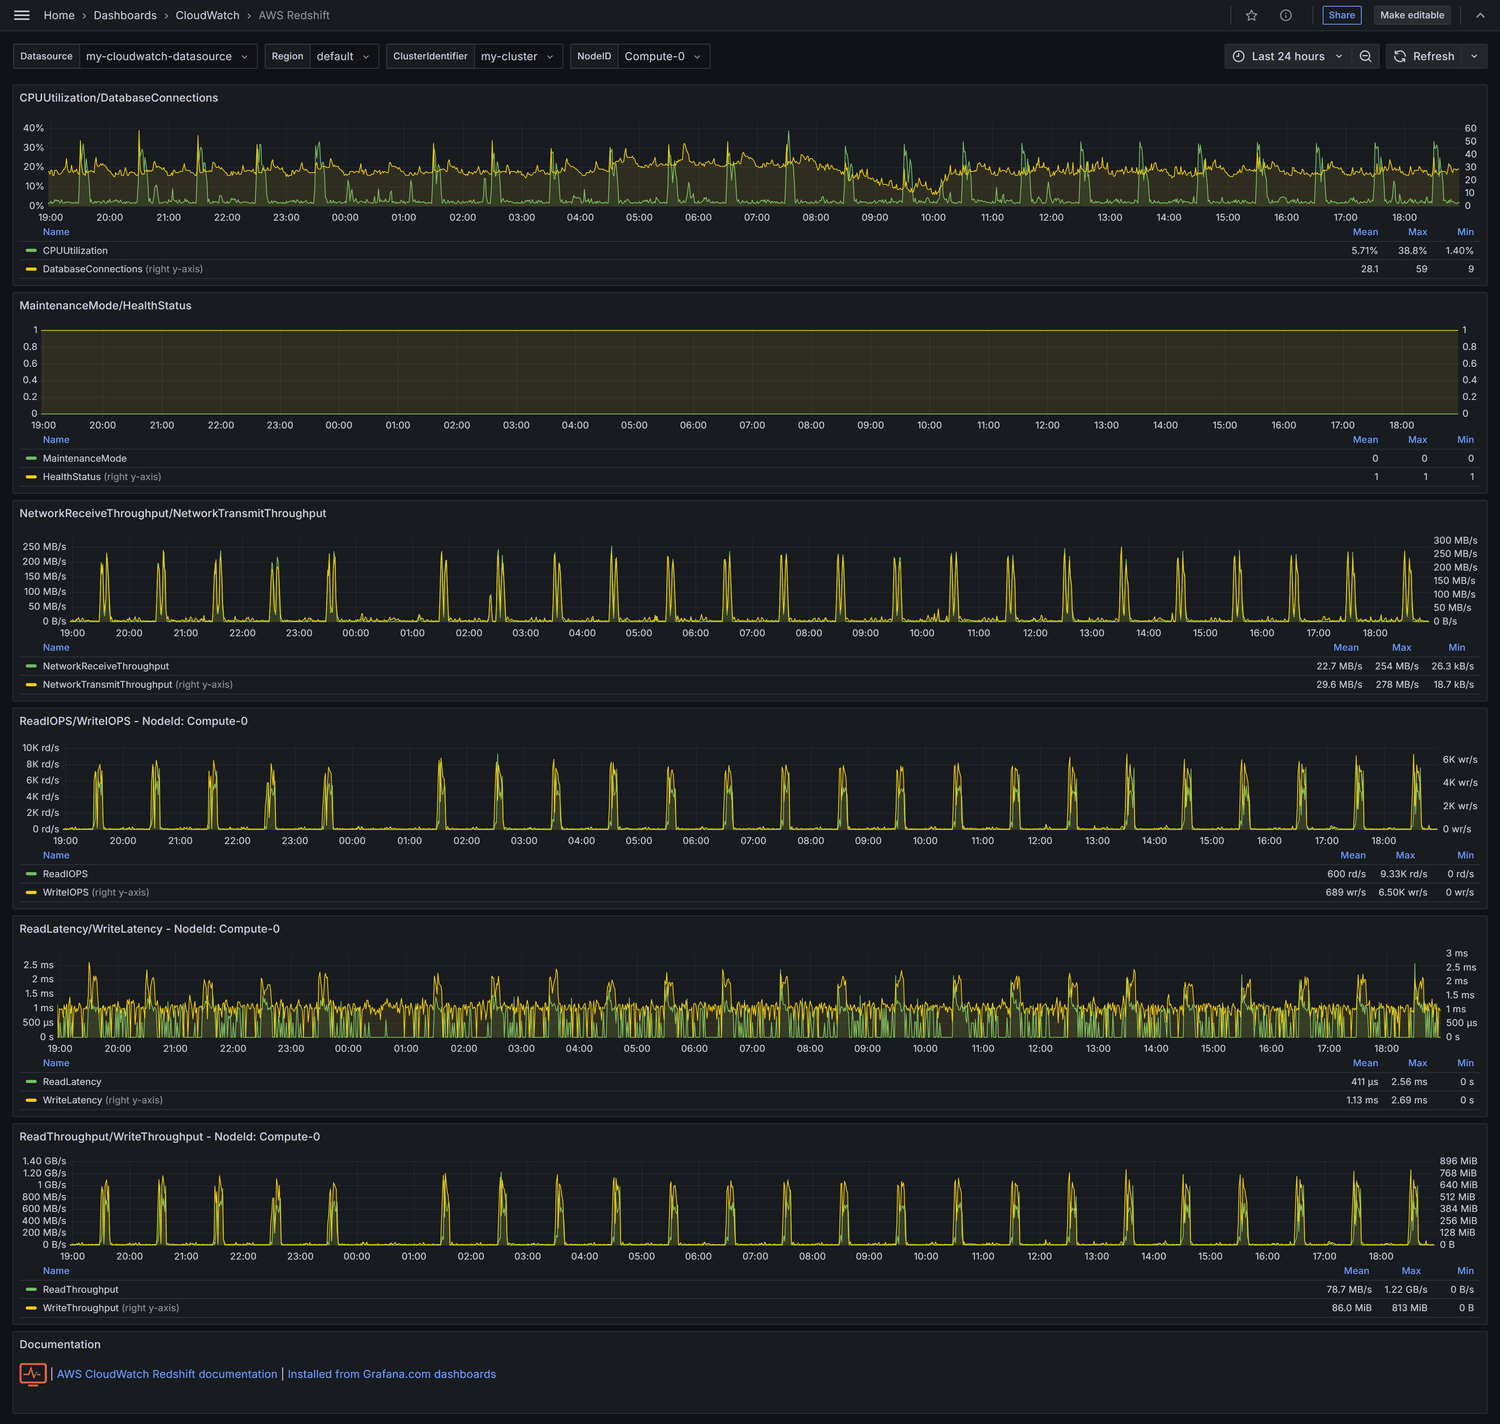
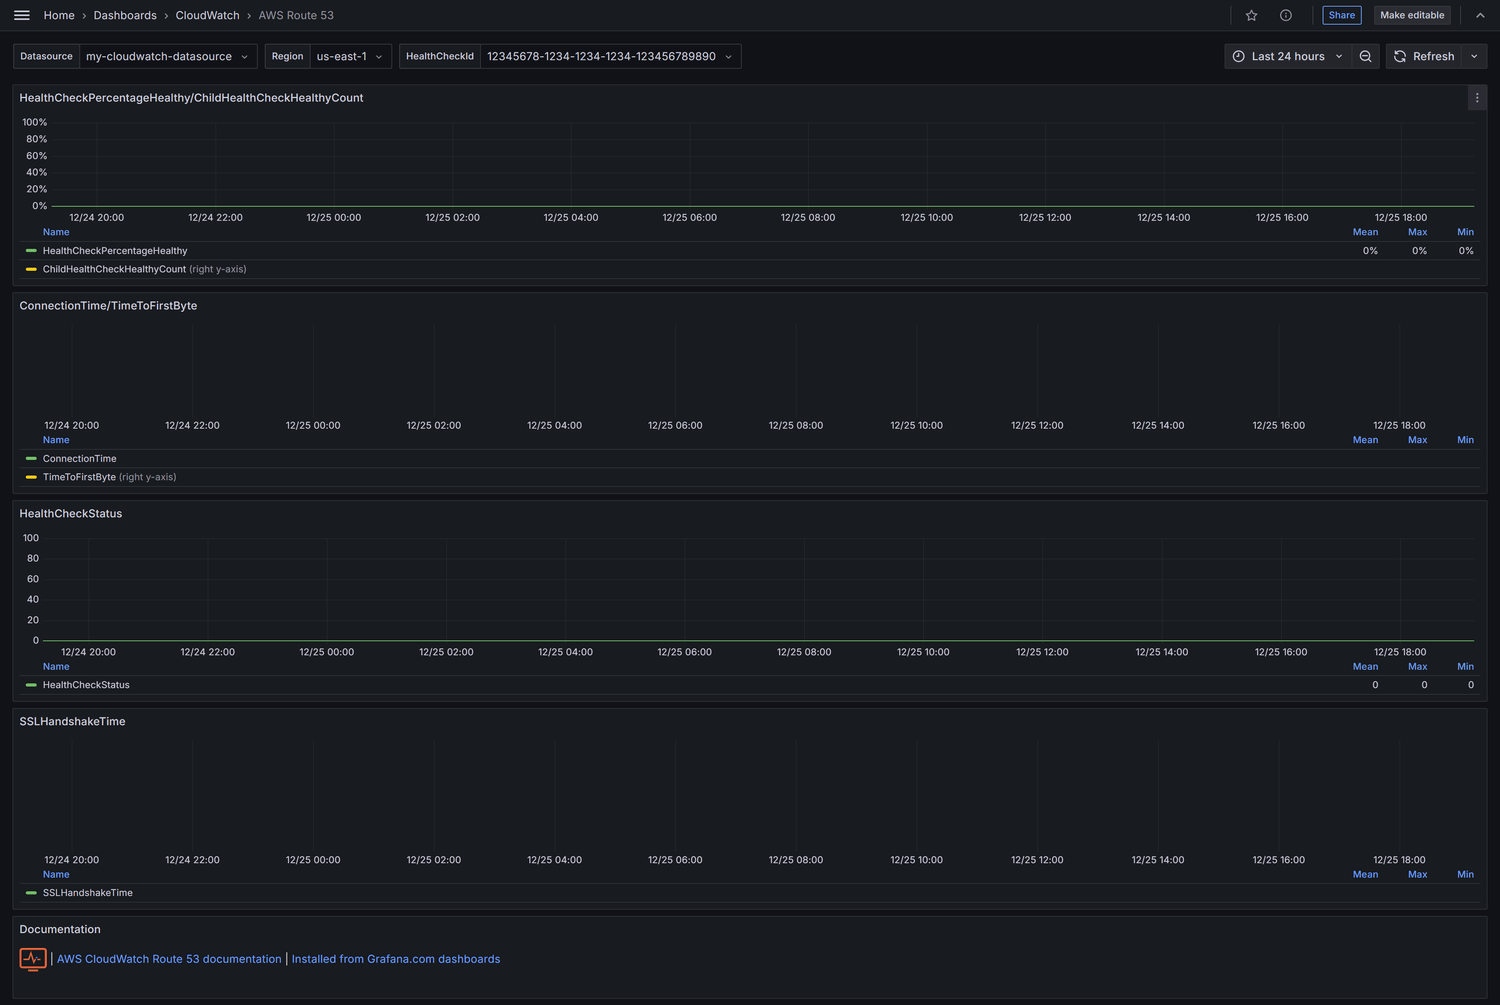
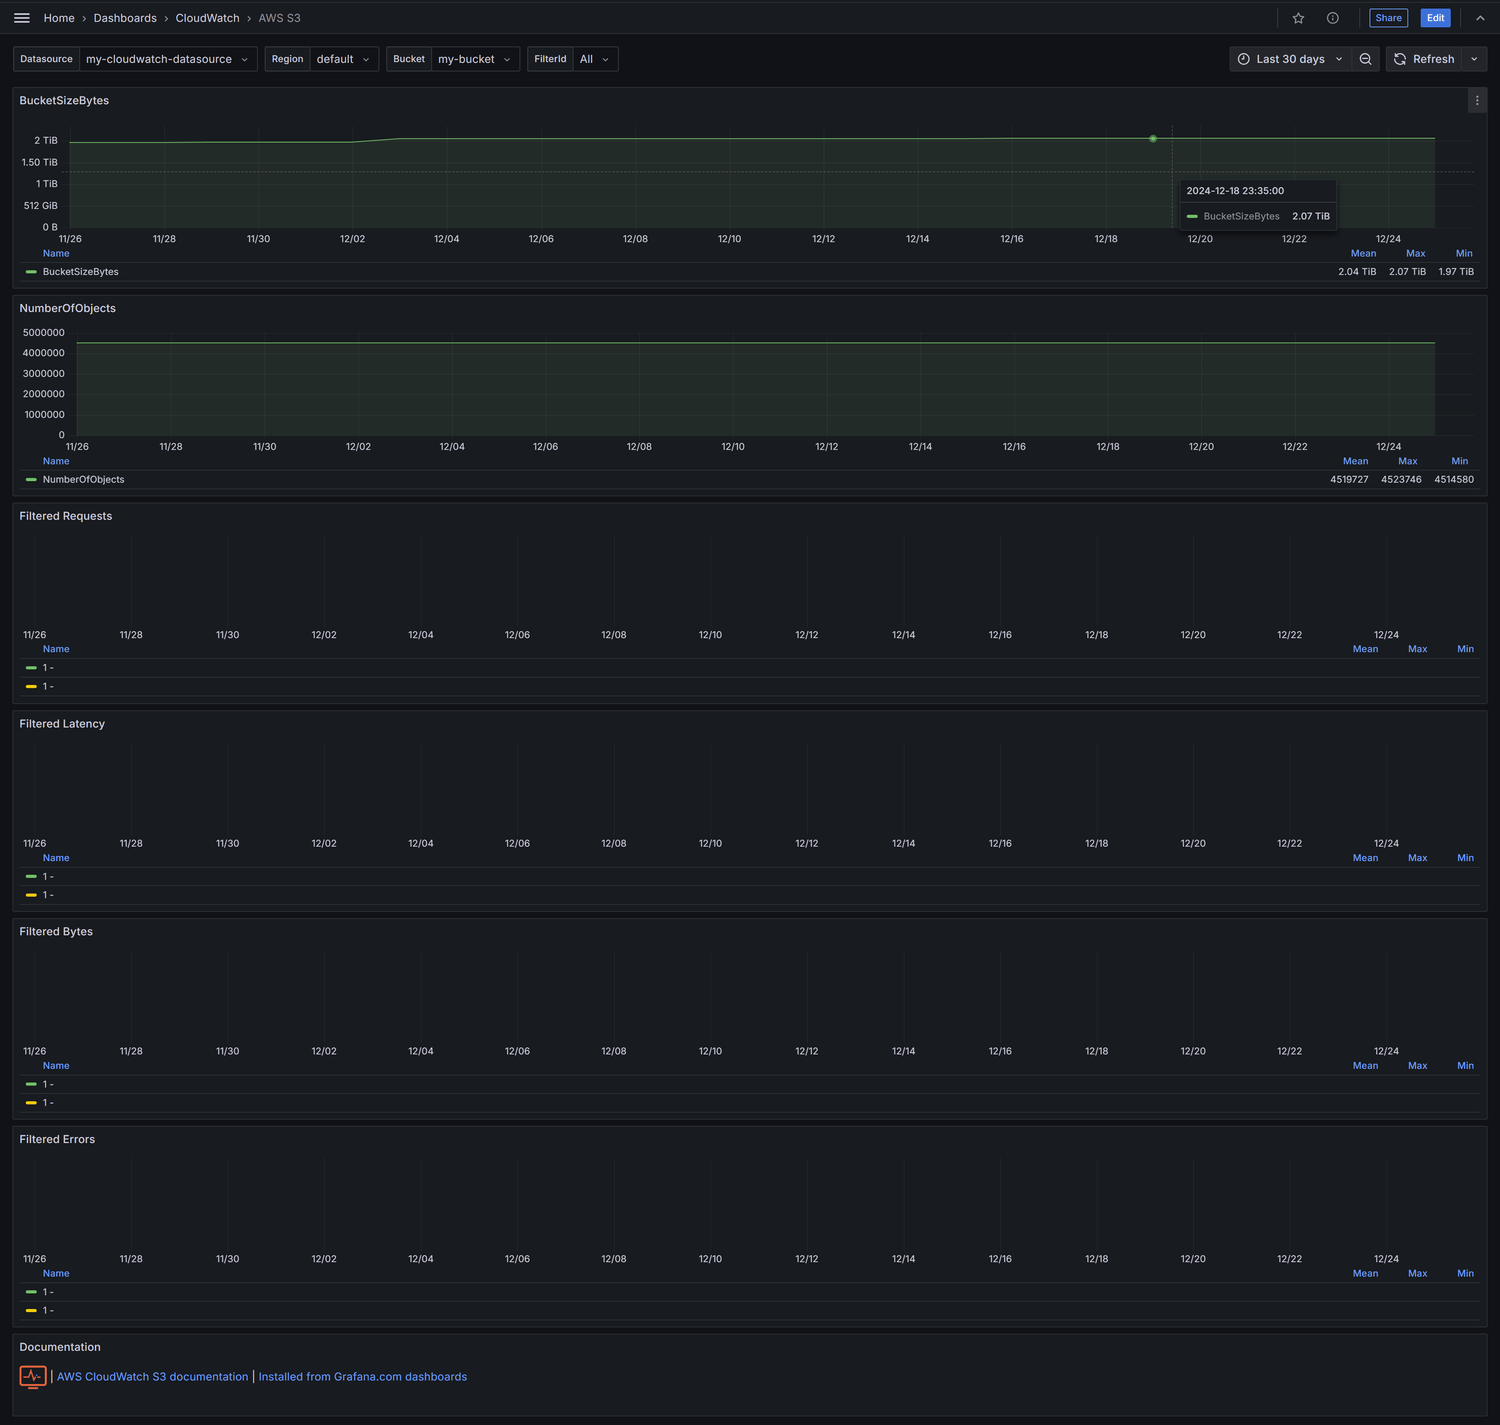
:cloud: 40+ Grafana dashboards for AWS CloudWatch metrics: EC2, Lambda, S3, ELB, EMR, EBS, SNS, SES, SQS, RDS, EFS, Ela…
 monitoringartist
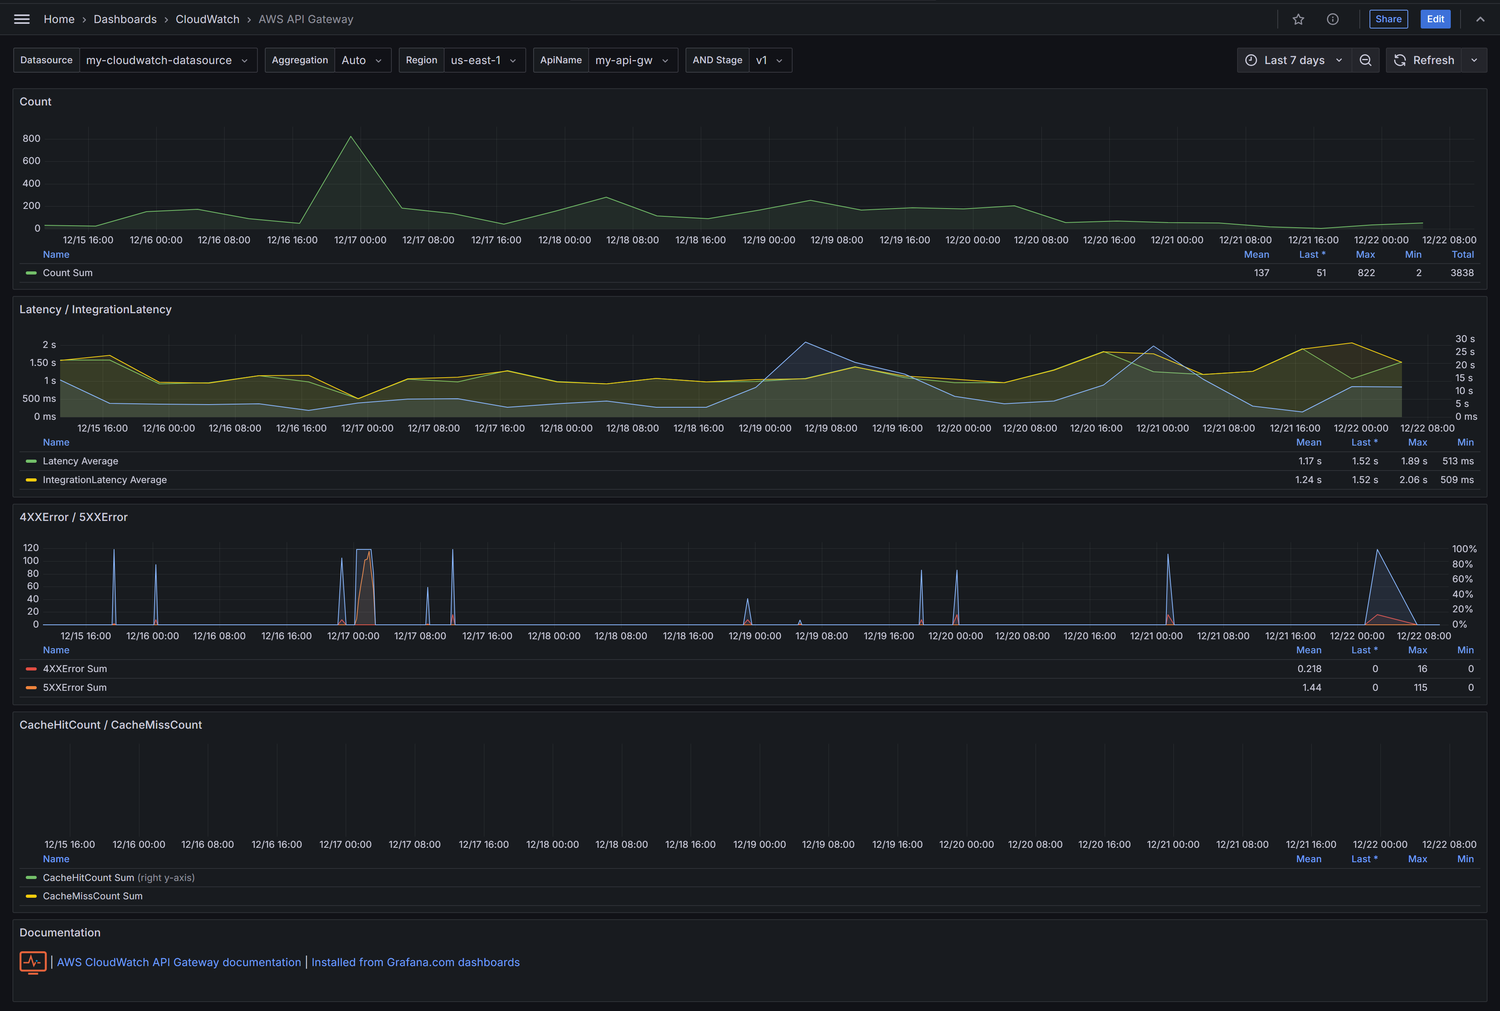
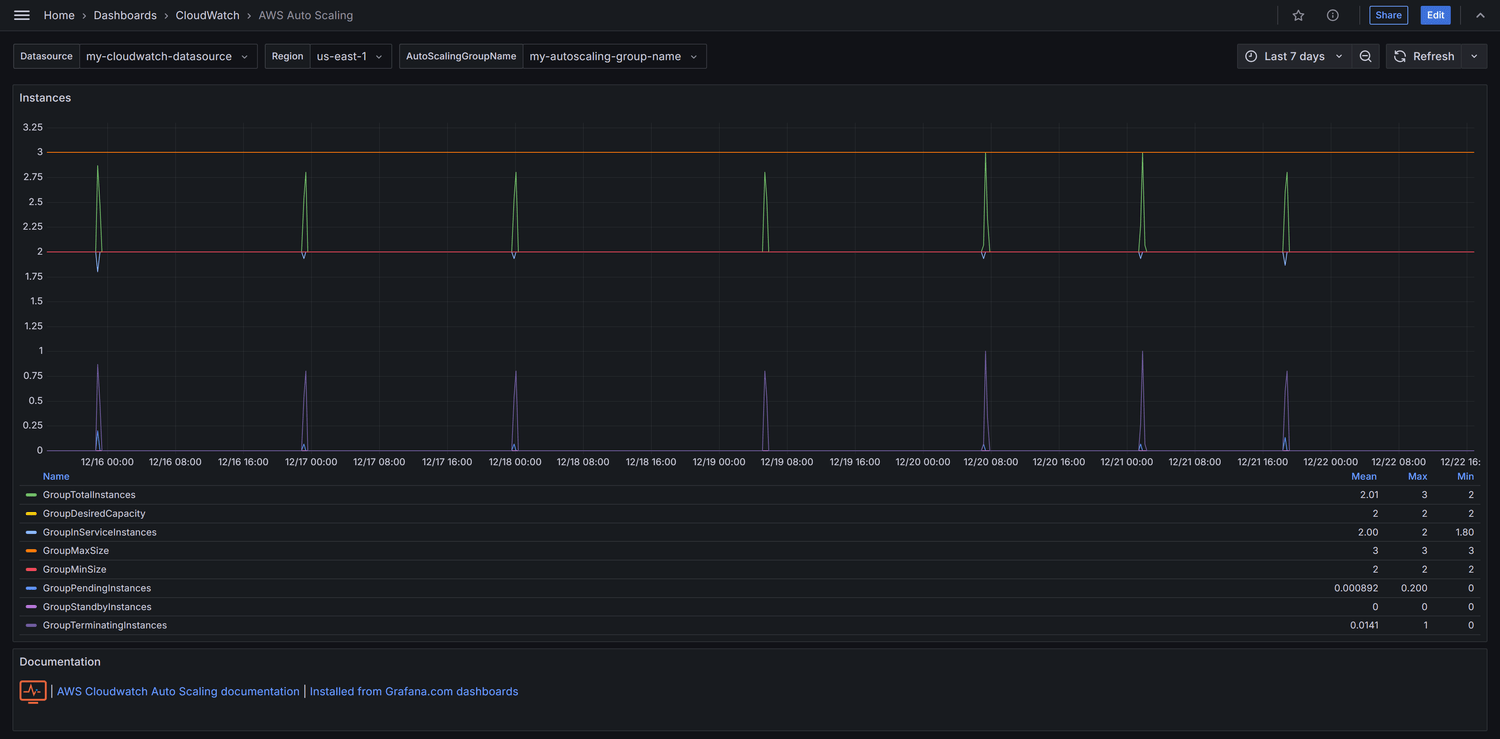
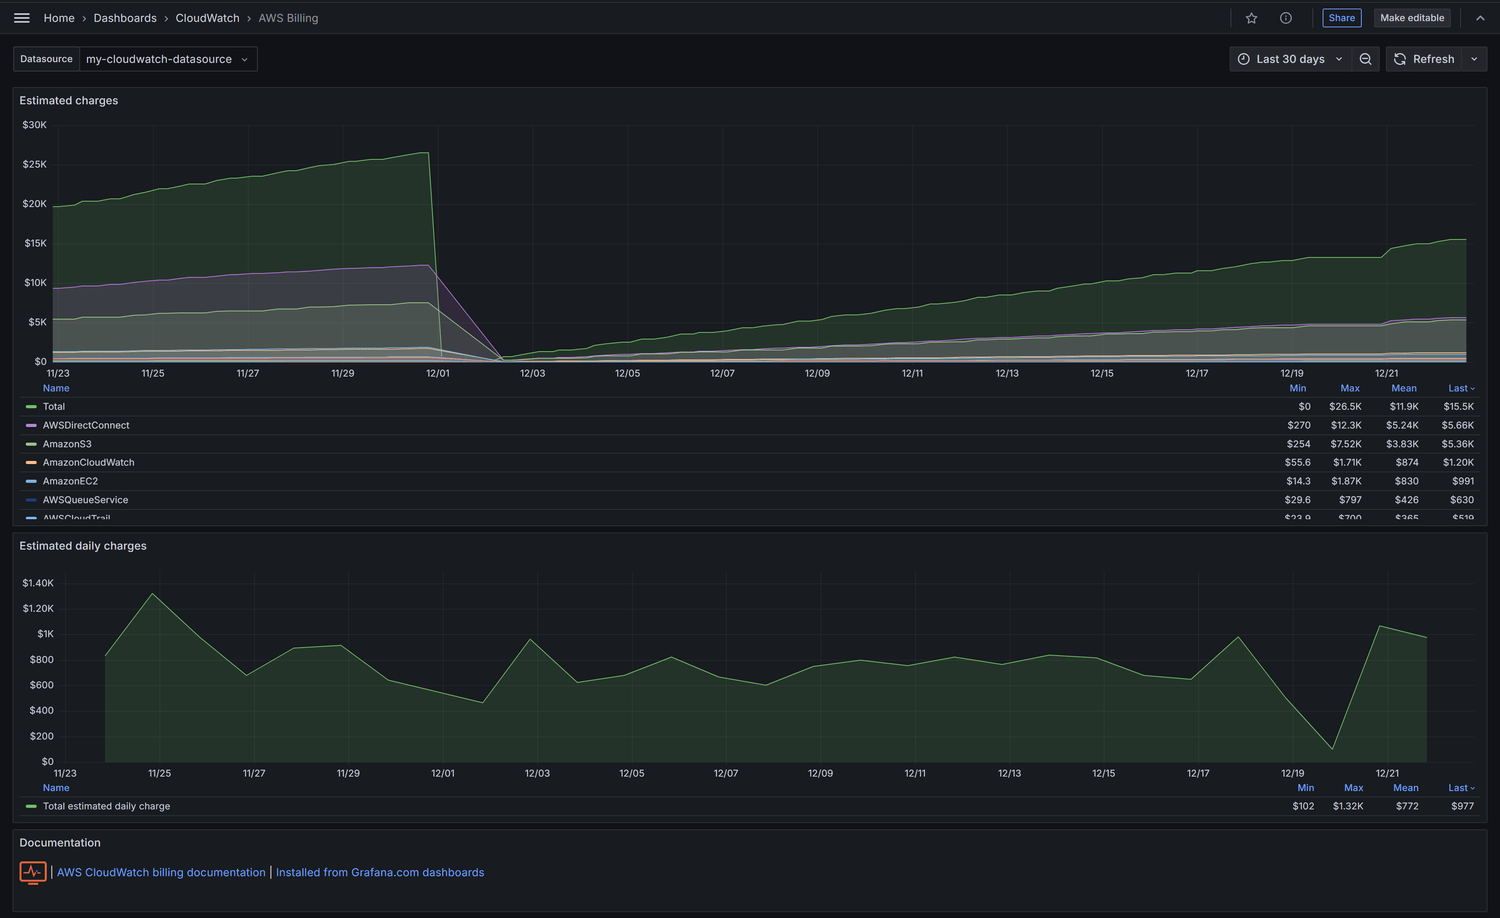
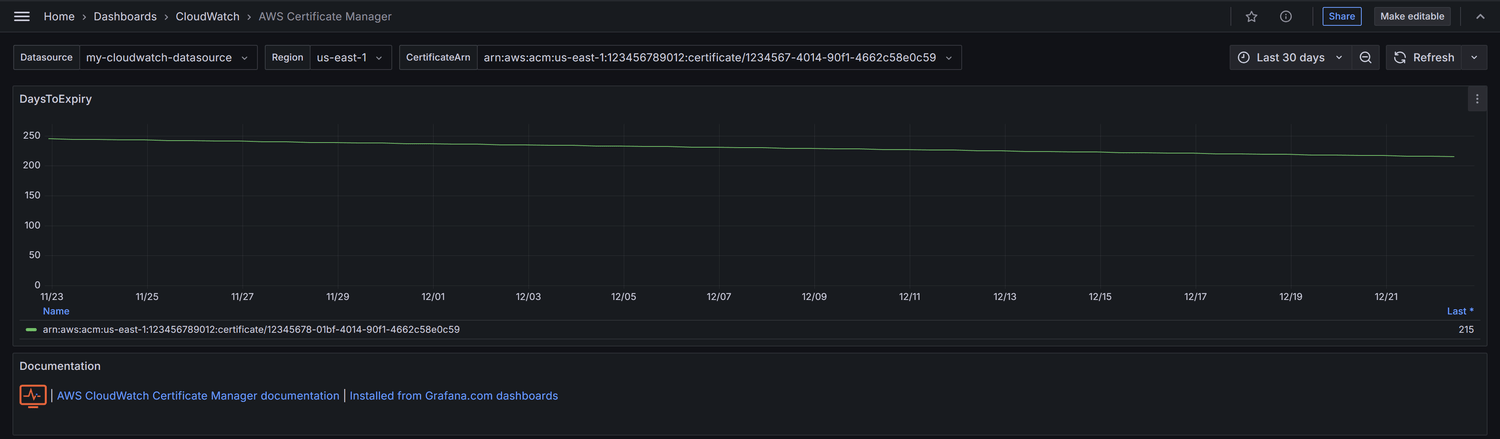
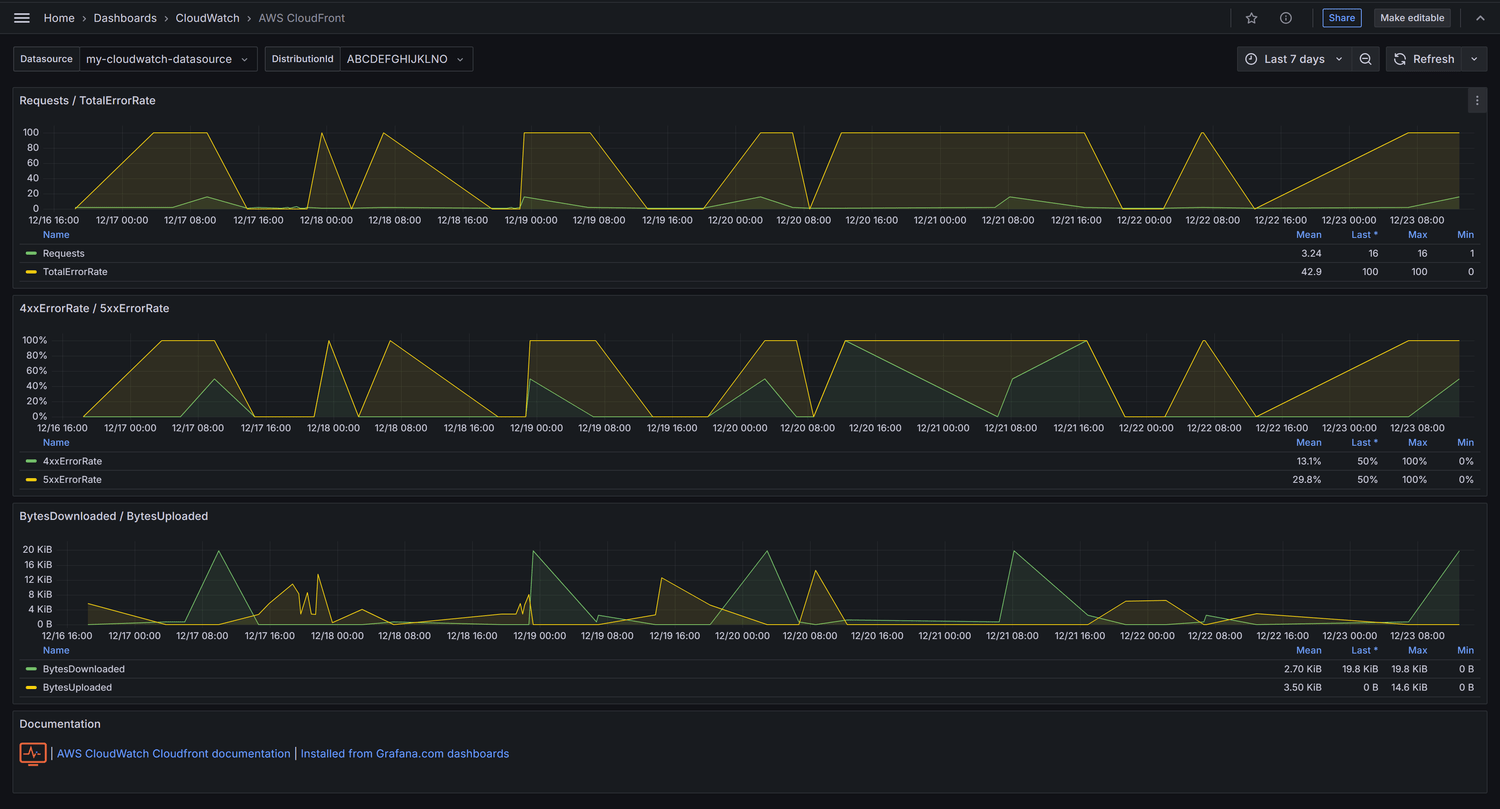
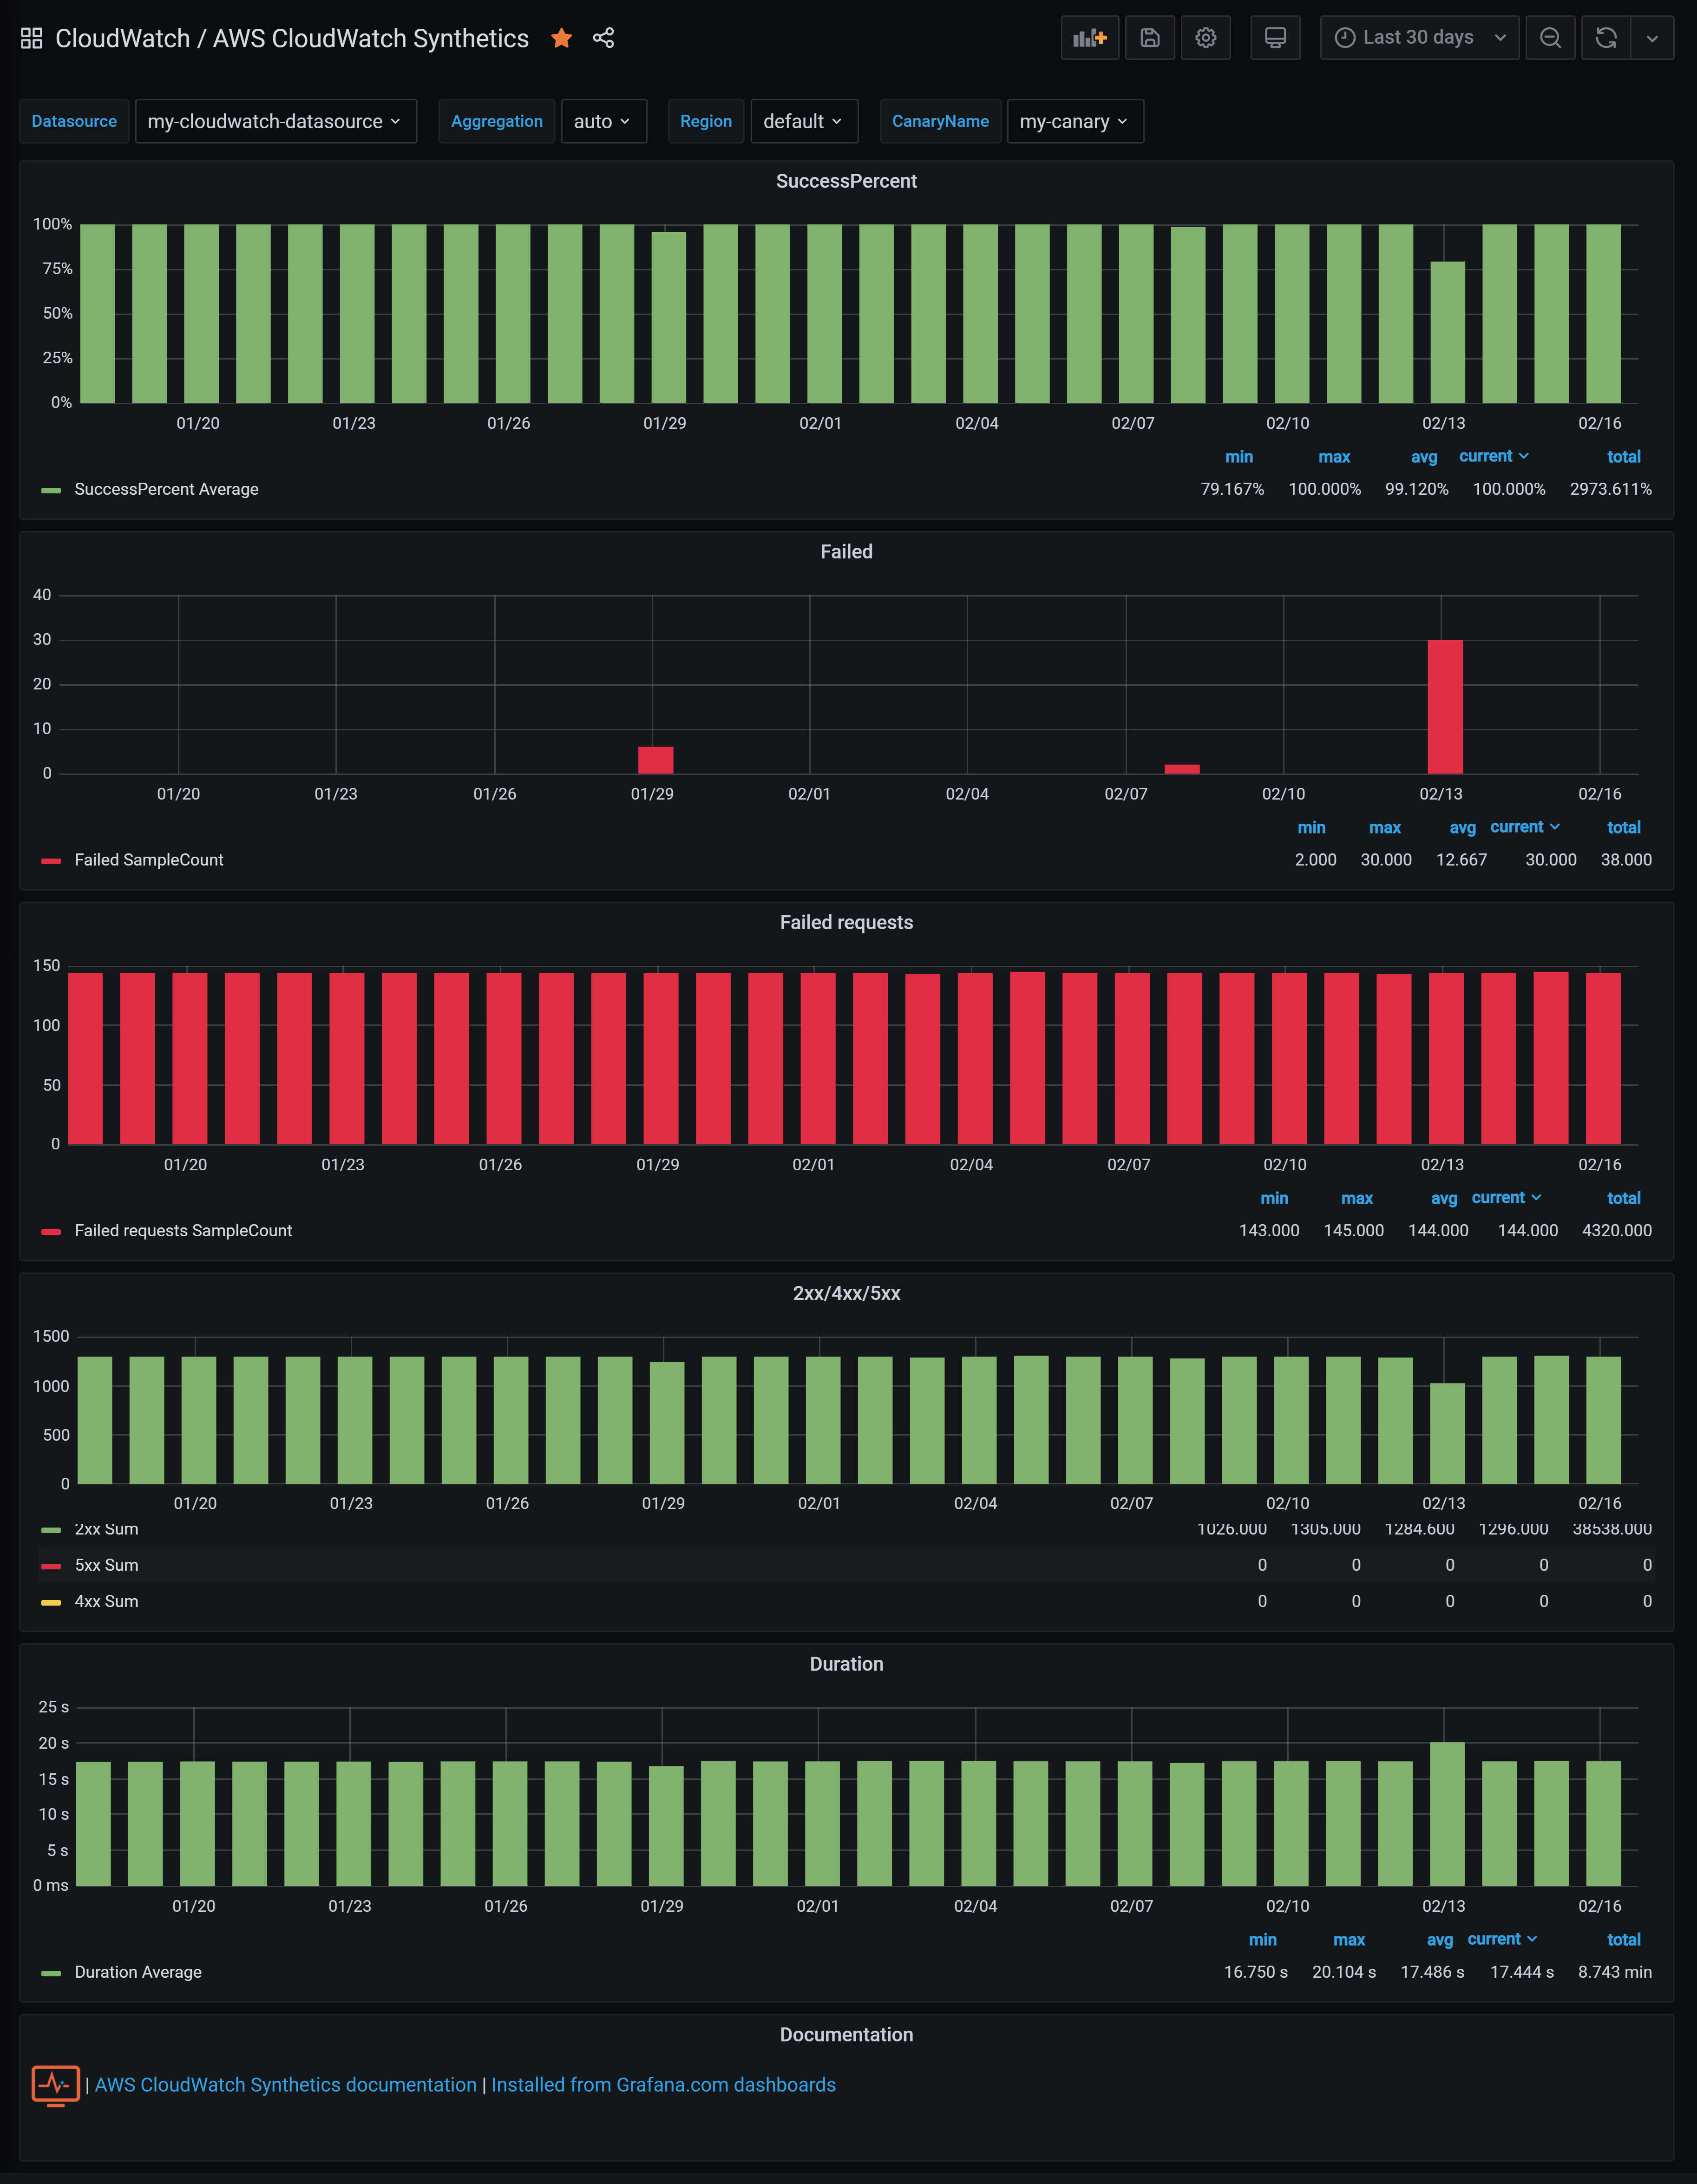
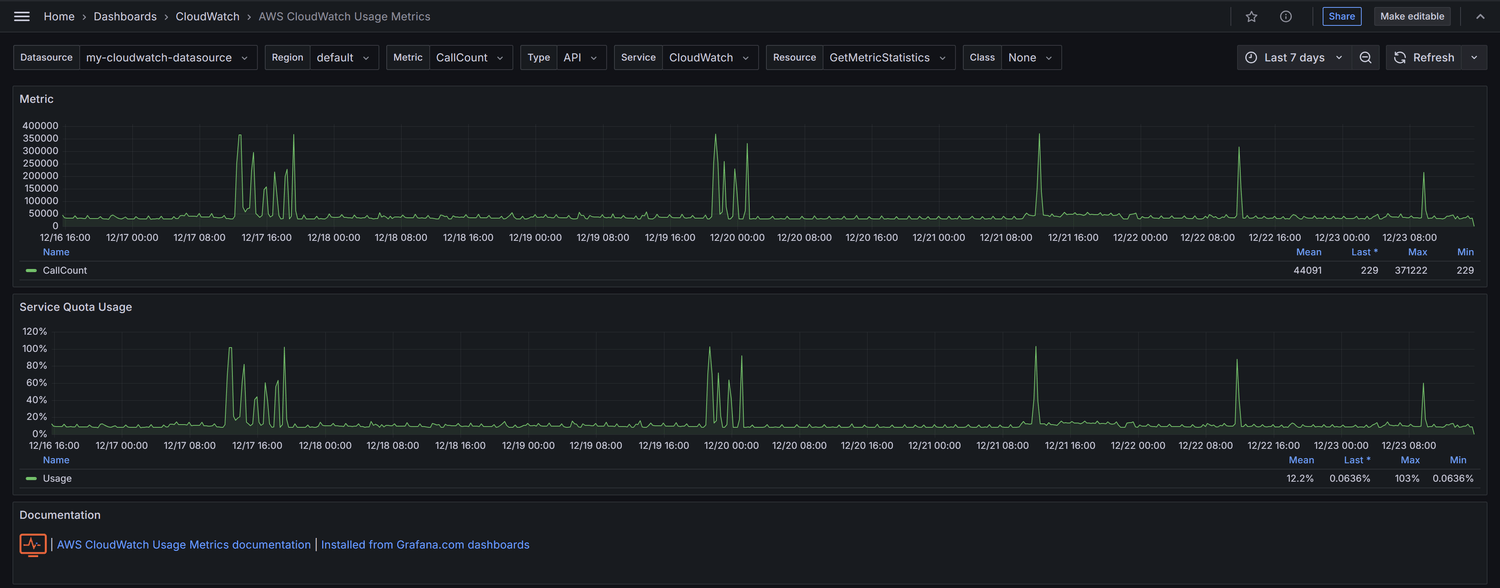
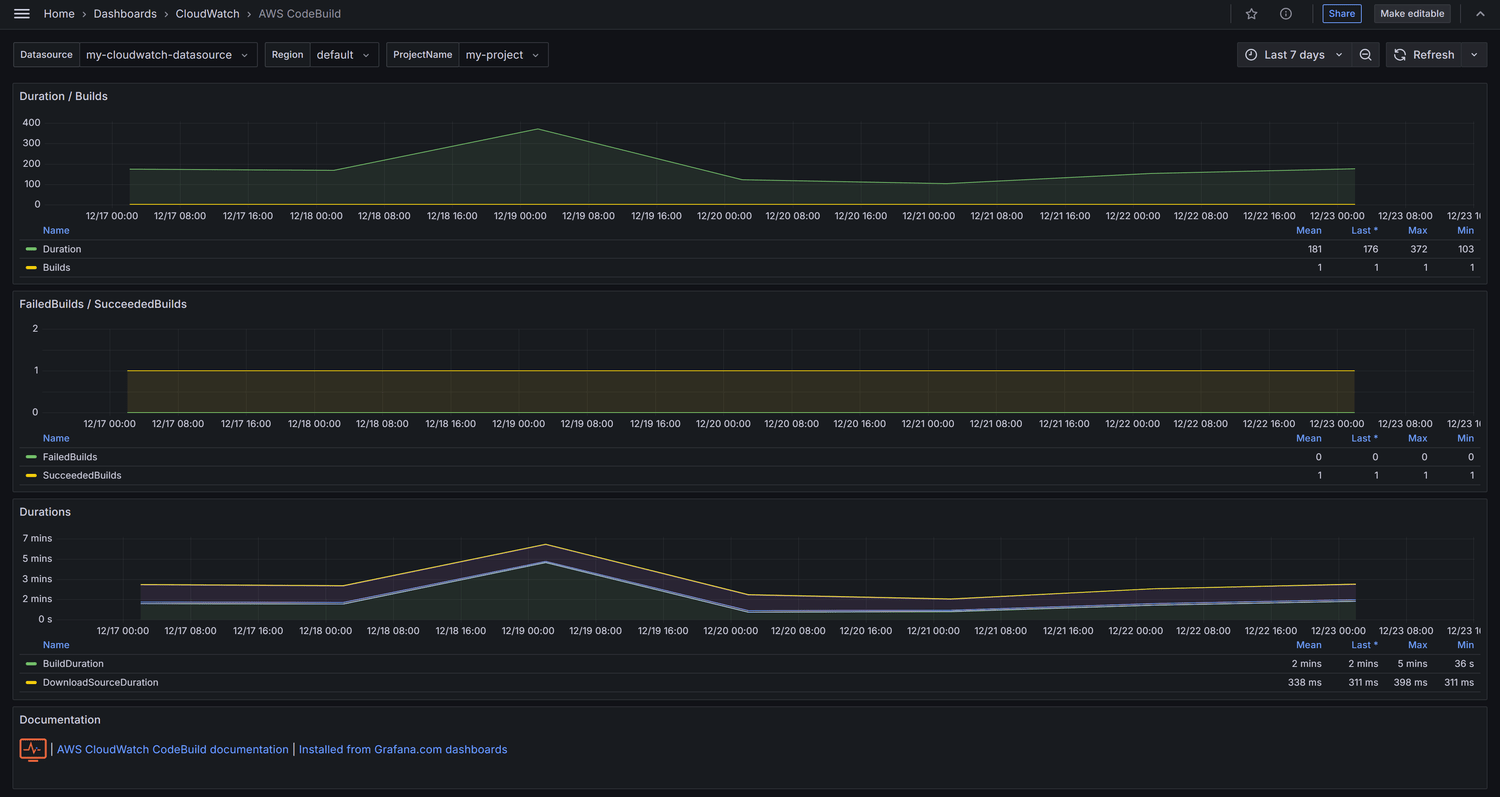
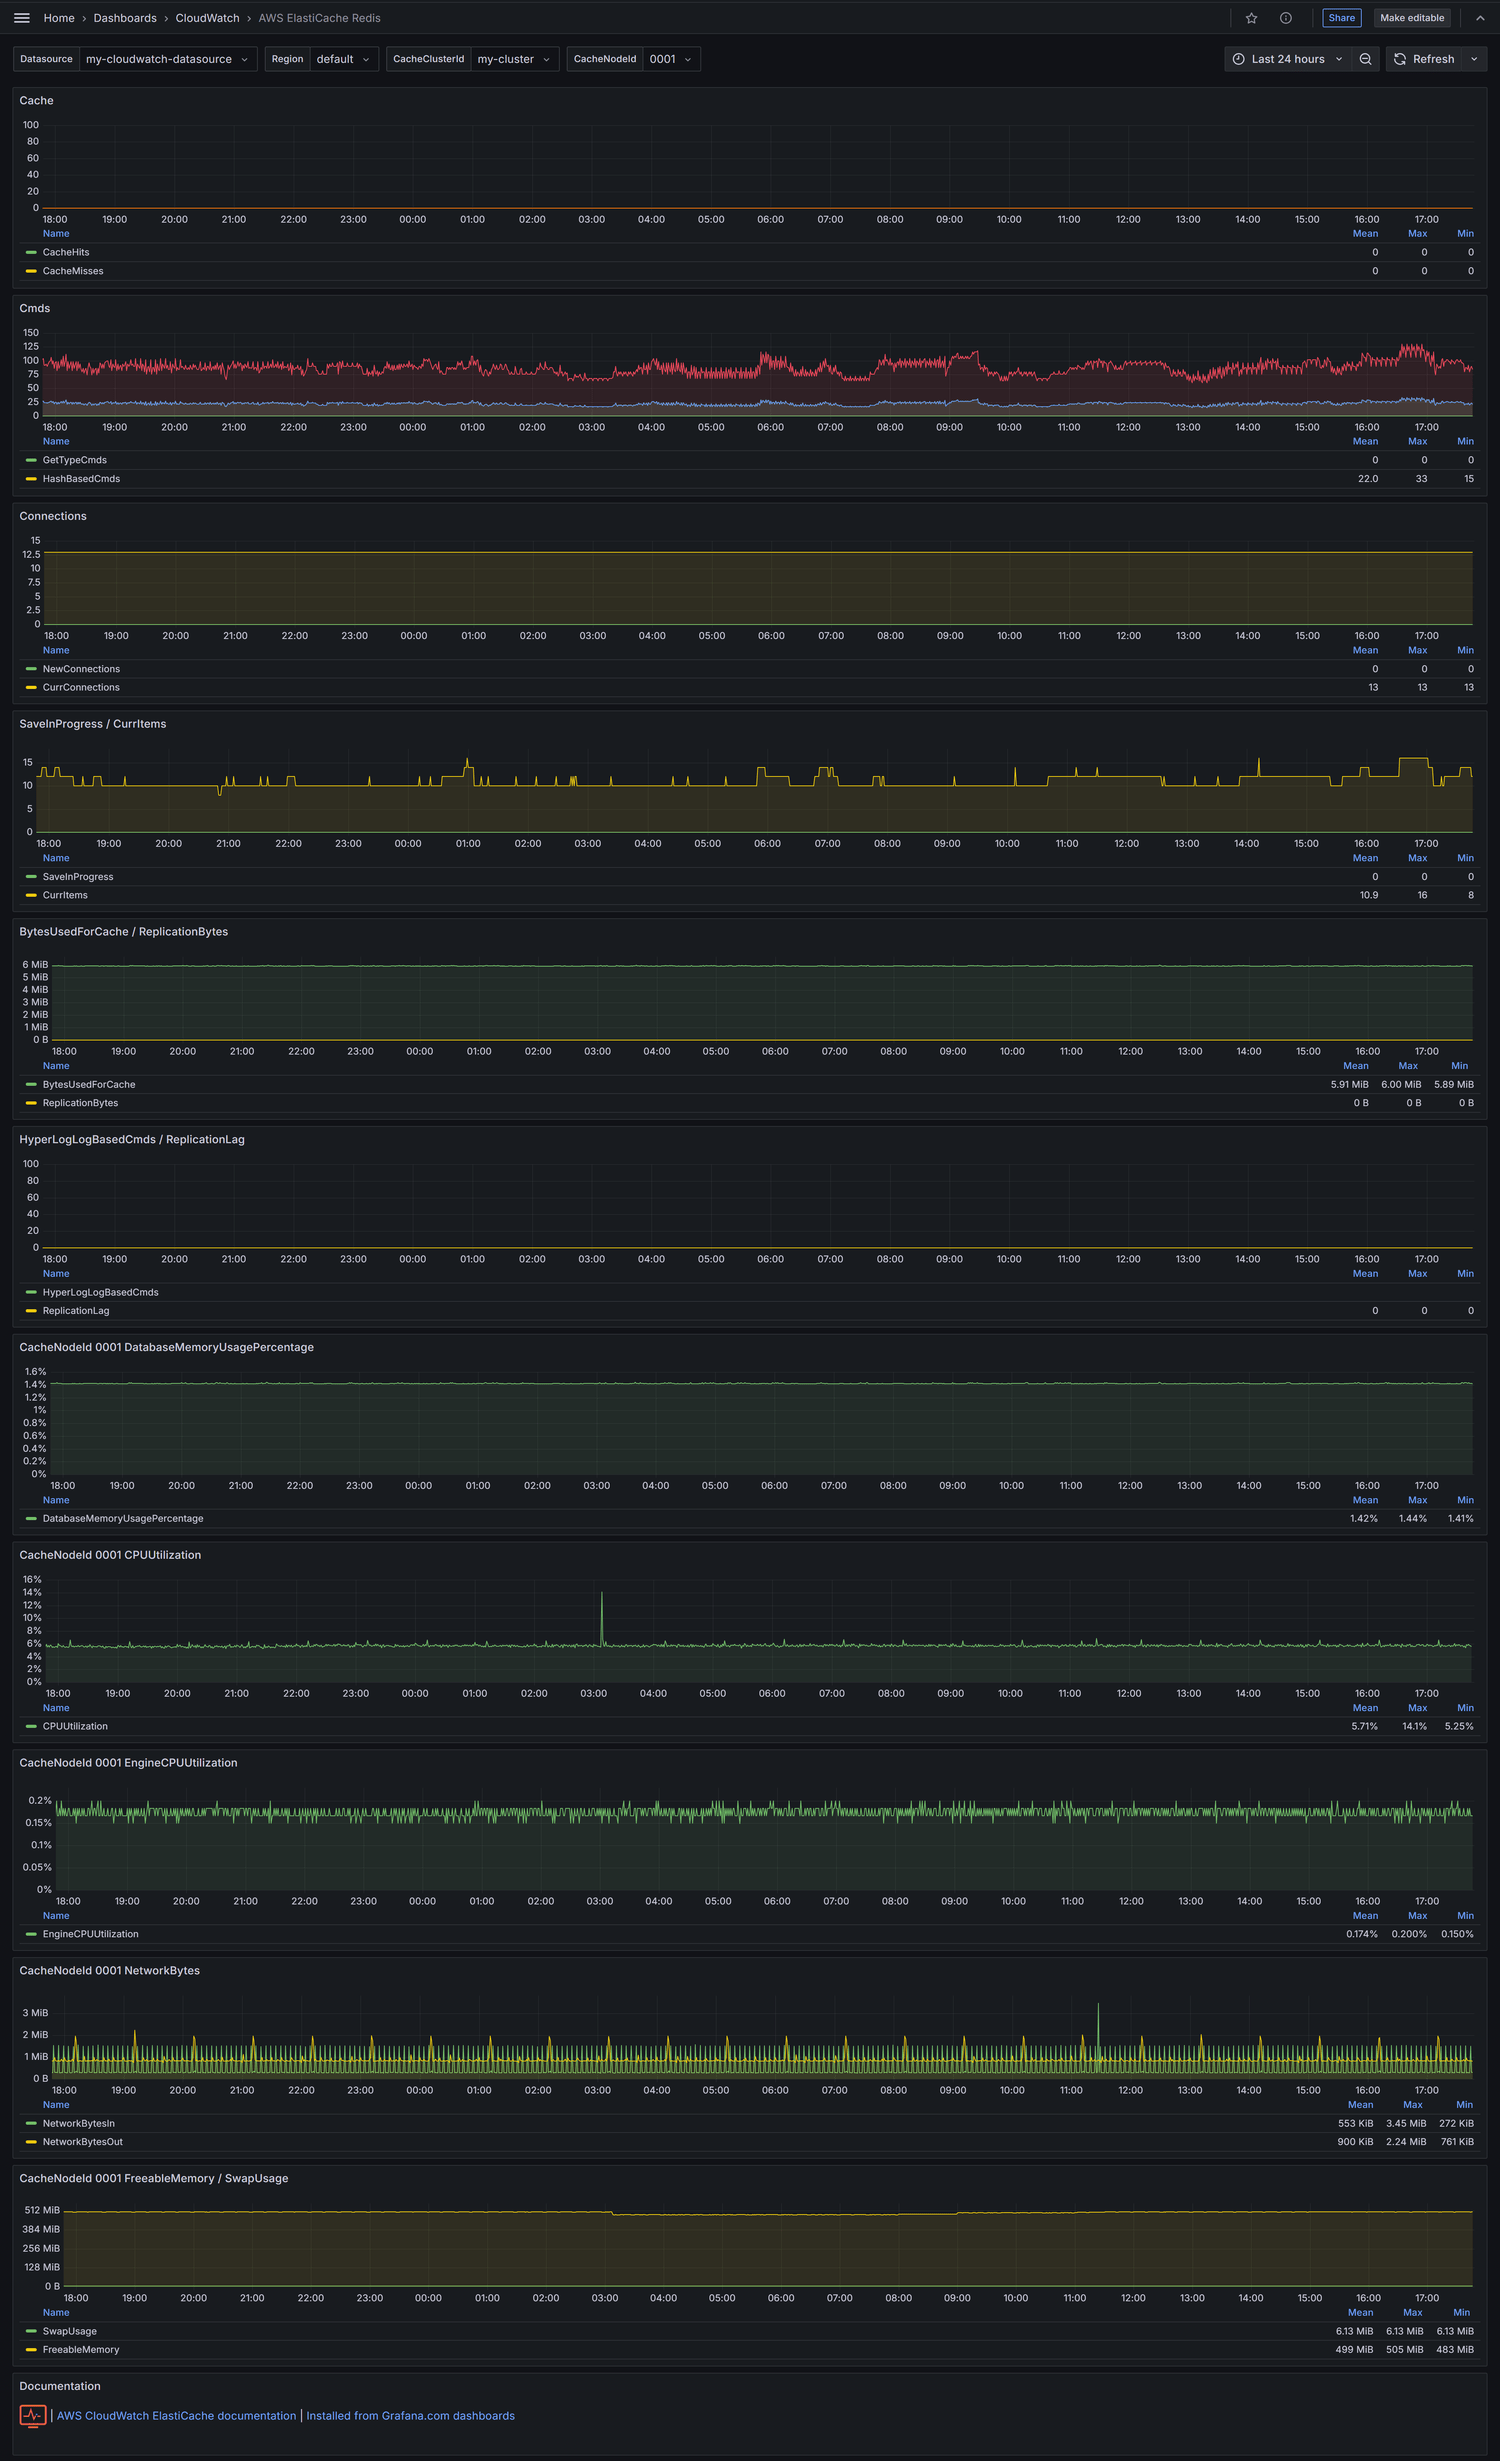
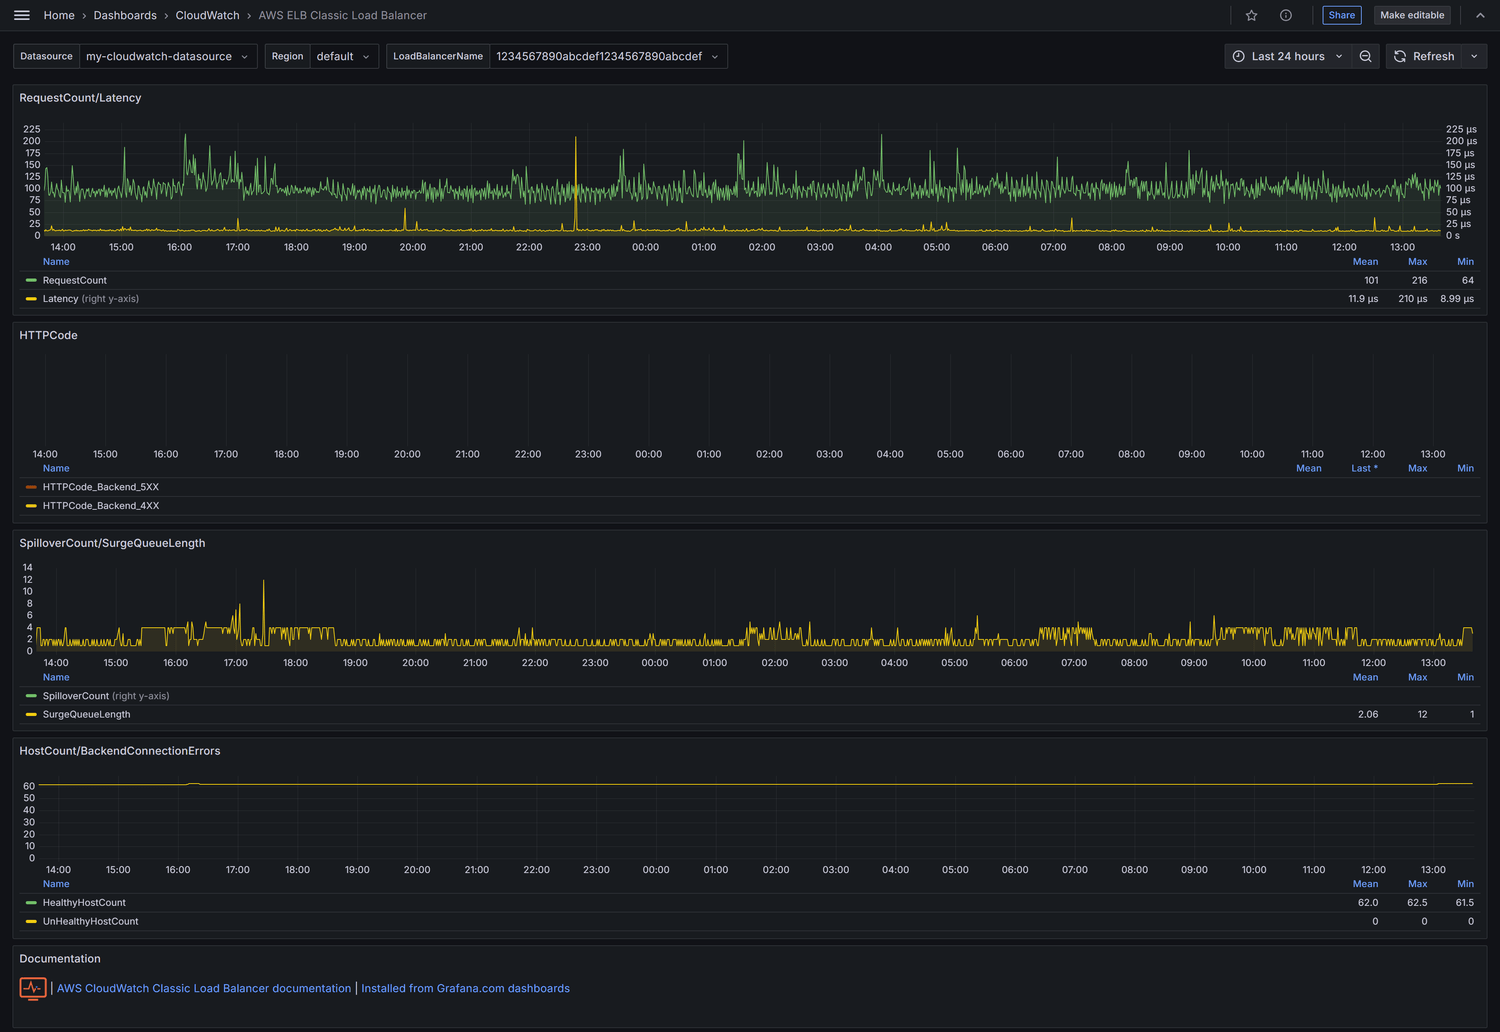
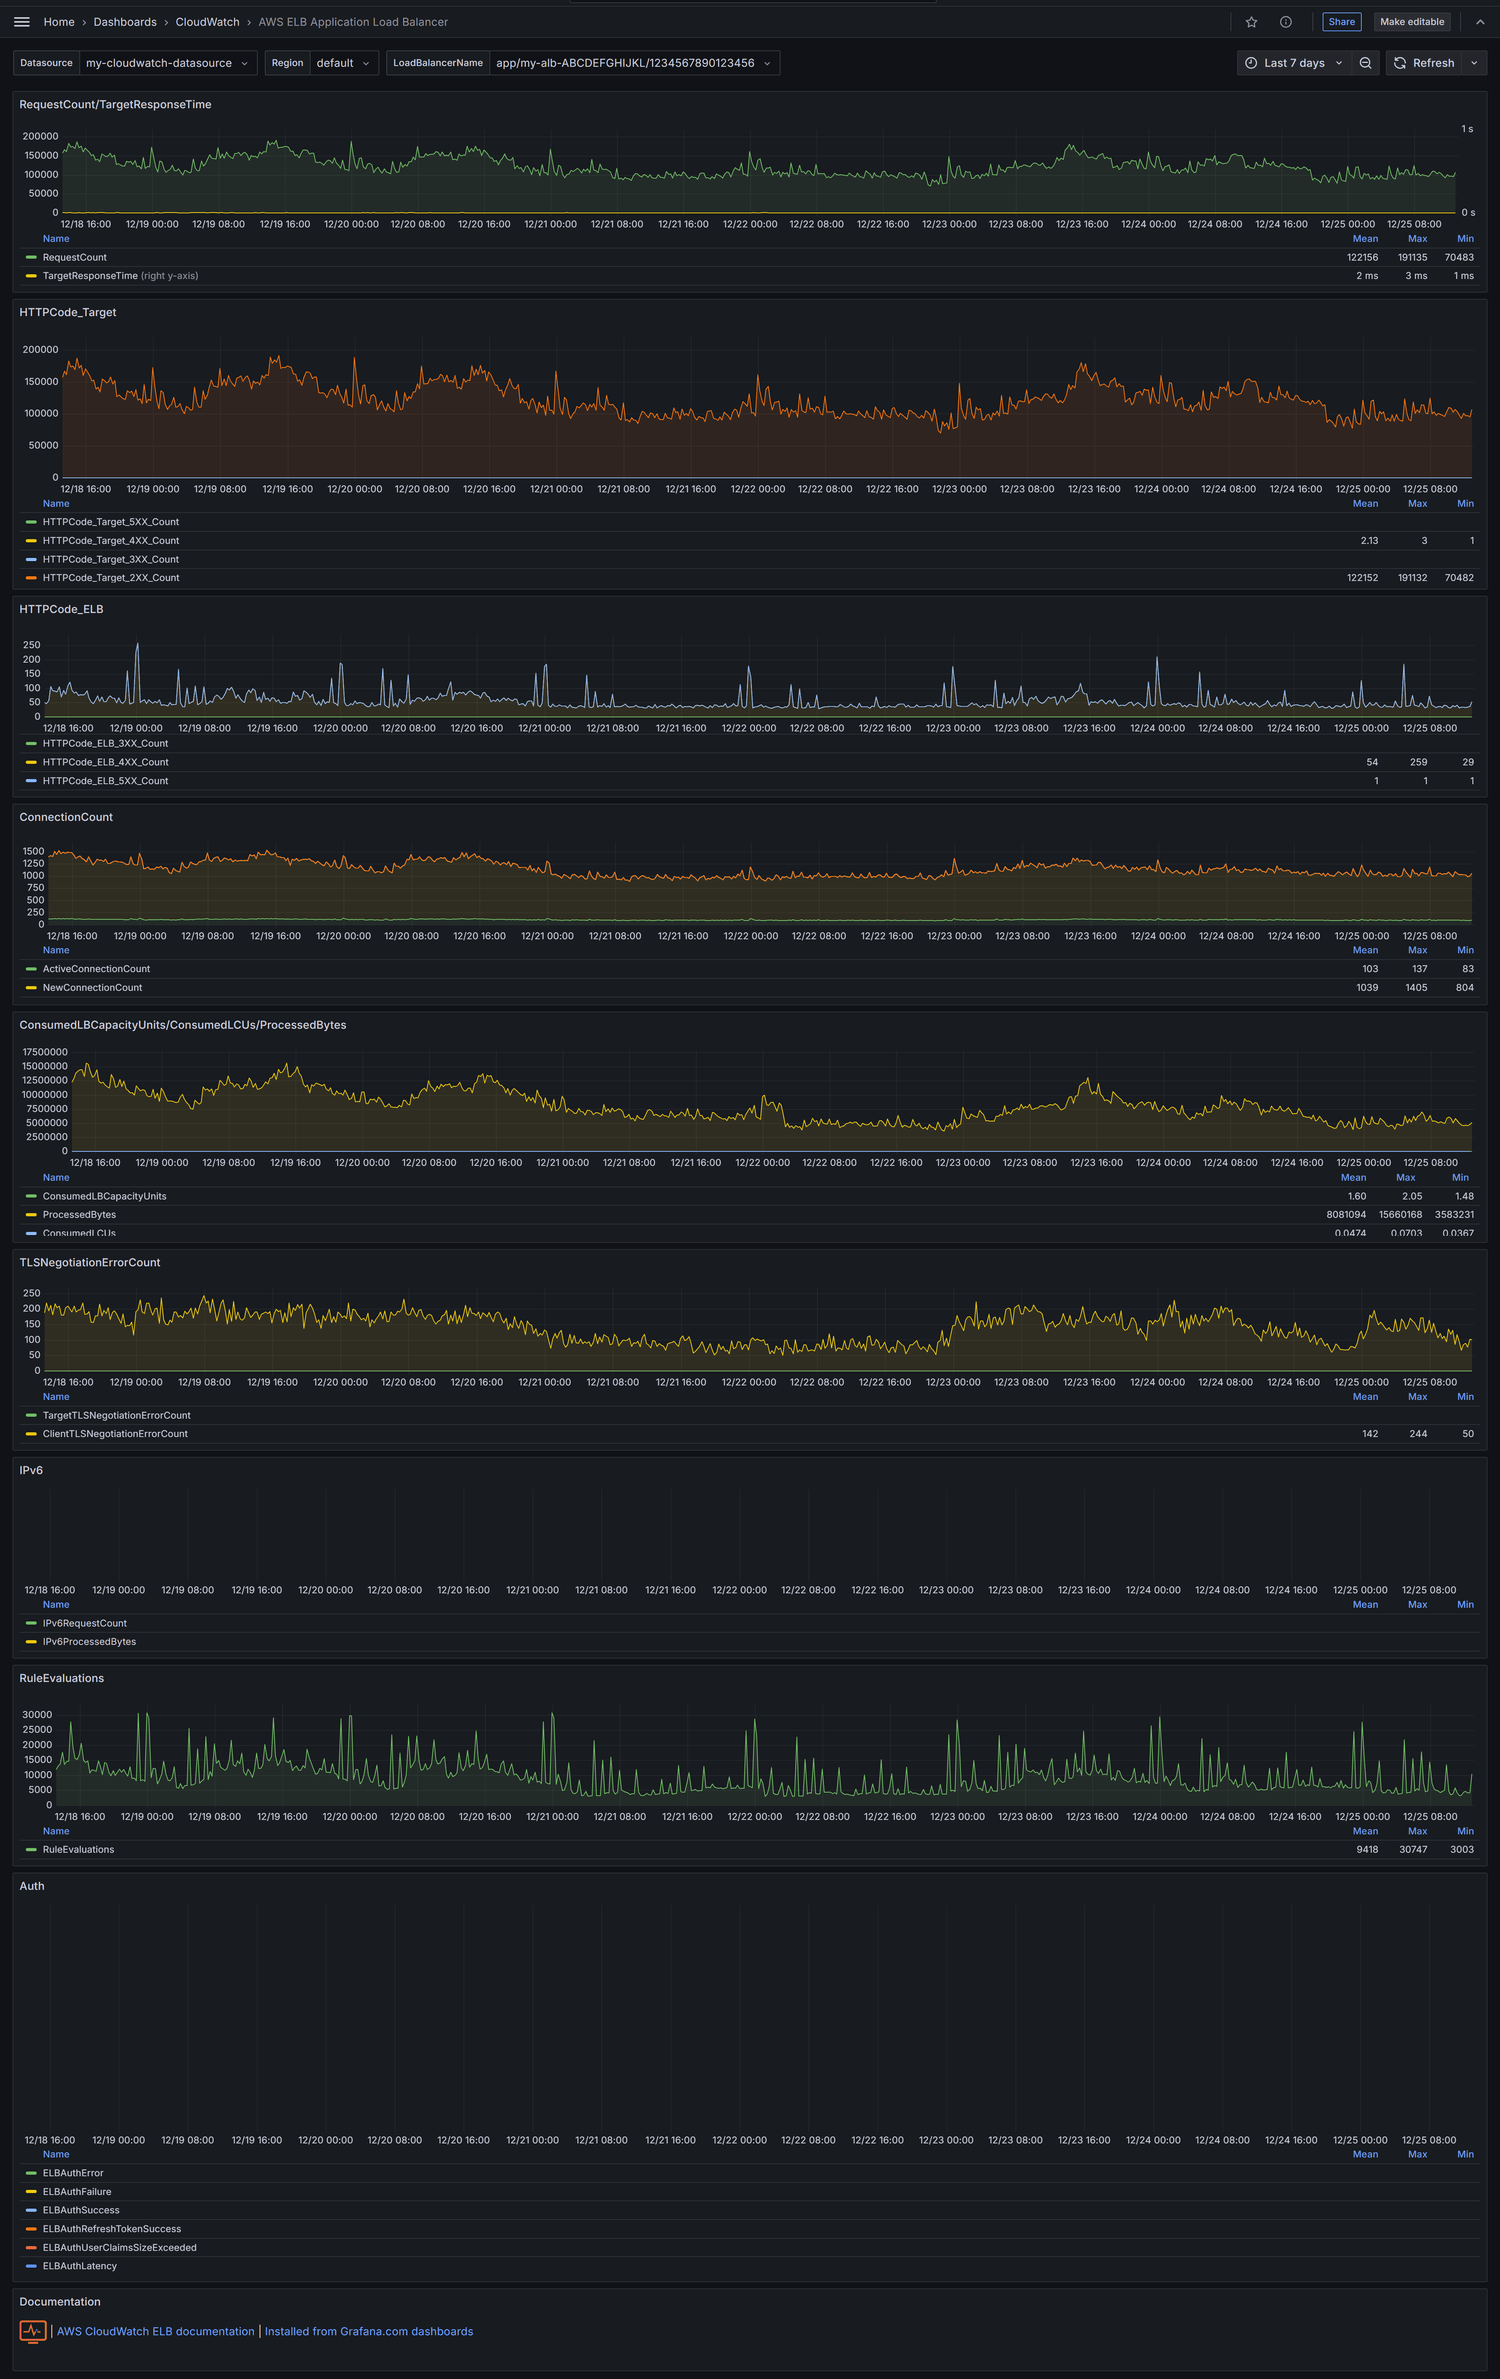
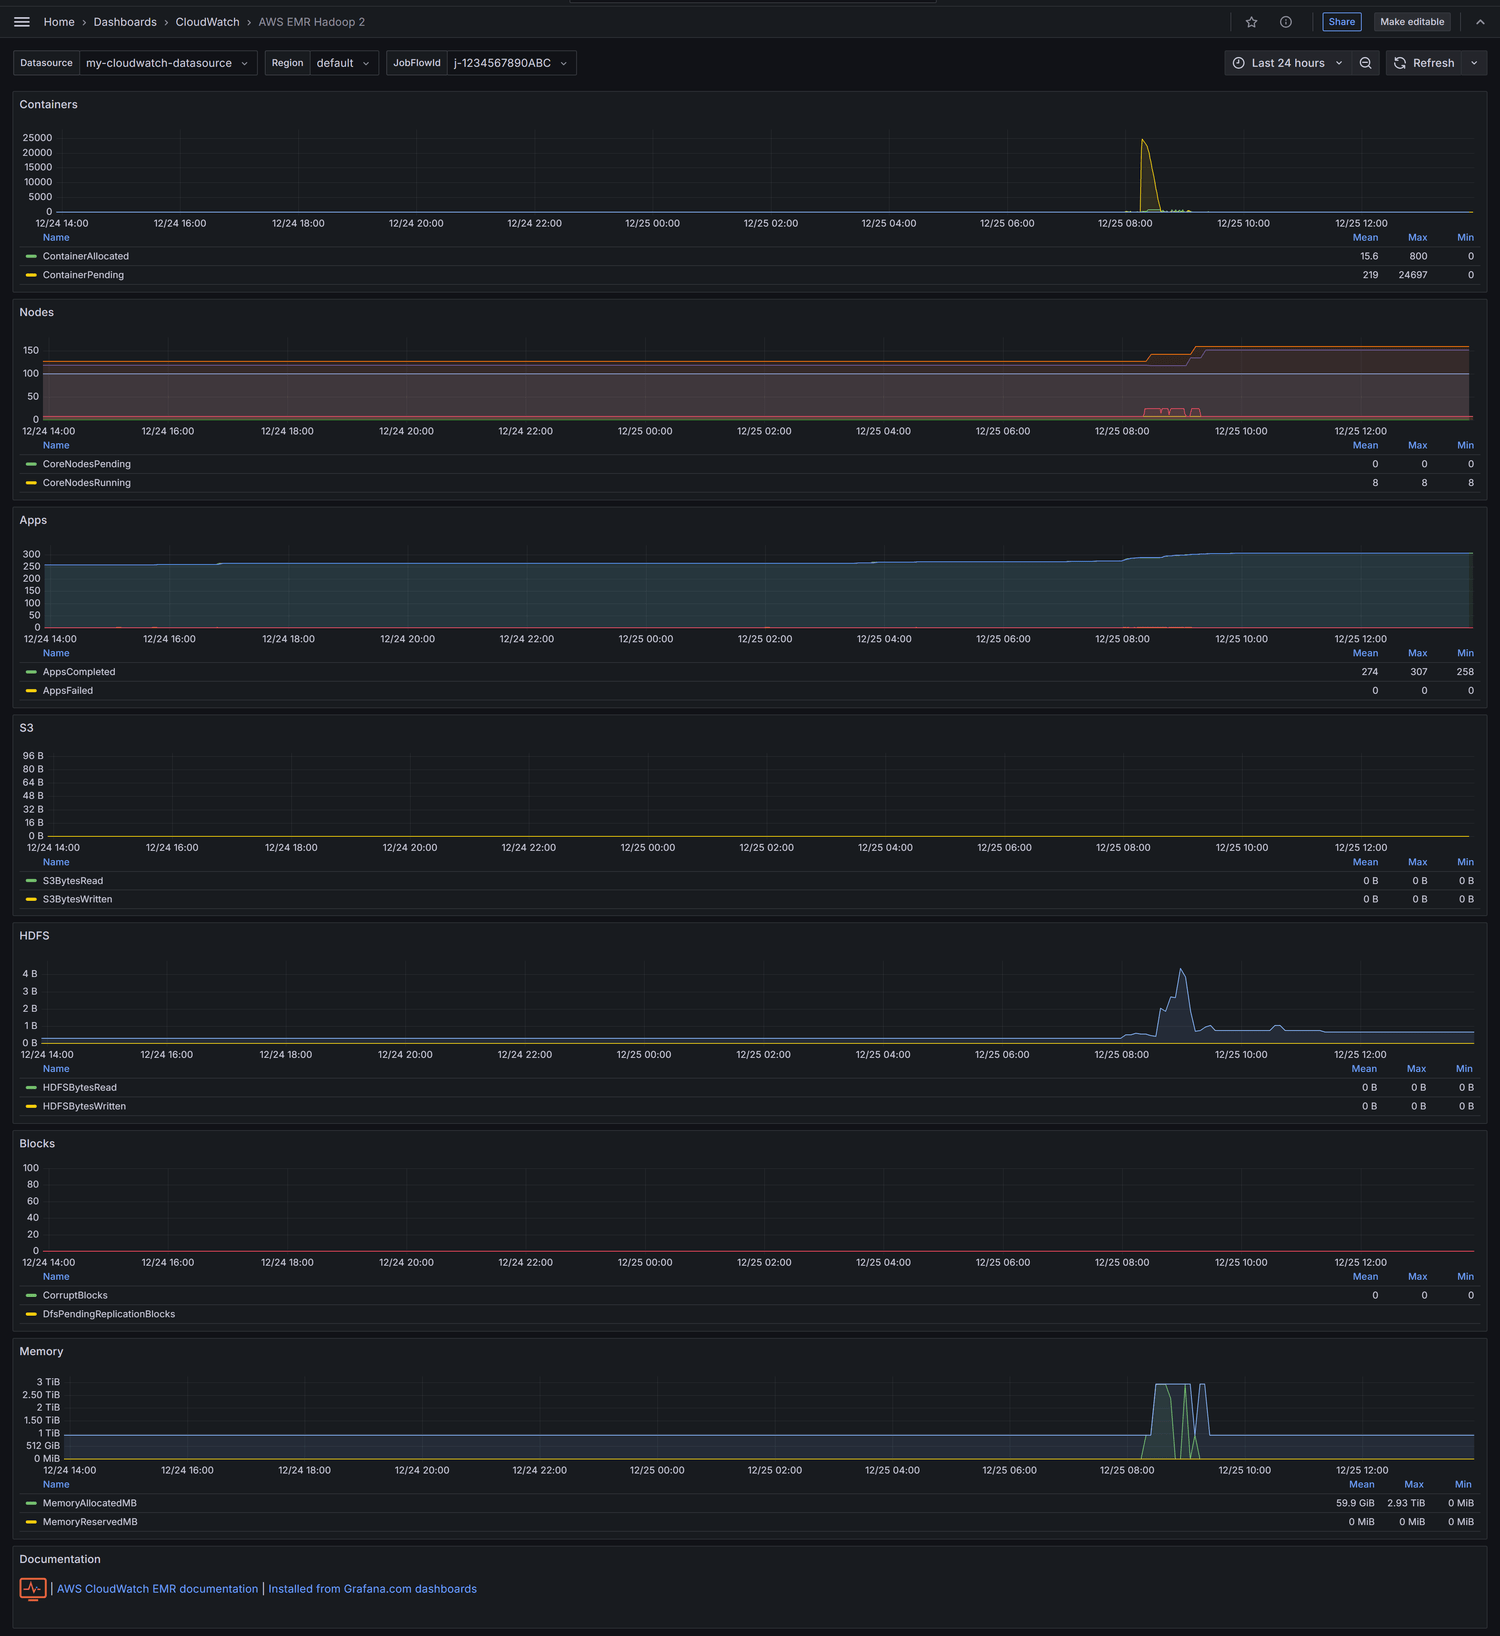
git clone https://github.com/monitoringartist/grafana-aws-cloudwatch-dashboards.gitmonitoringartist/grafana-aws-cloudwatch-dashboardsSet of AWS Grafana dashboards published on grafana.com - 10M+ downloads.
Doc:
Feel free to create pull request for additional AWS resources/printscreens/...
Please set your dashboard variables (Region, ...) after dashboard import.
Empty dashboard variables are reason of initial "Unable to call AWS API" or "Metric request error" error.
Import all Monitoring Artist AWS dashboards in one go (example script,
bash/curl/jq required):
#!/bin/bash
jq --version >/dev/null 2>&1 || { echo >&2 "I require jq but it's not installed. Aborting."; exit 1; }
### Please edit grafana_* variables to match your Grafana setup:
grafana_host="http://localhost:3000"
grafana_cred="admin:admin"
# Keep grafana_folder empty for adding the dashboards in "General" folder
grafana_folder="AWS CloudWatch"
ds=(1516 677 139 674 659 758 623 617 551 653 969 650 644 607 593 707 575 1519 581 584 2969 8050 11099 11154 11155 12979 13018 13040 13104 13892 14189 14391 14392 14954 14955 15016 16899 17741 17978 20007 20008 20009 20144);
folderId=$(curl -s -k -u "$grafana_cred" $grafana_host/api/folders | jq -r --arg grafana_folder  "$grafana_folder" '.[] | select(.title==$grafana_folder).id')
if [ -z "$folderId" ] ; then echo "Didn't get folderId" ; else echo "Got folderId $folderId" ; fi
for d in "${ds[@]}"; do
  echo -n "Processing $d: "
  j=$(curl -s -k -u "$grafana_cred" $grafana_host/api/gnet/dashboards/$d | jq .json)
  payload="{\"dashboard\":$j,\"overwrite\":true"
  if [ ! -z "$folderId" ] ; then payload="${payload}, \"folderId\": $folderId }";  else payload="${payload} }" ; fi
  curl -s -k -u "$grafana_cred" -XPOST -H "Accept: application/json" \
    -H "Content-Type: application/json" \
    -d "$payload" \
    $grafana_host/api/dashboards/import; echo ""
done
Use AWS Policy Generator, which fits your needs. Example of minimal IAM role for Grafana (CloudWatch + EC2 metrics):
{
    "Version": "2012-10-17",
    "Statement": [
        {
            "Sid": "AllowReadingMetricsFromCloudWatch",
            "Effect": "Allow",
            "Action": [
                "cloudwatch:DescribeAlarmsForMetric",
                "cloudwatch:DescribeAlarmHistory",
                "cloudwatch:DescribeAlarms",
                "cloudwatch:ListMetrics",
                "cloudwatch:GetMetricStatistics",
                "cloudwatch:GetMetricData"
            ],
            "Resource": "*"
        },
        {
            "Sid": "AllowReadingTagsInstancesRegionsFromEC2",
            "Effect": "Allow",
            "Action": [
                "ec2:DescribeTags",
                "ec2:DescribeInstances",
                "ec2:DescribeRegions"
            ],
            "Resource": "*"
        },
        {
            "Sid": "AllowReadingResourcesForTags",
            "Effect" : "Allow",
            "Action" : "tag:GetResources",
            "Resource" : "*"
        }
    ]
}
See https://github.com/monitoringartist/grafana-cross-account-cloudwatch-access for AWS cross account access.
You can also install this project as a Jsonnet library with jsonnet-bundler:
$ jb install github.com/monitoringartist/grafana-aws-cloudwatch-dashboards
$ cat > aws-cloudwatch-dashboards.jsonnet <<EOF
local awsCloudWatch = import 'github.com/monitoringartist/grafana-aws-cloudwatch-dashboards/dashboards.libsonnet';

awsCloudWatch.grafanaDashboards
EOF
$ jsonnet -J vendor aws-cloudwatch-dashboards.jsonnet
Single click provisioning - login as
admin/admin and create CloudWatch datasource from your Access & secret key to see all dashboards with your data.
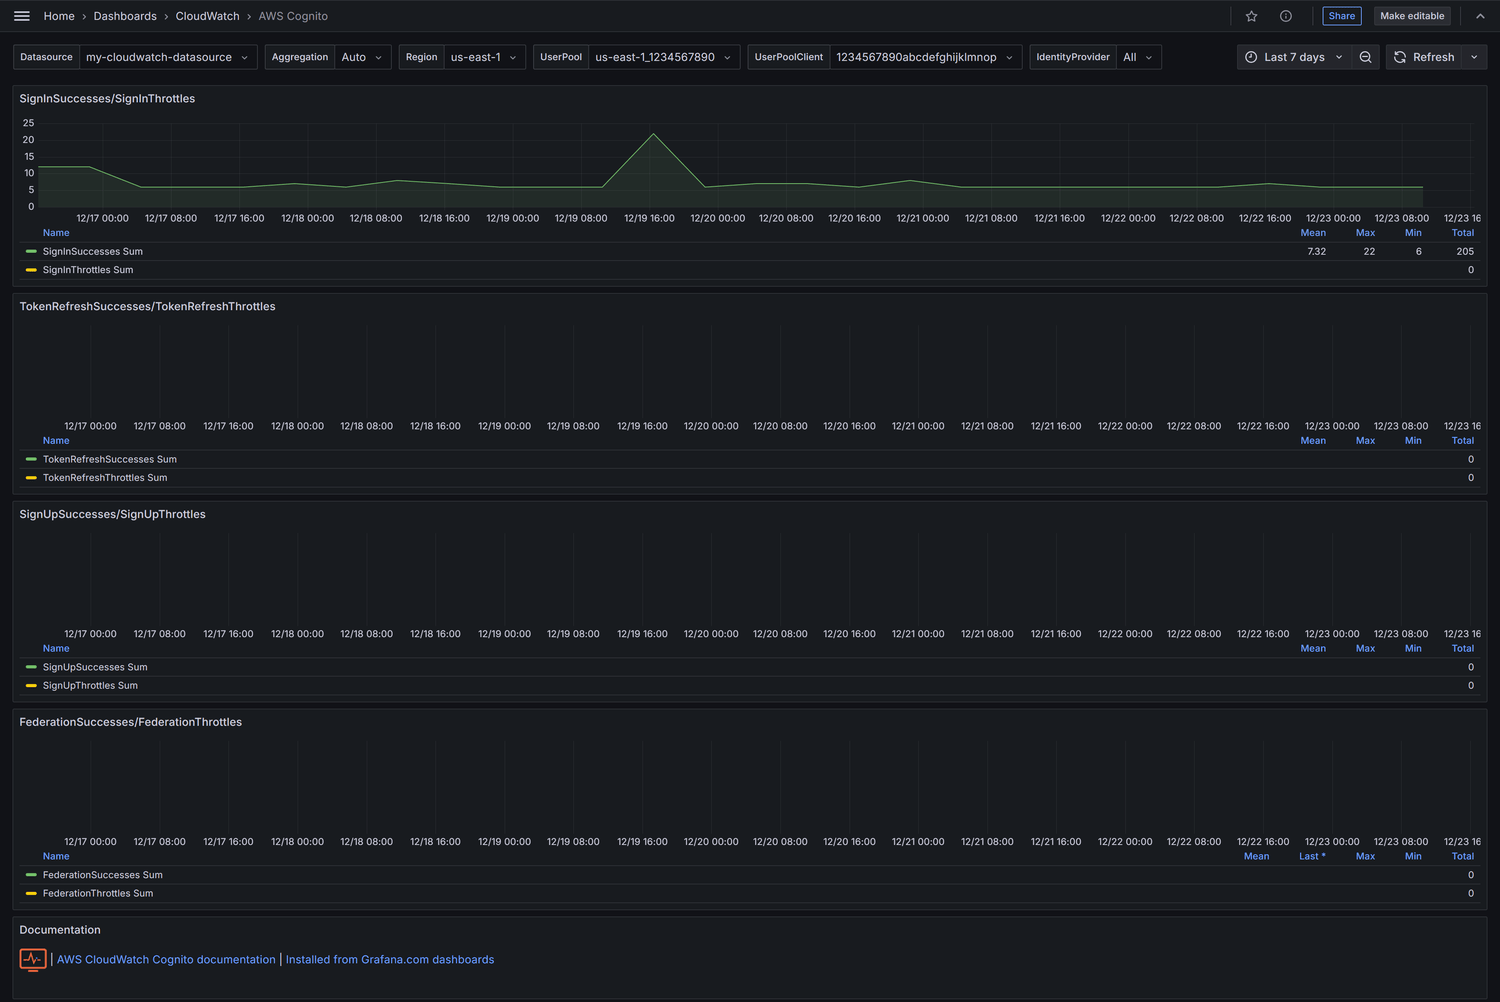
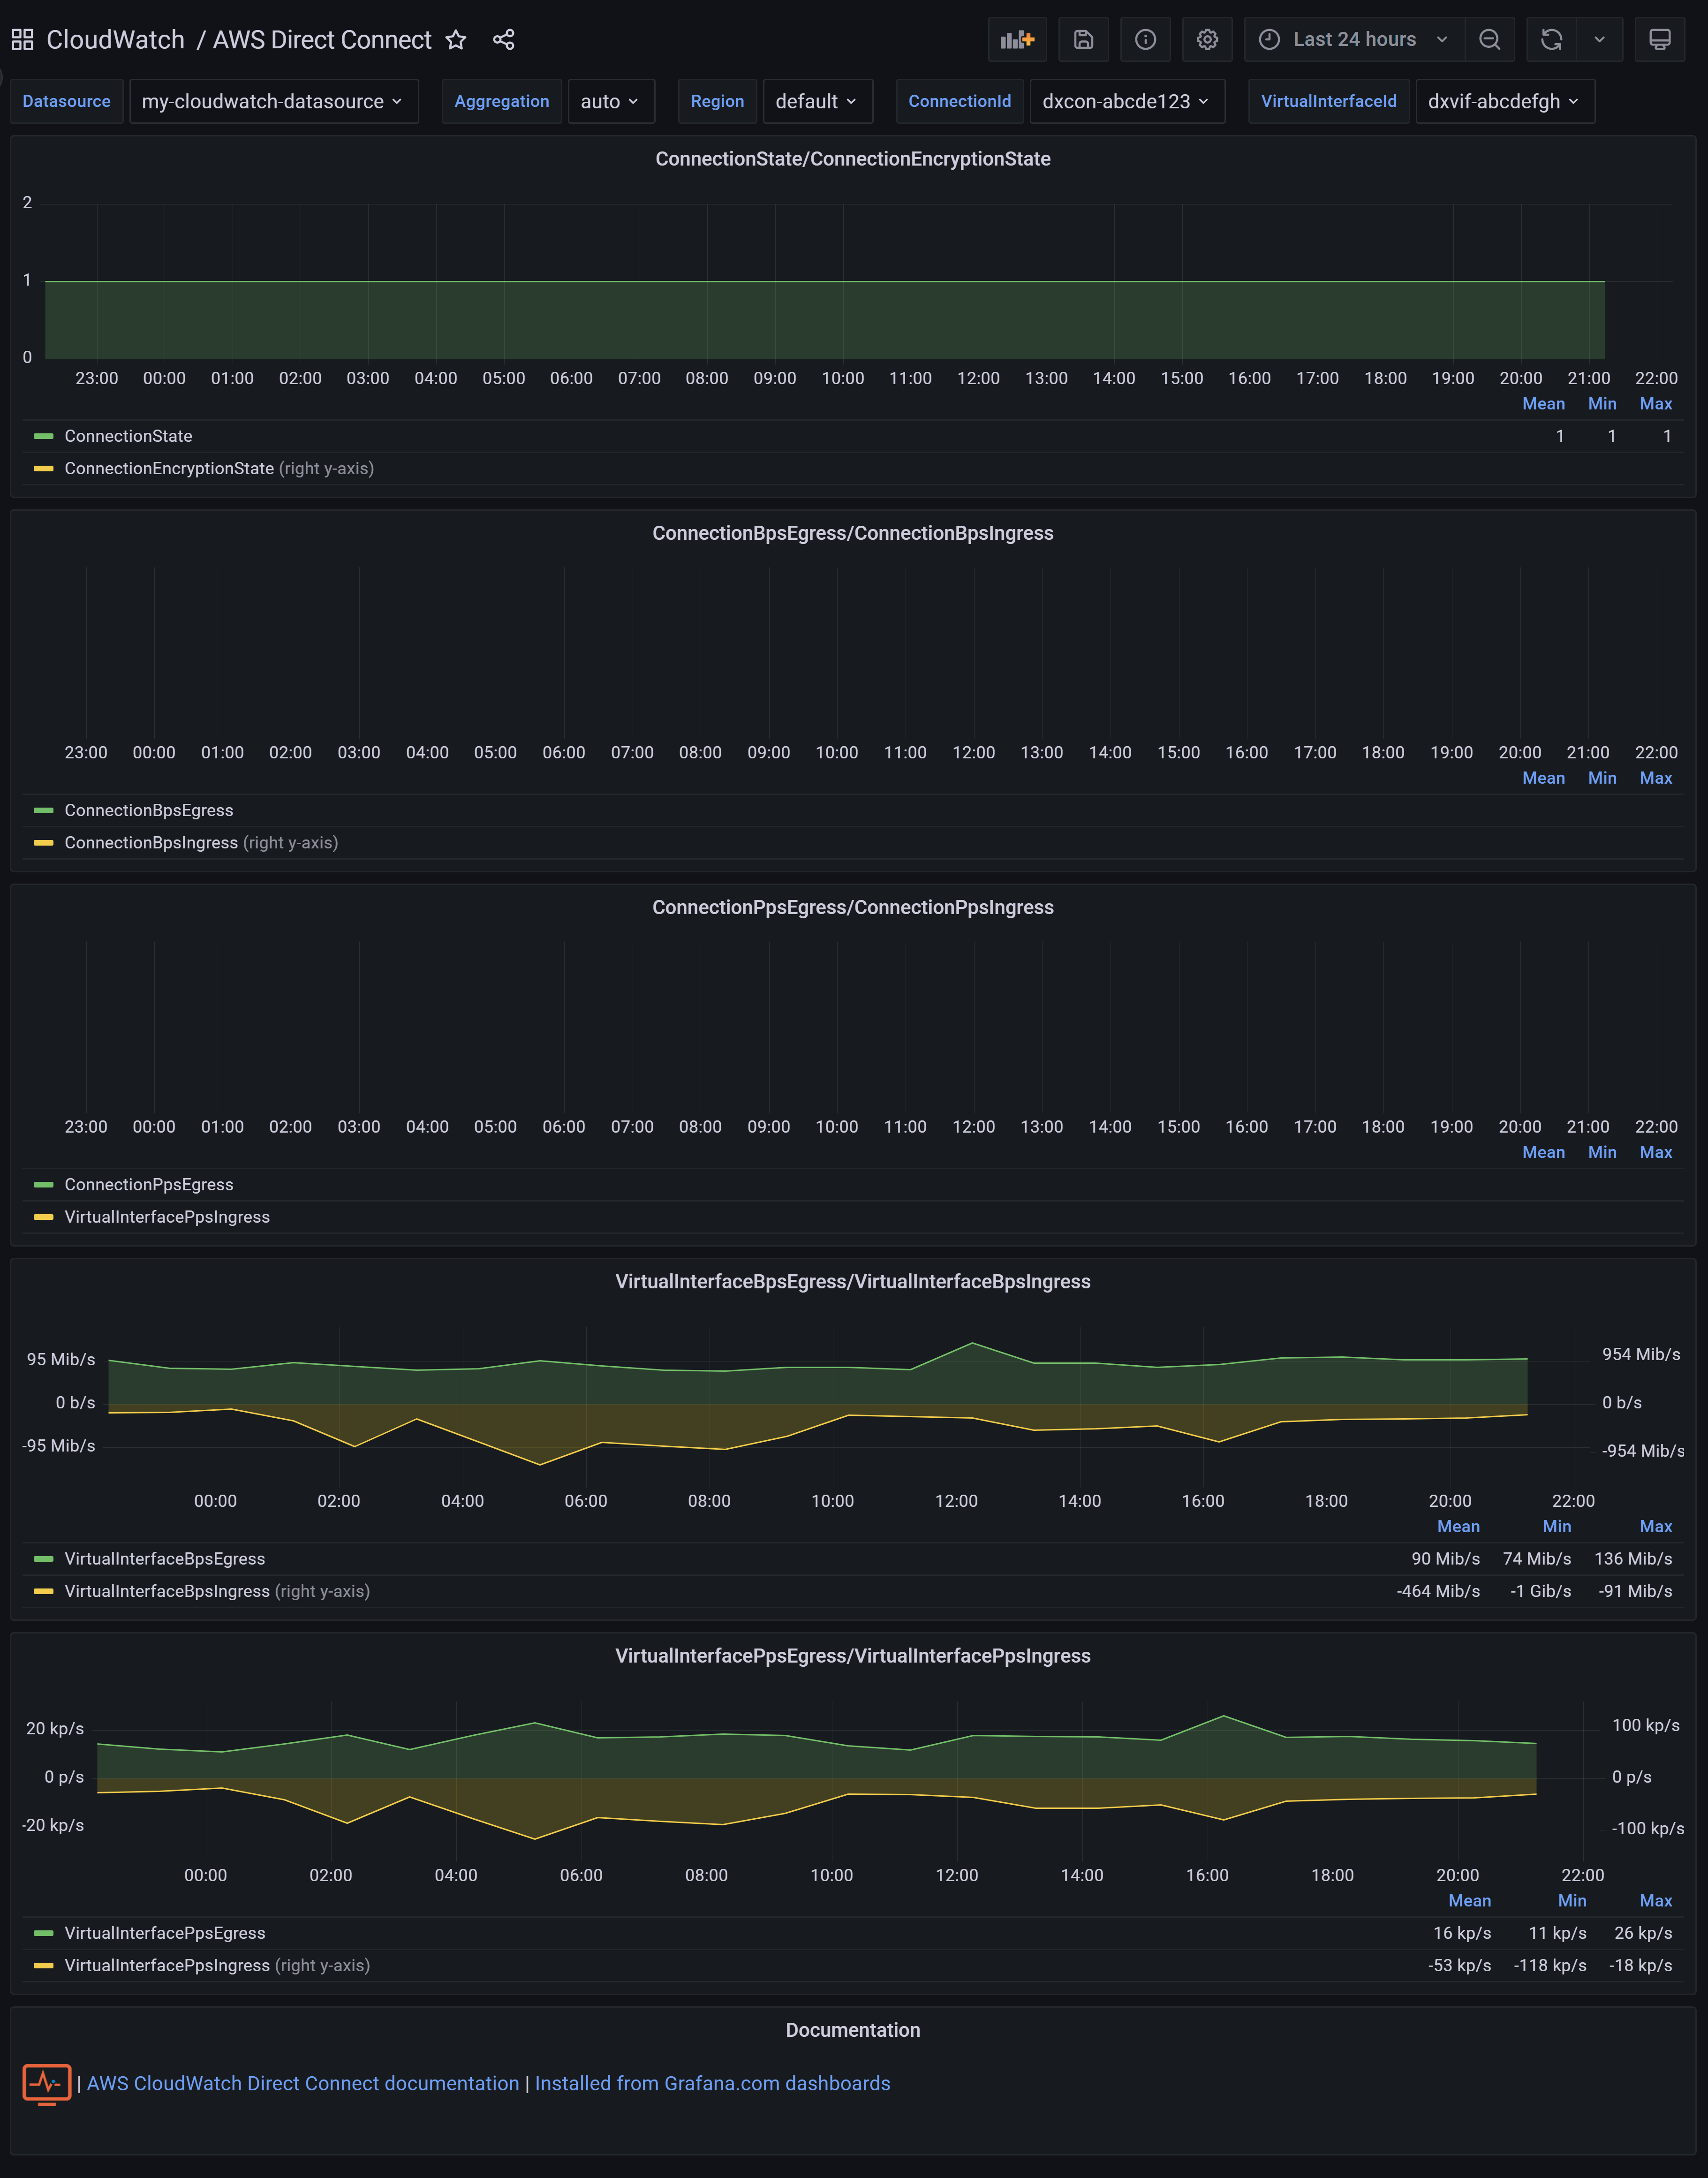
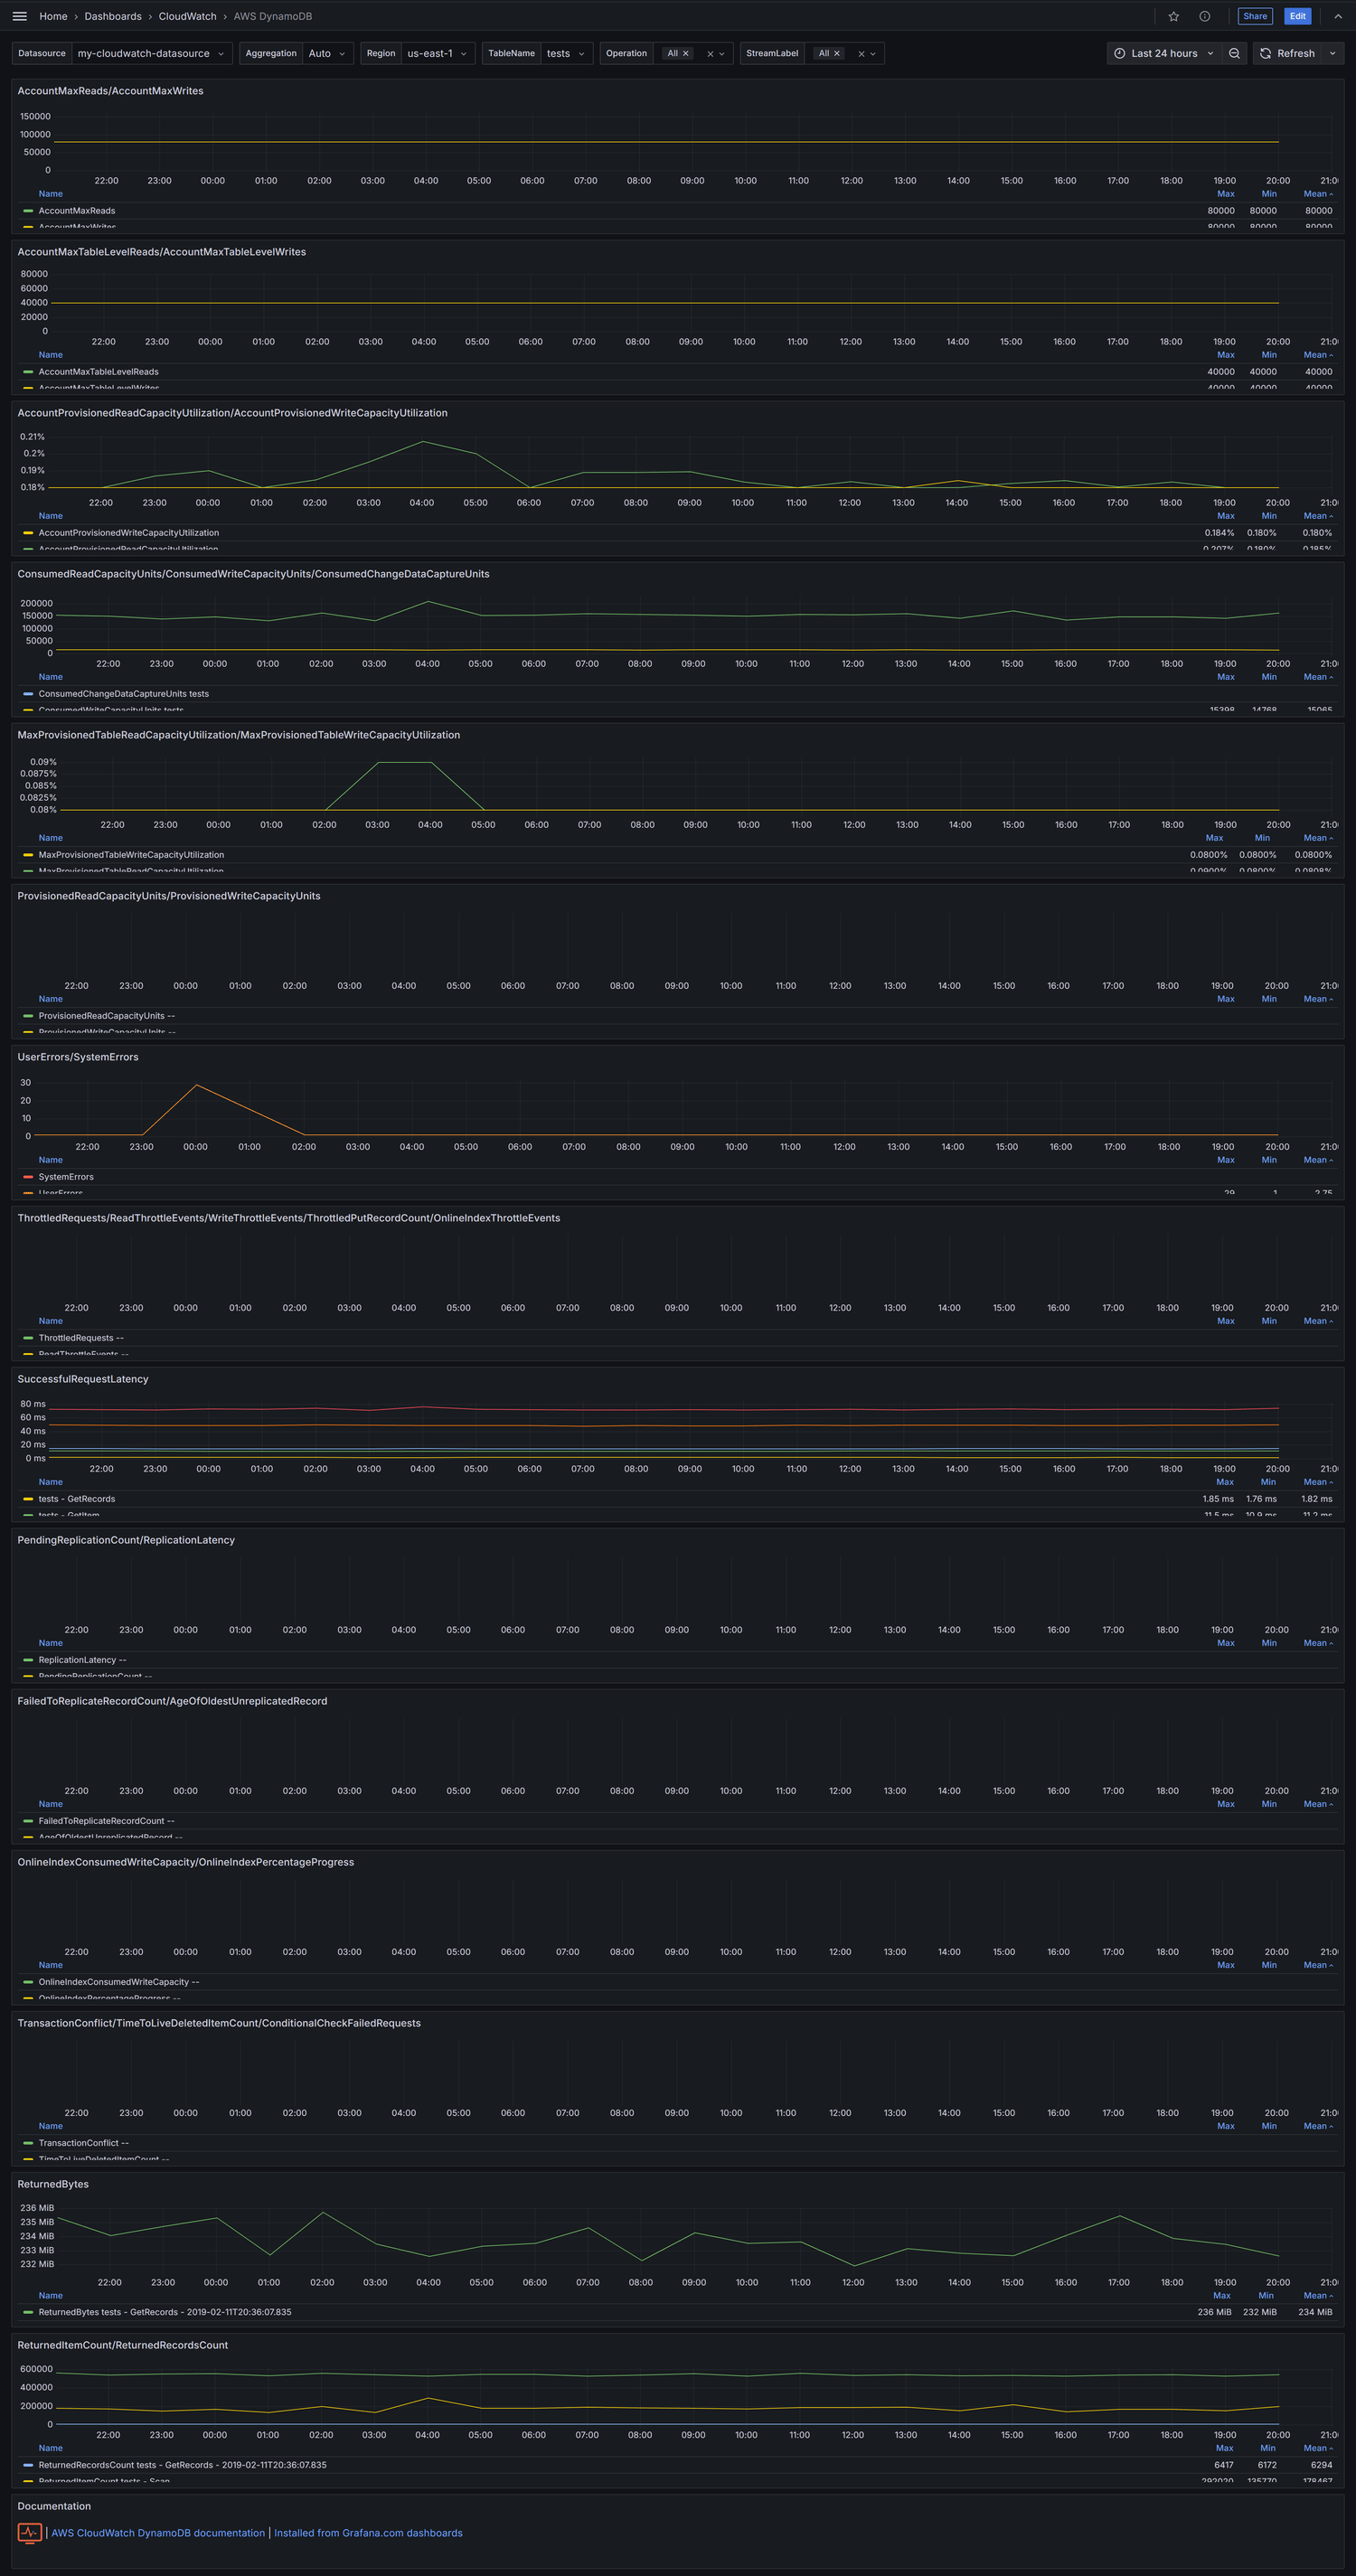
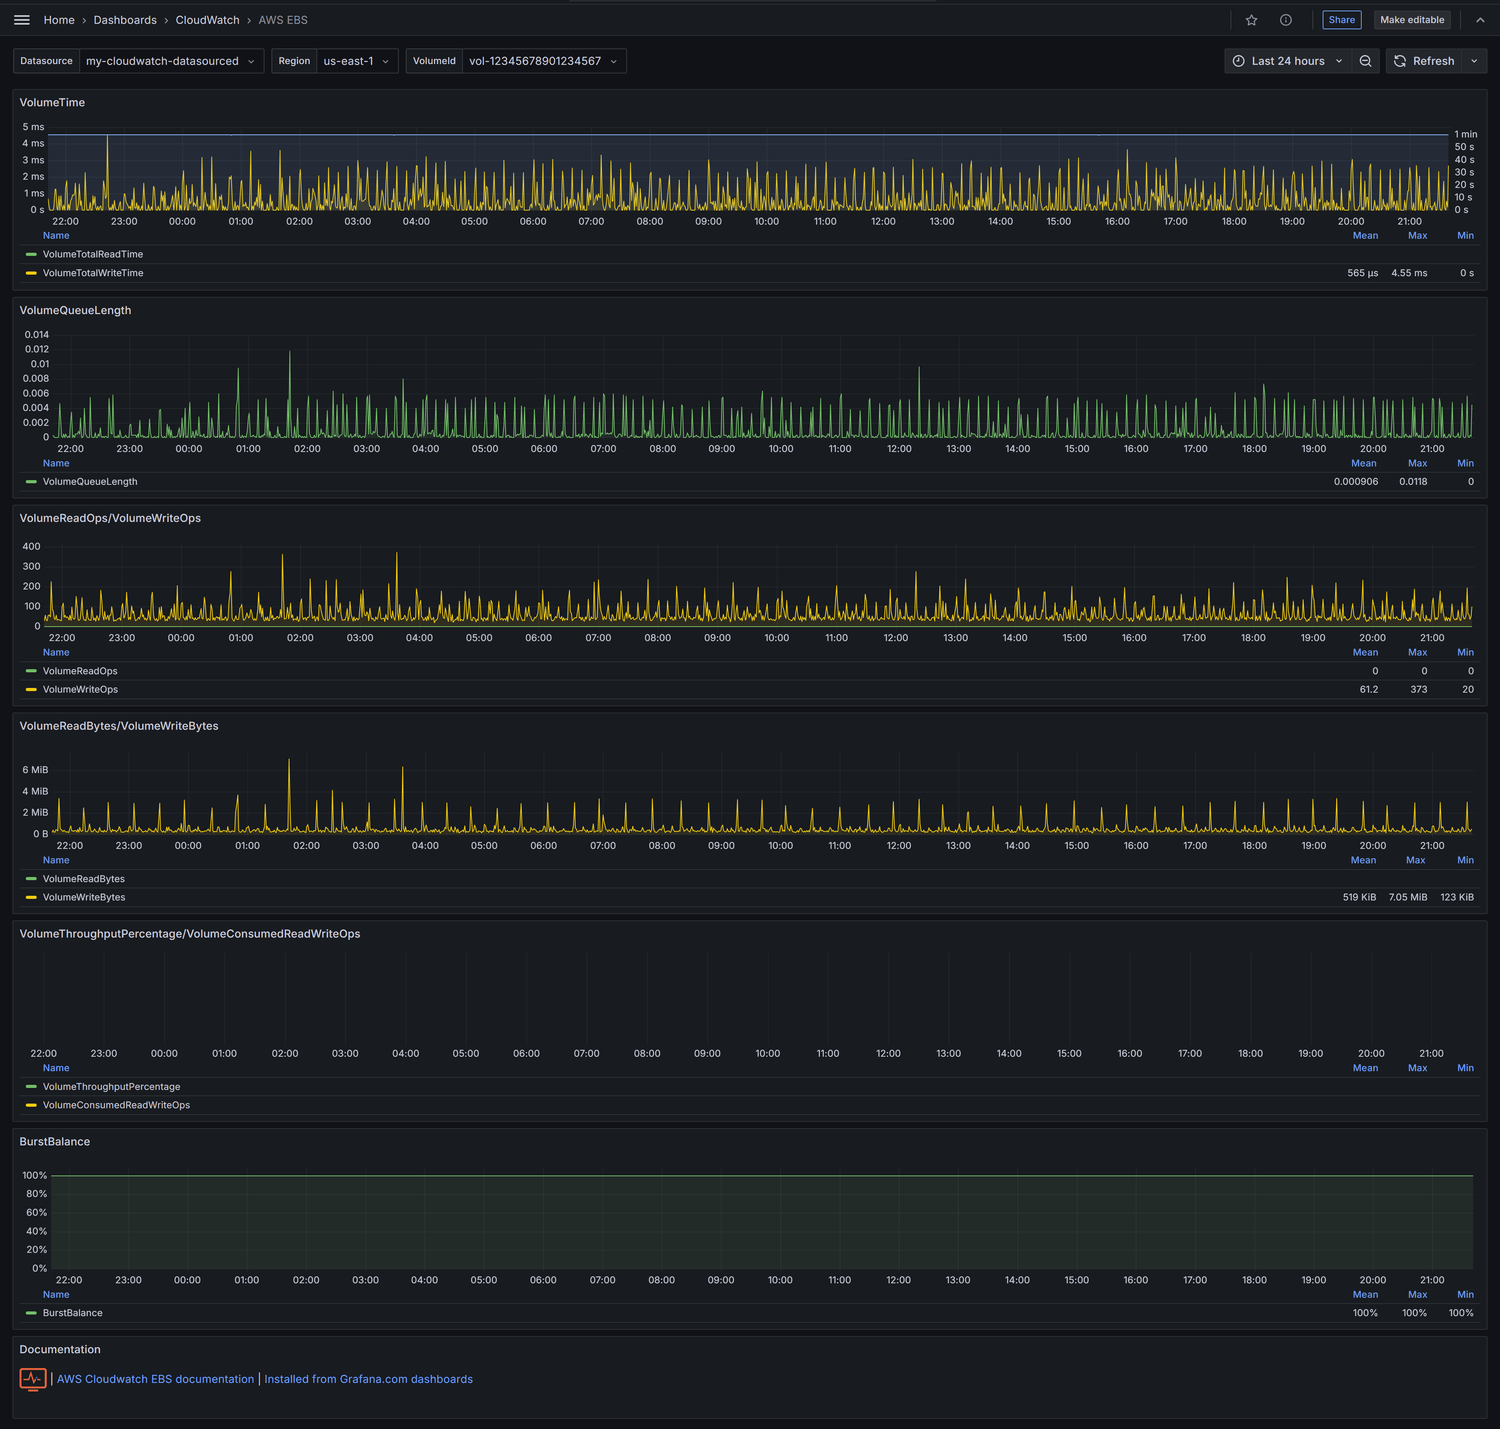
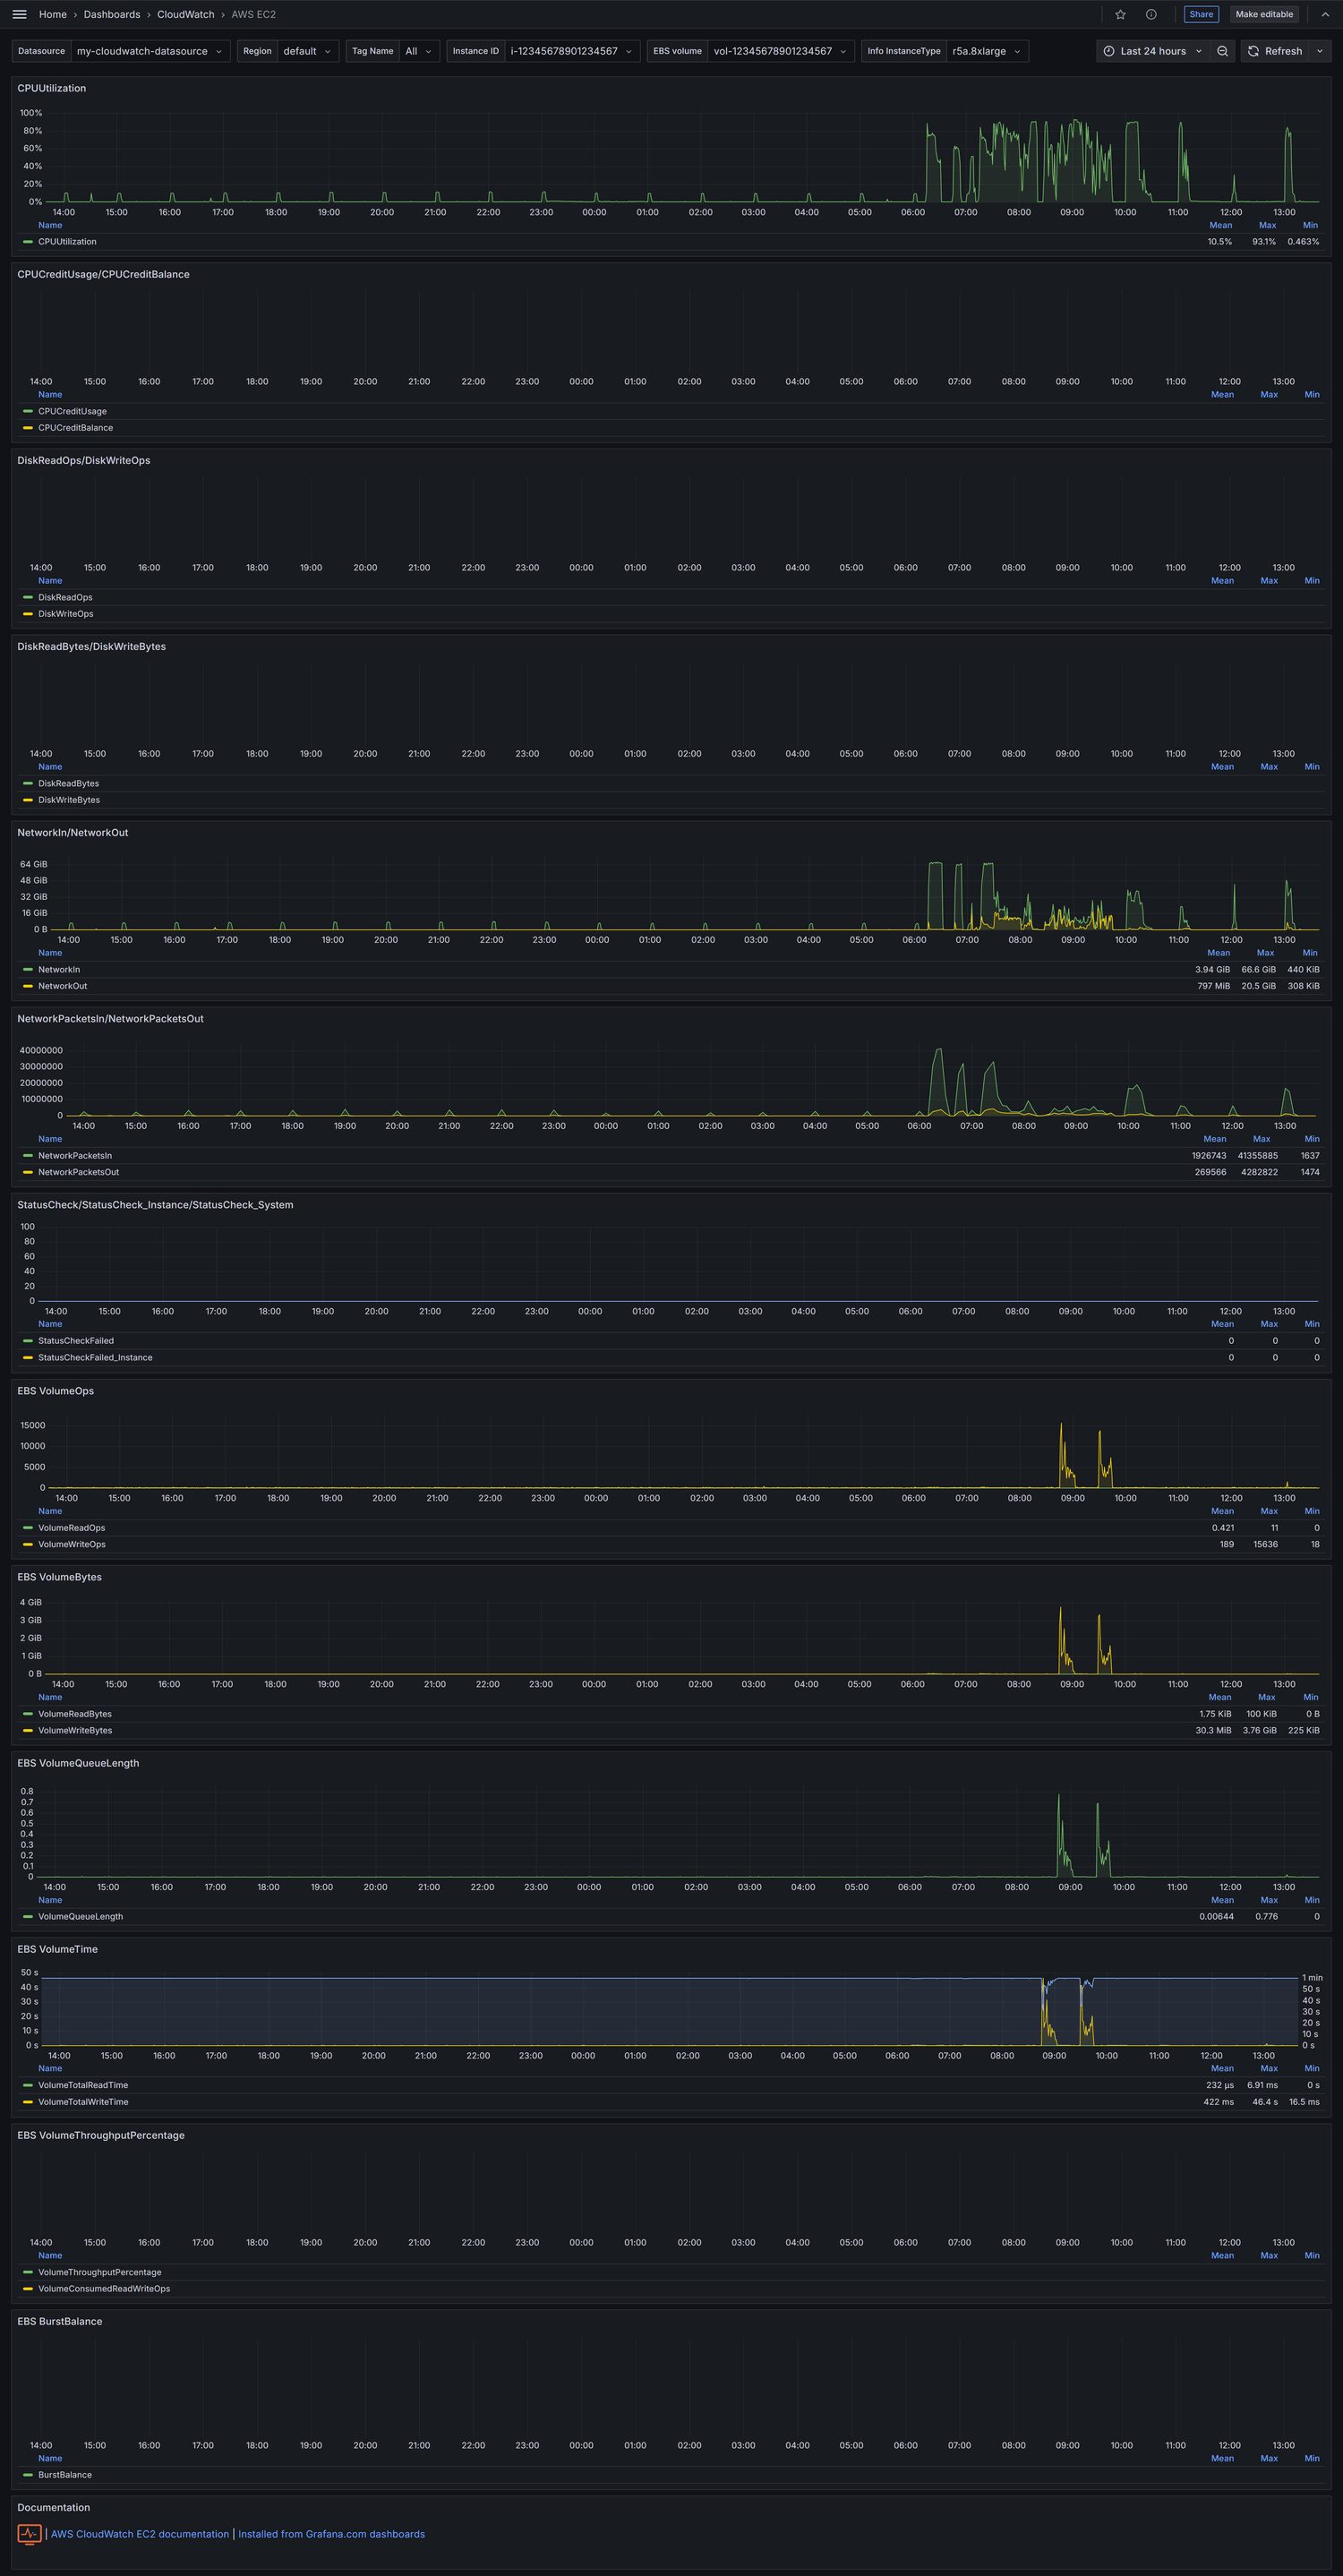
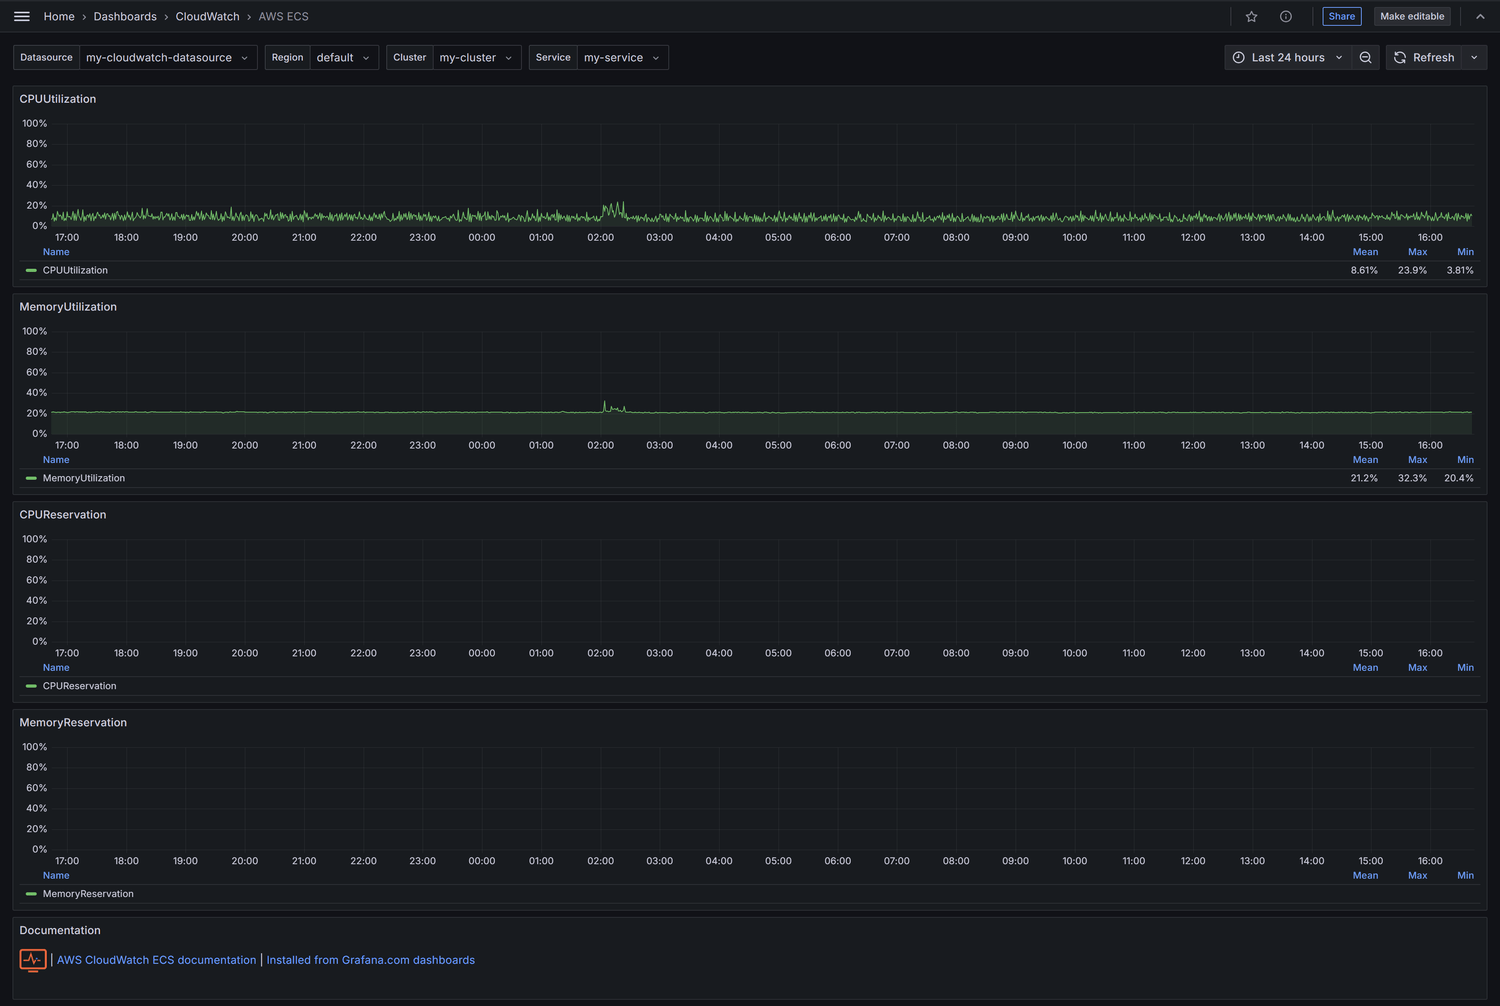
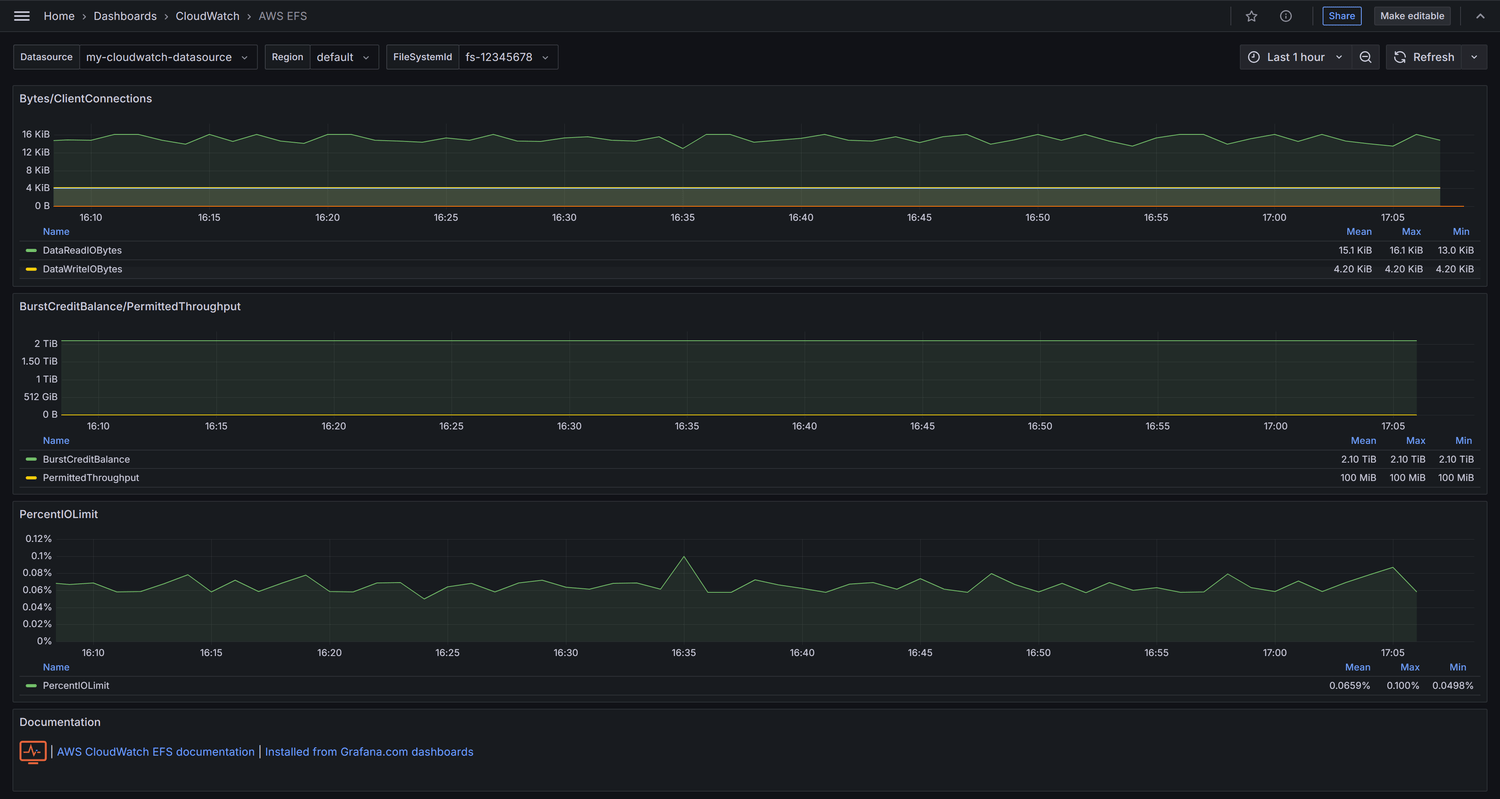
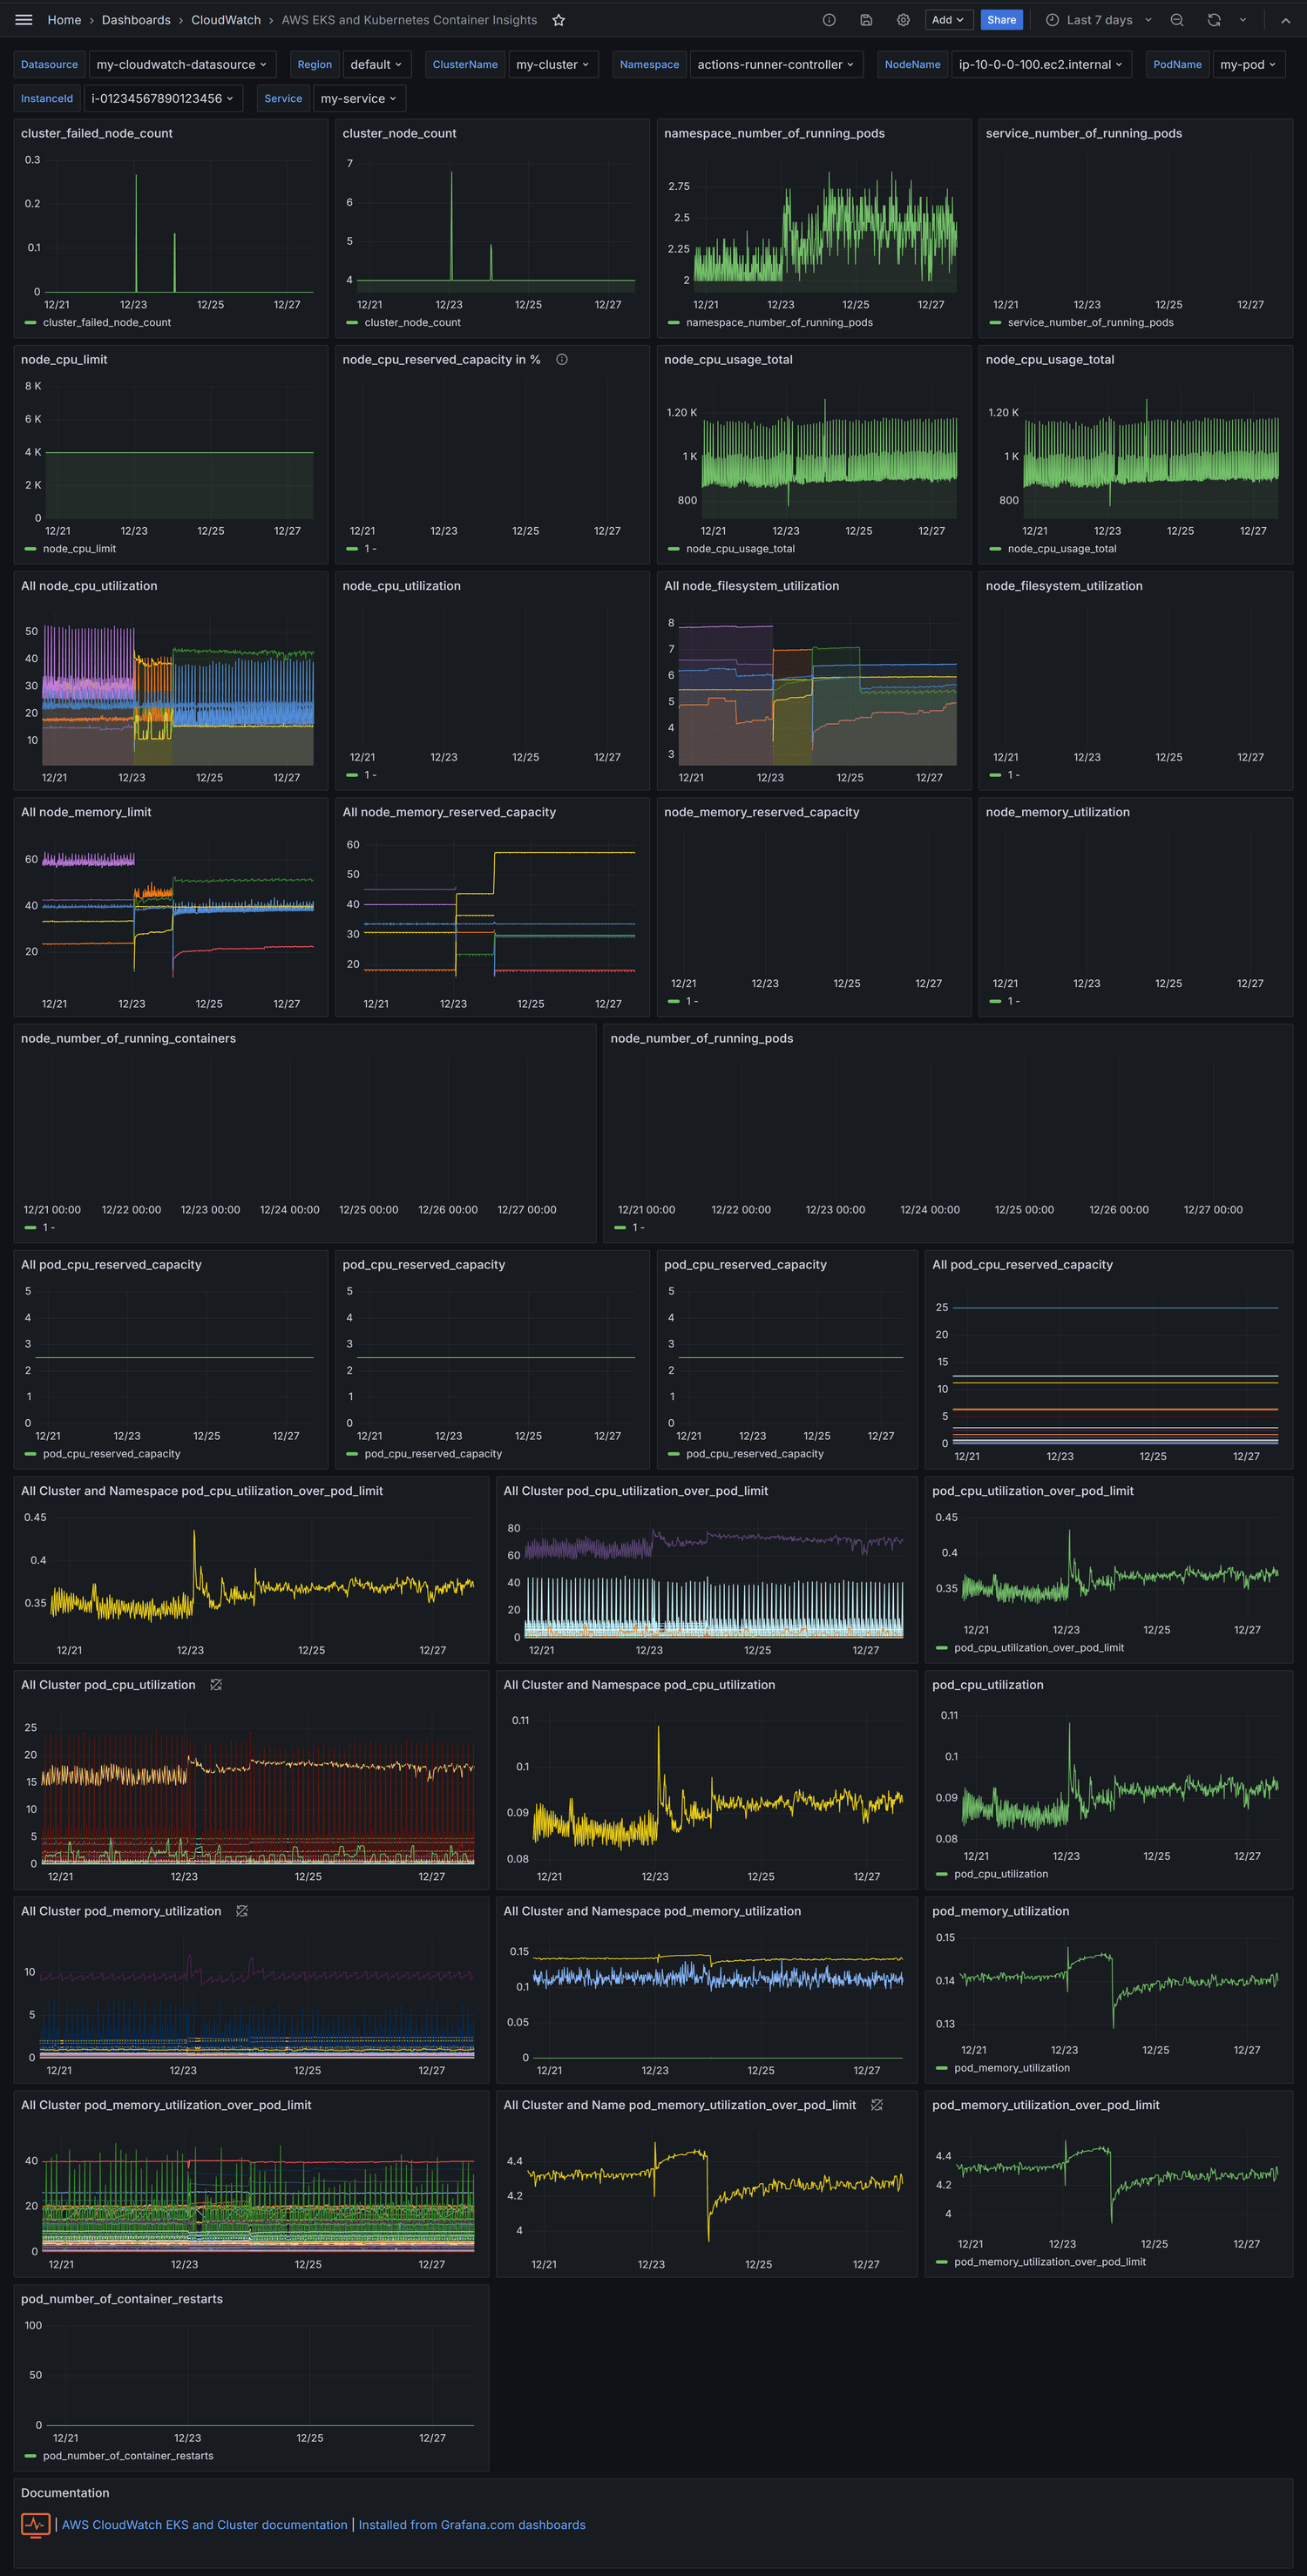
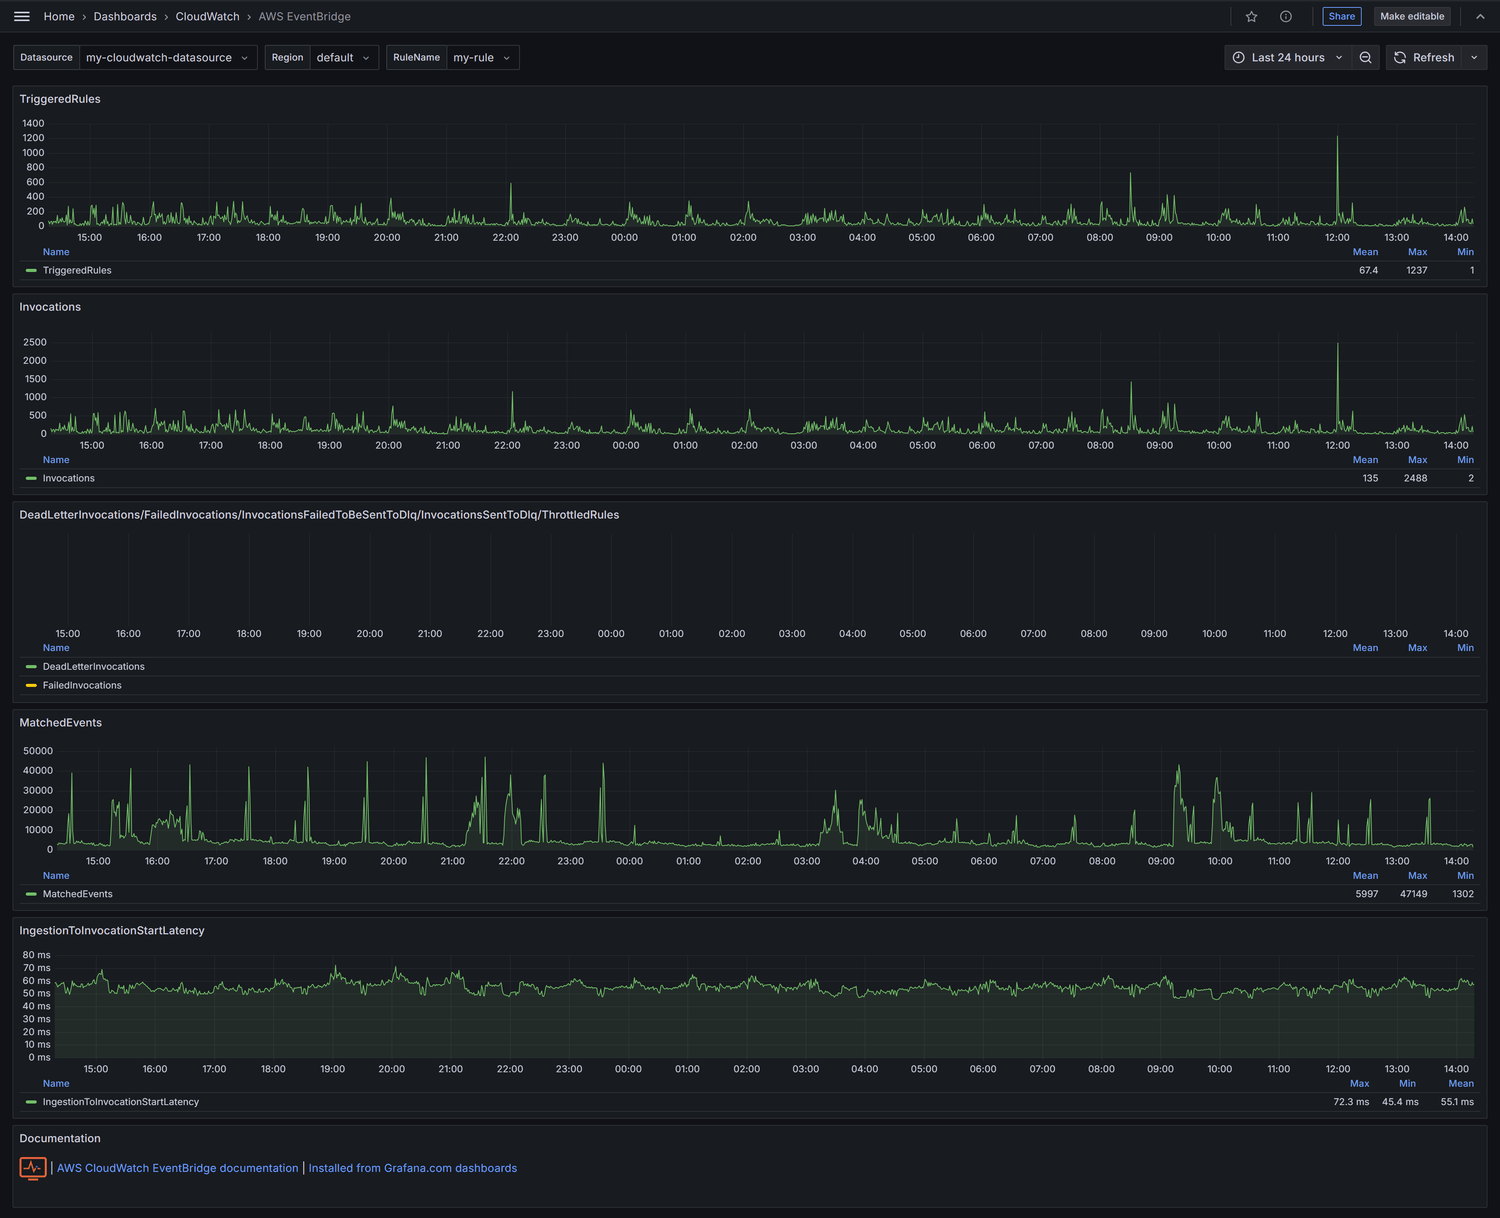
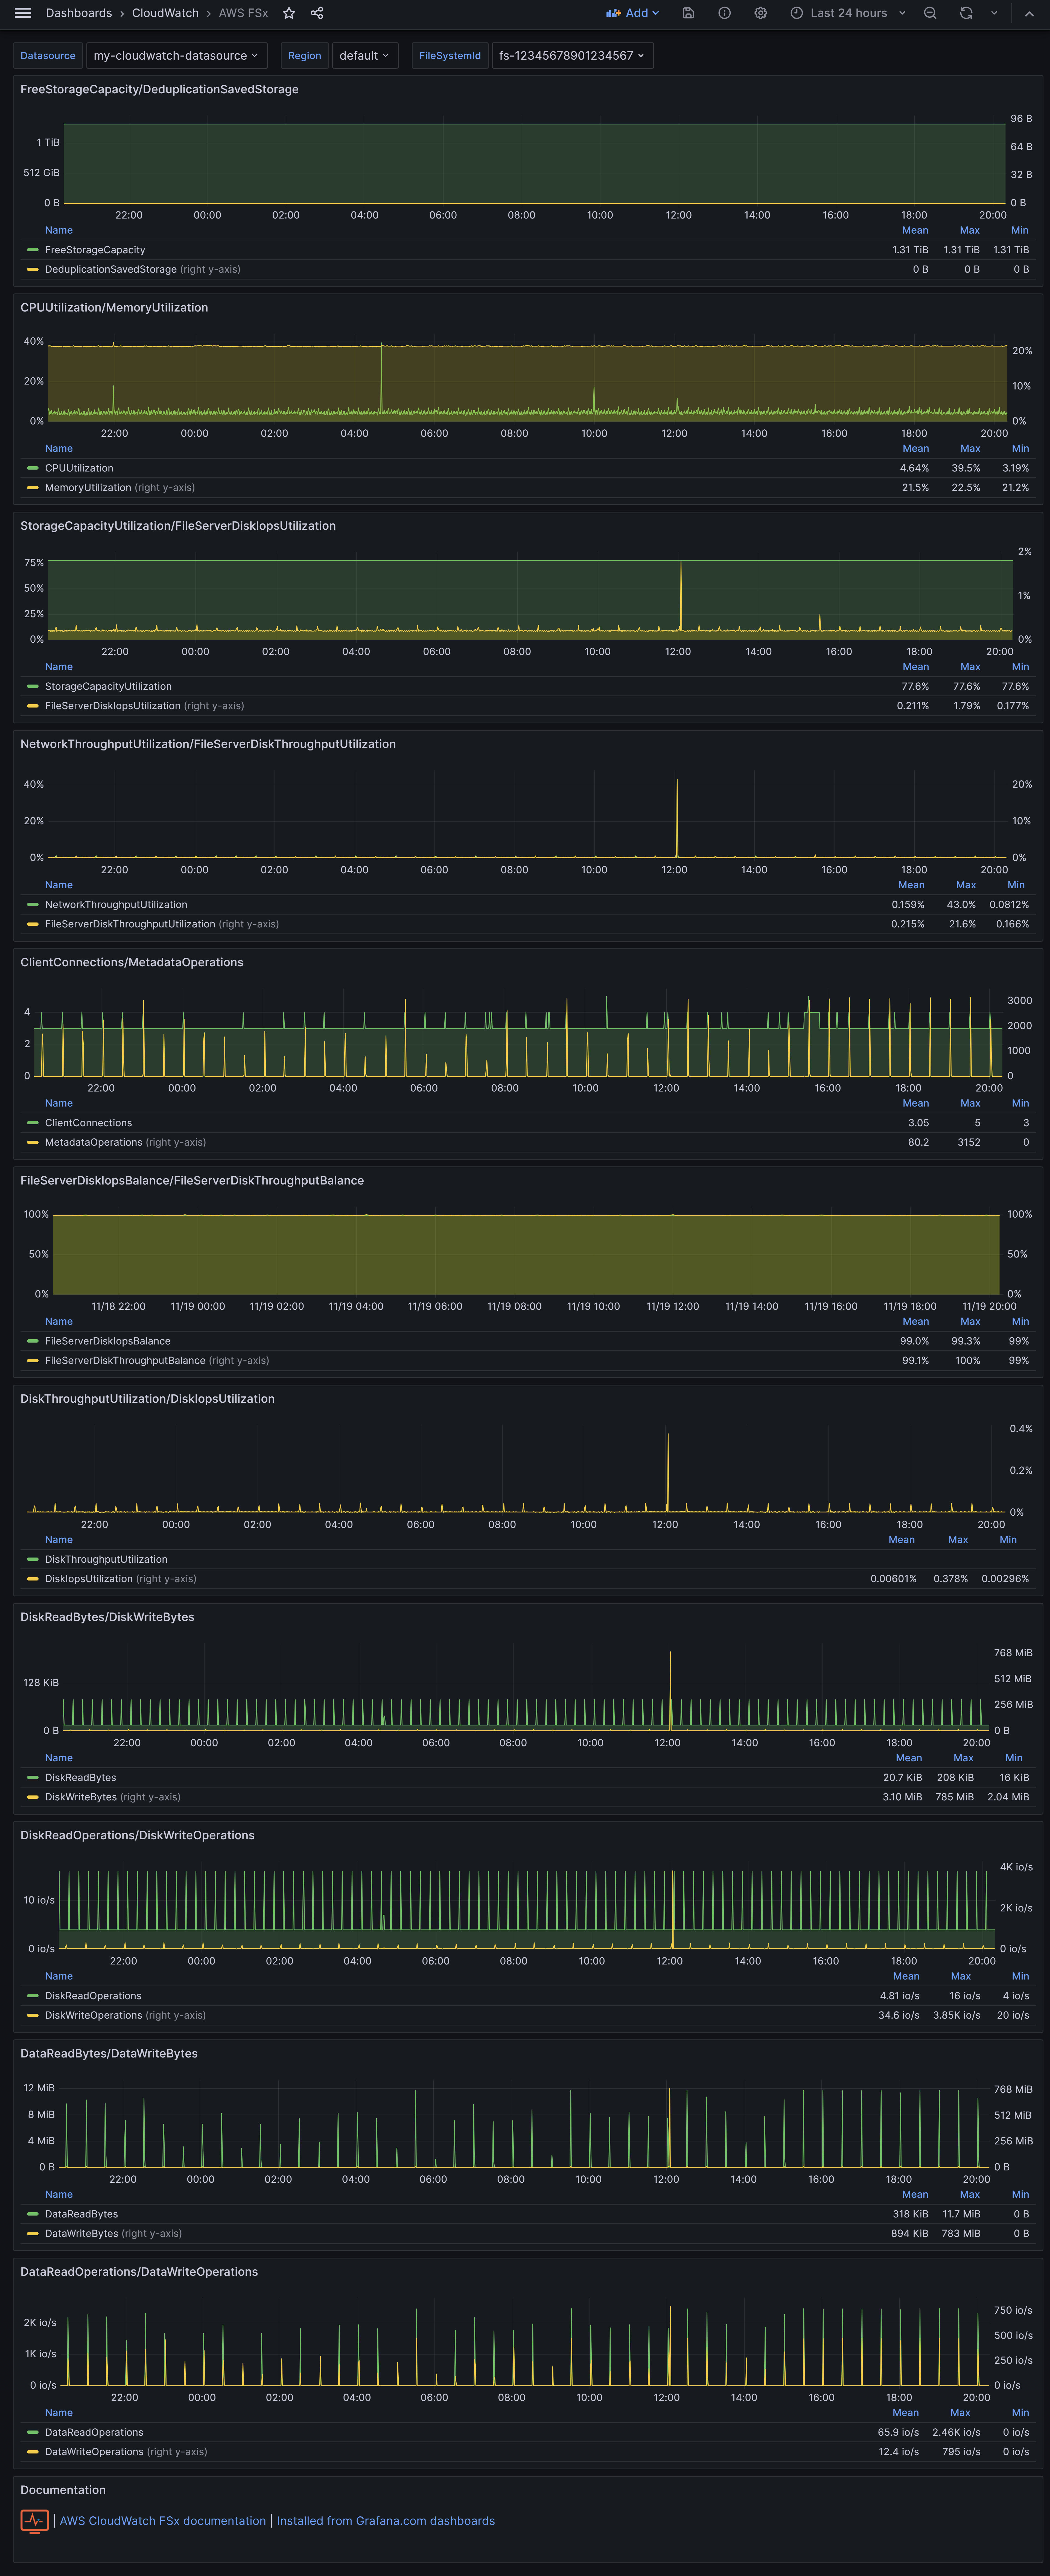
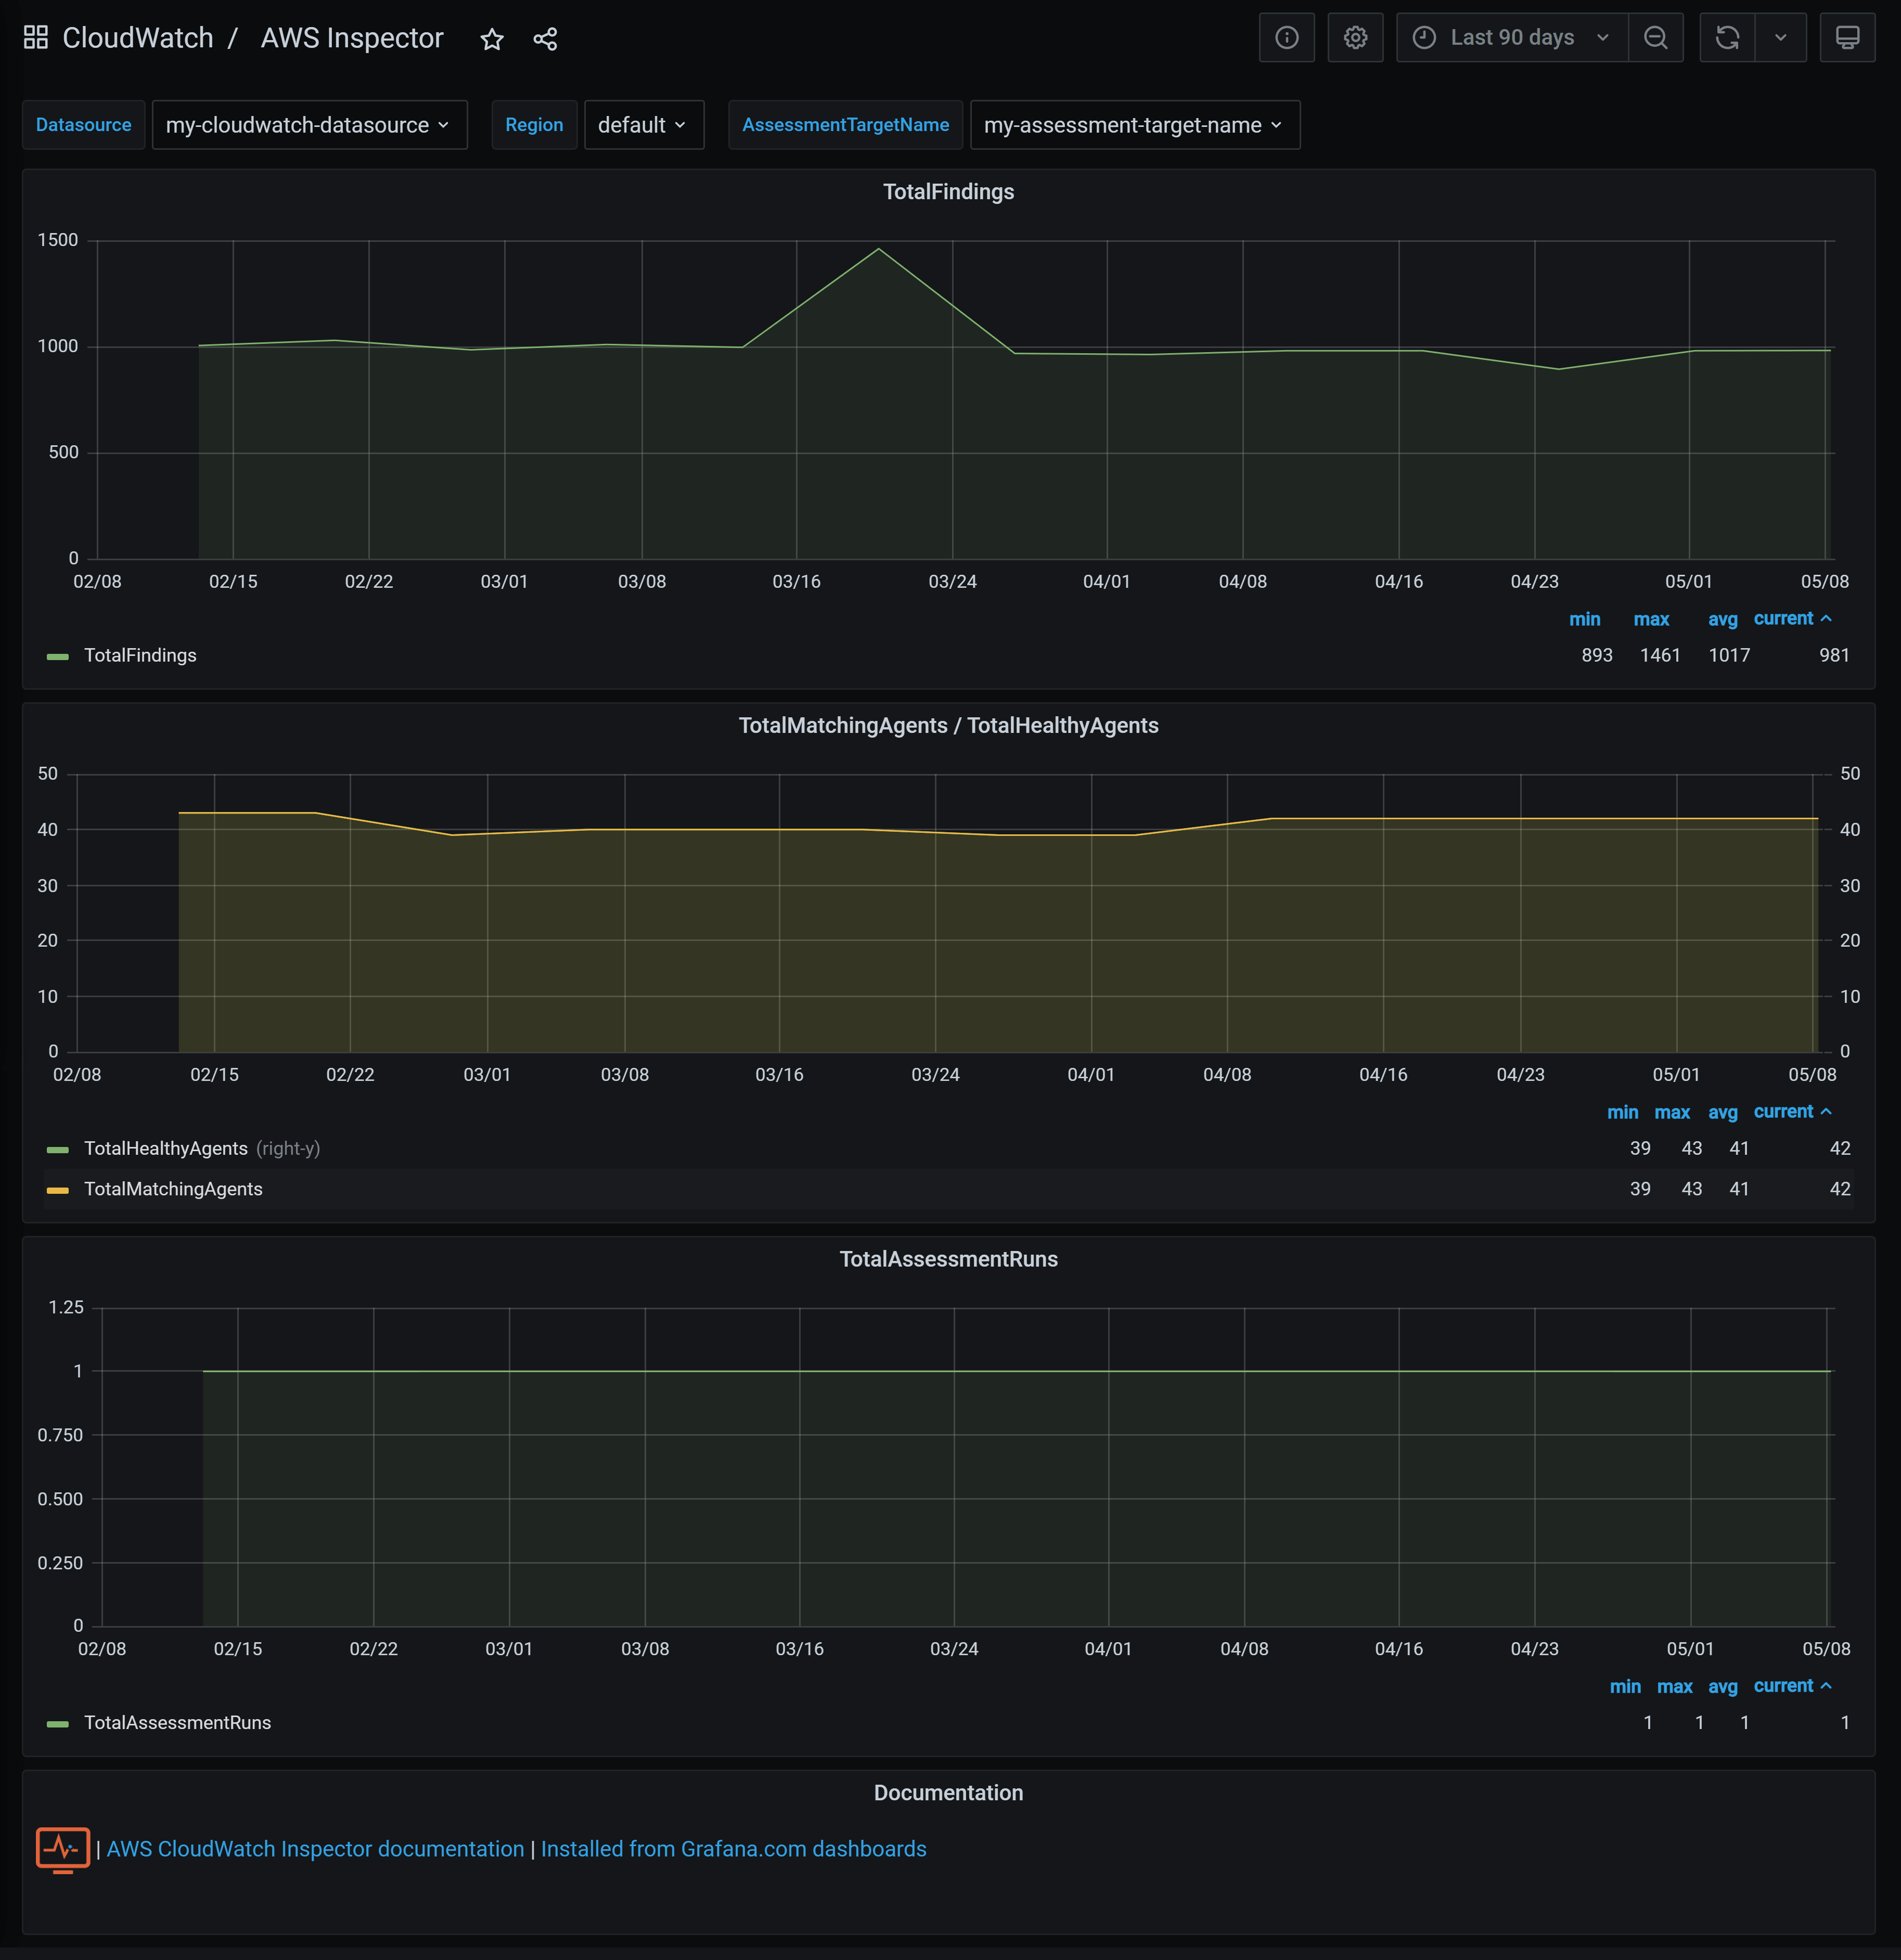
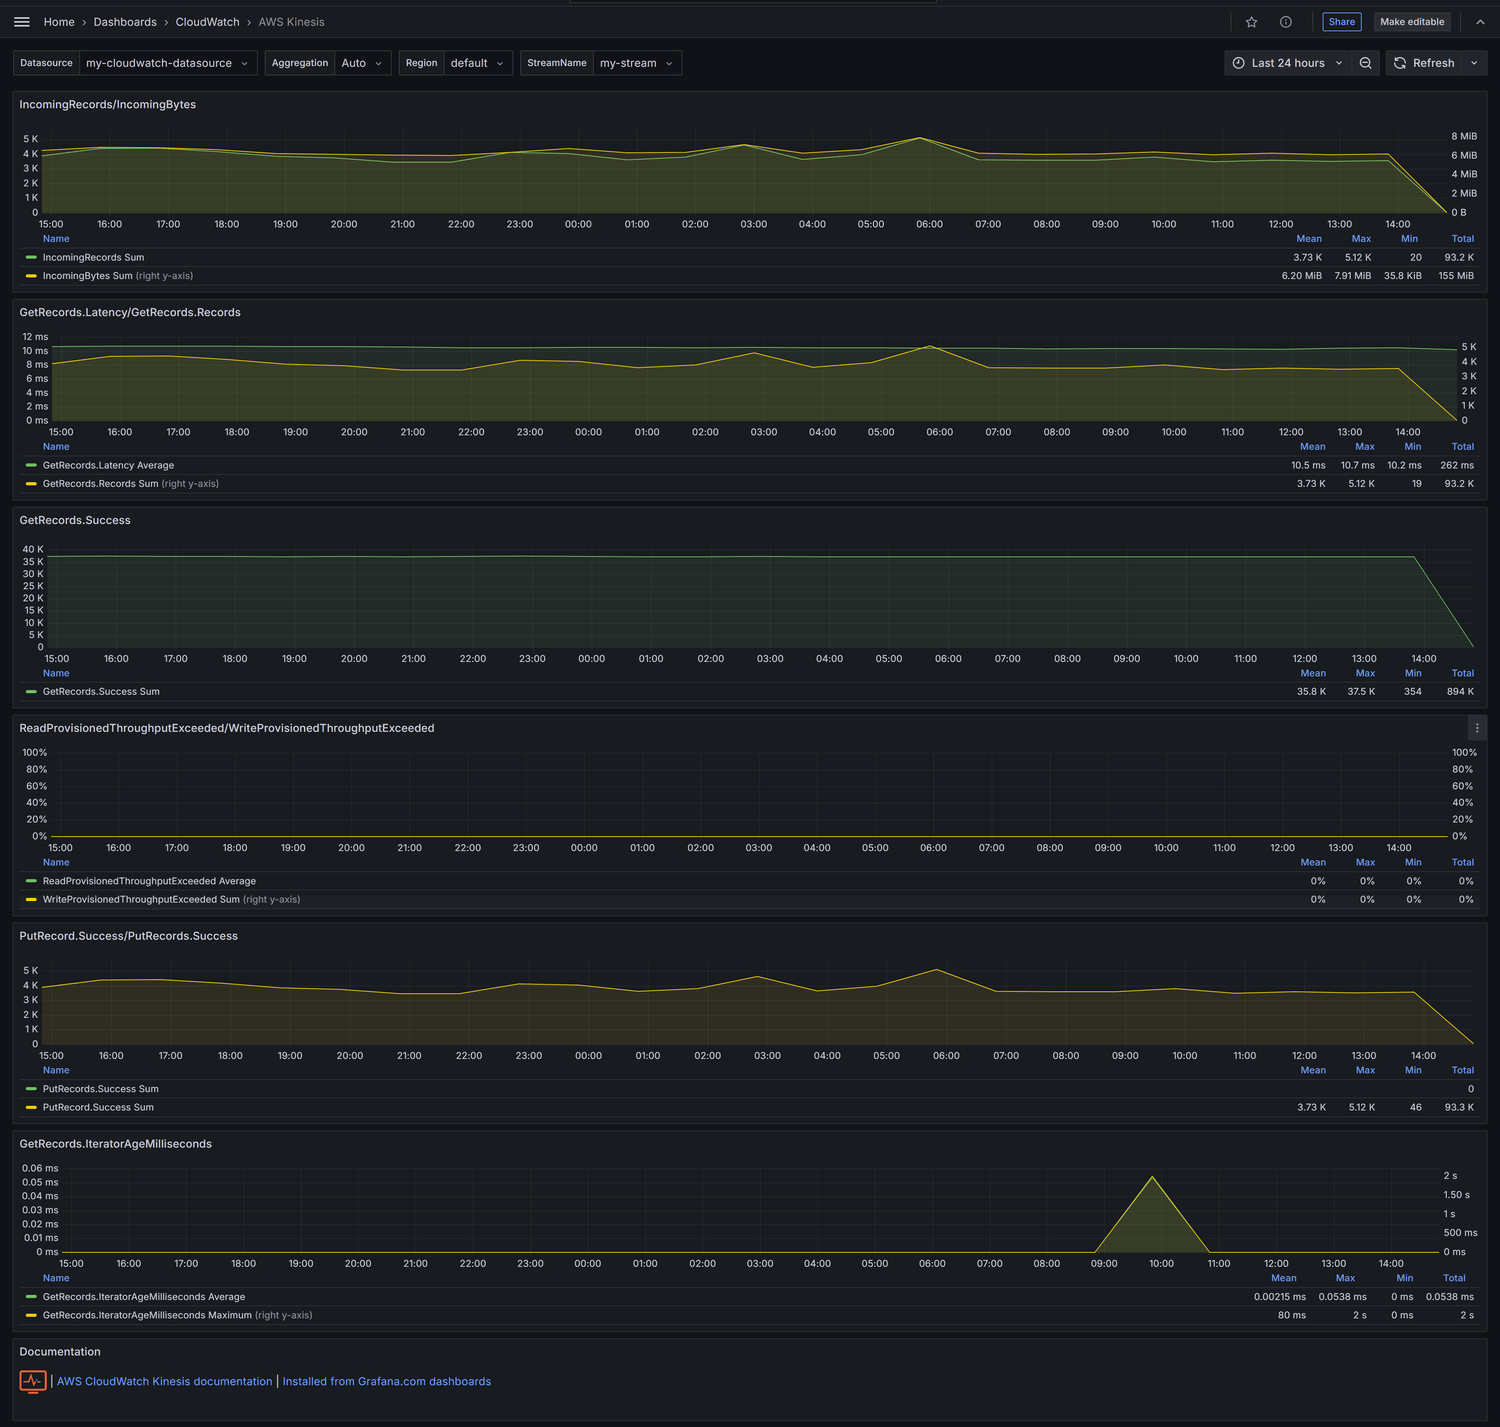

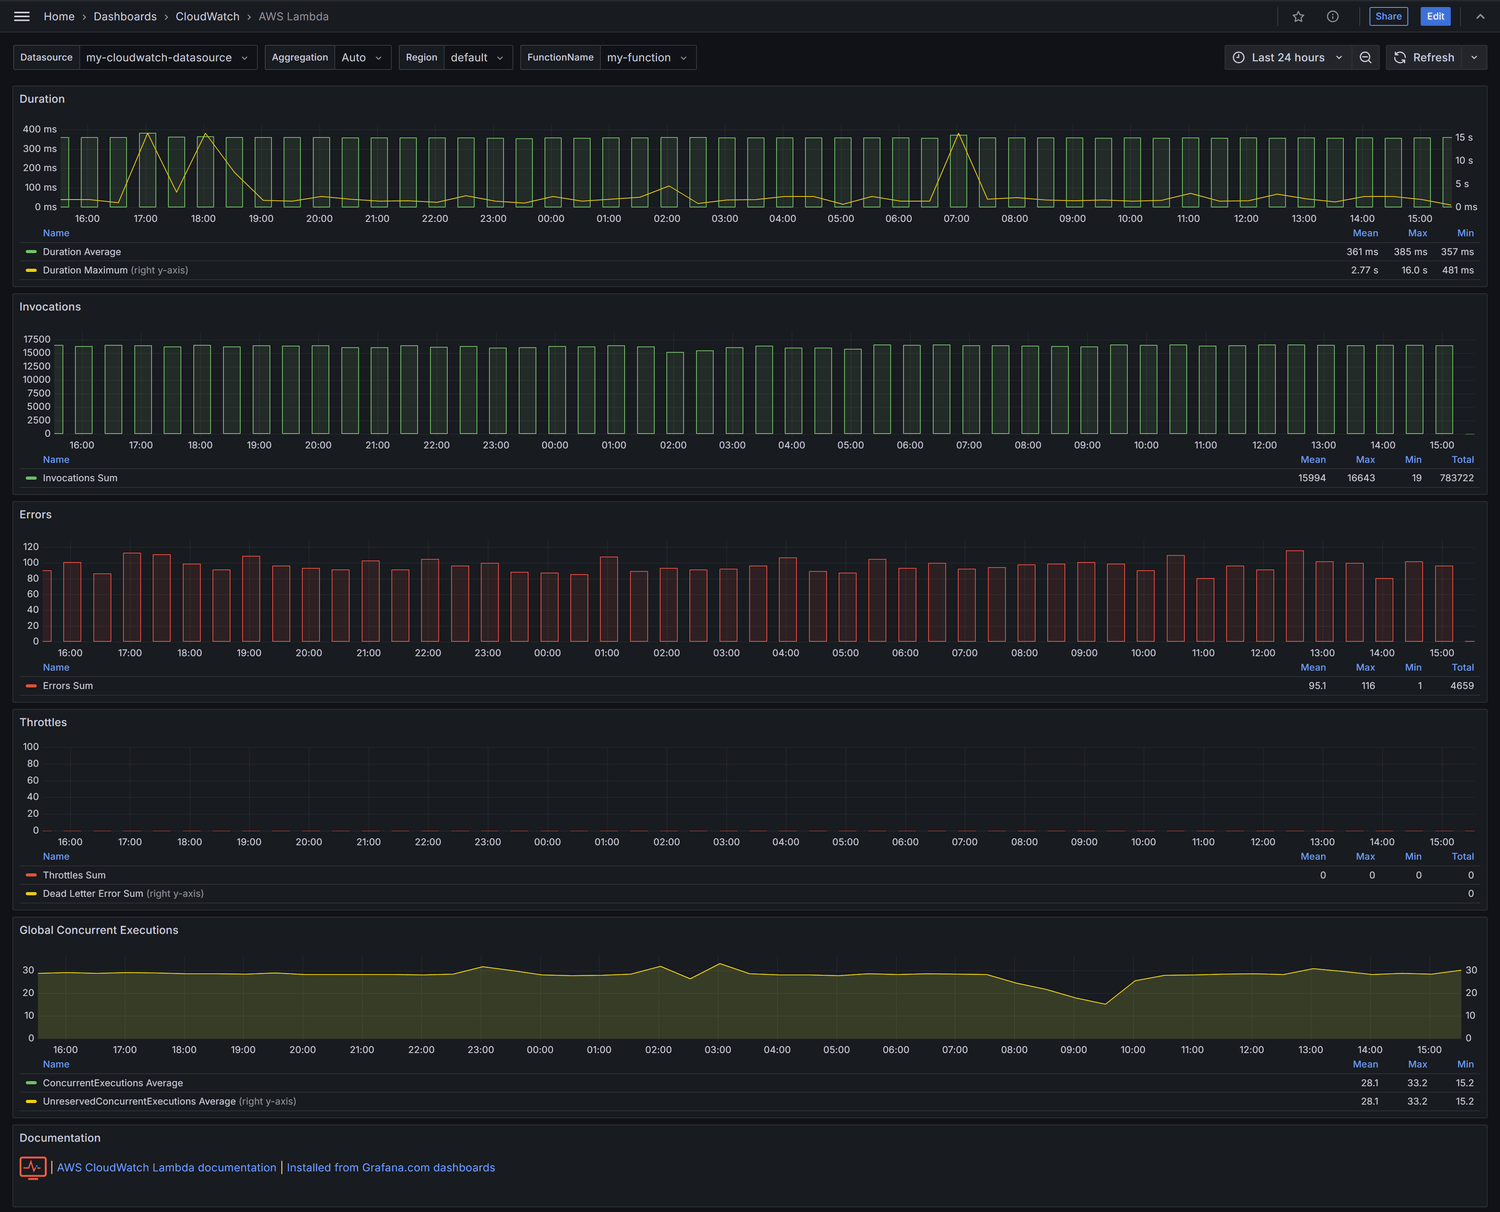
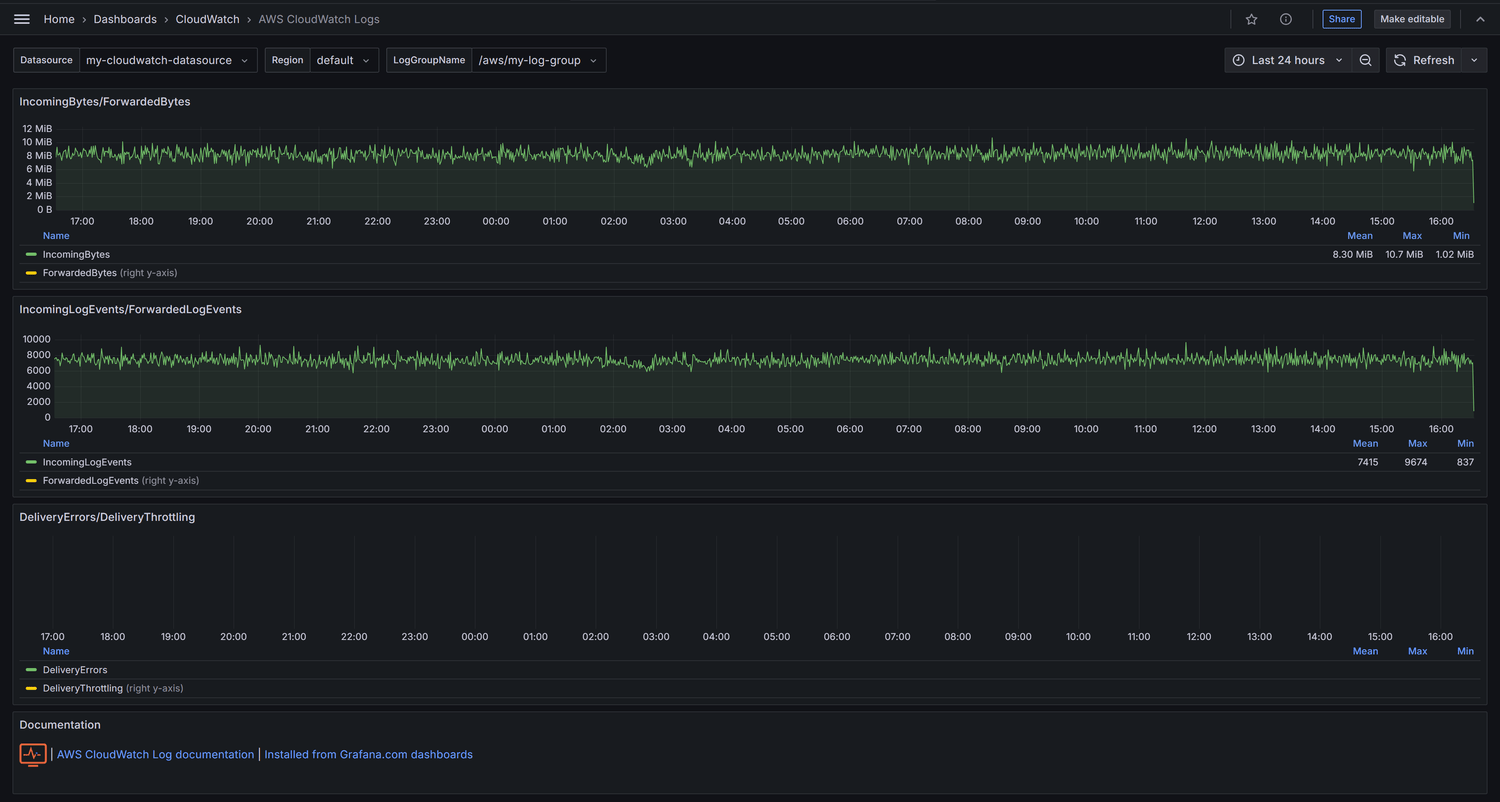
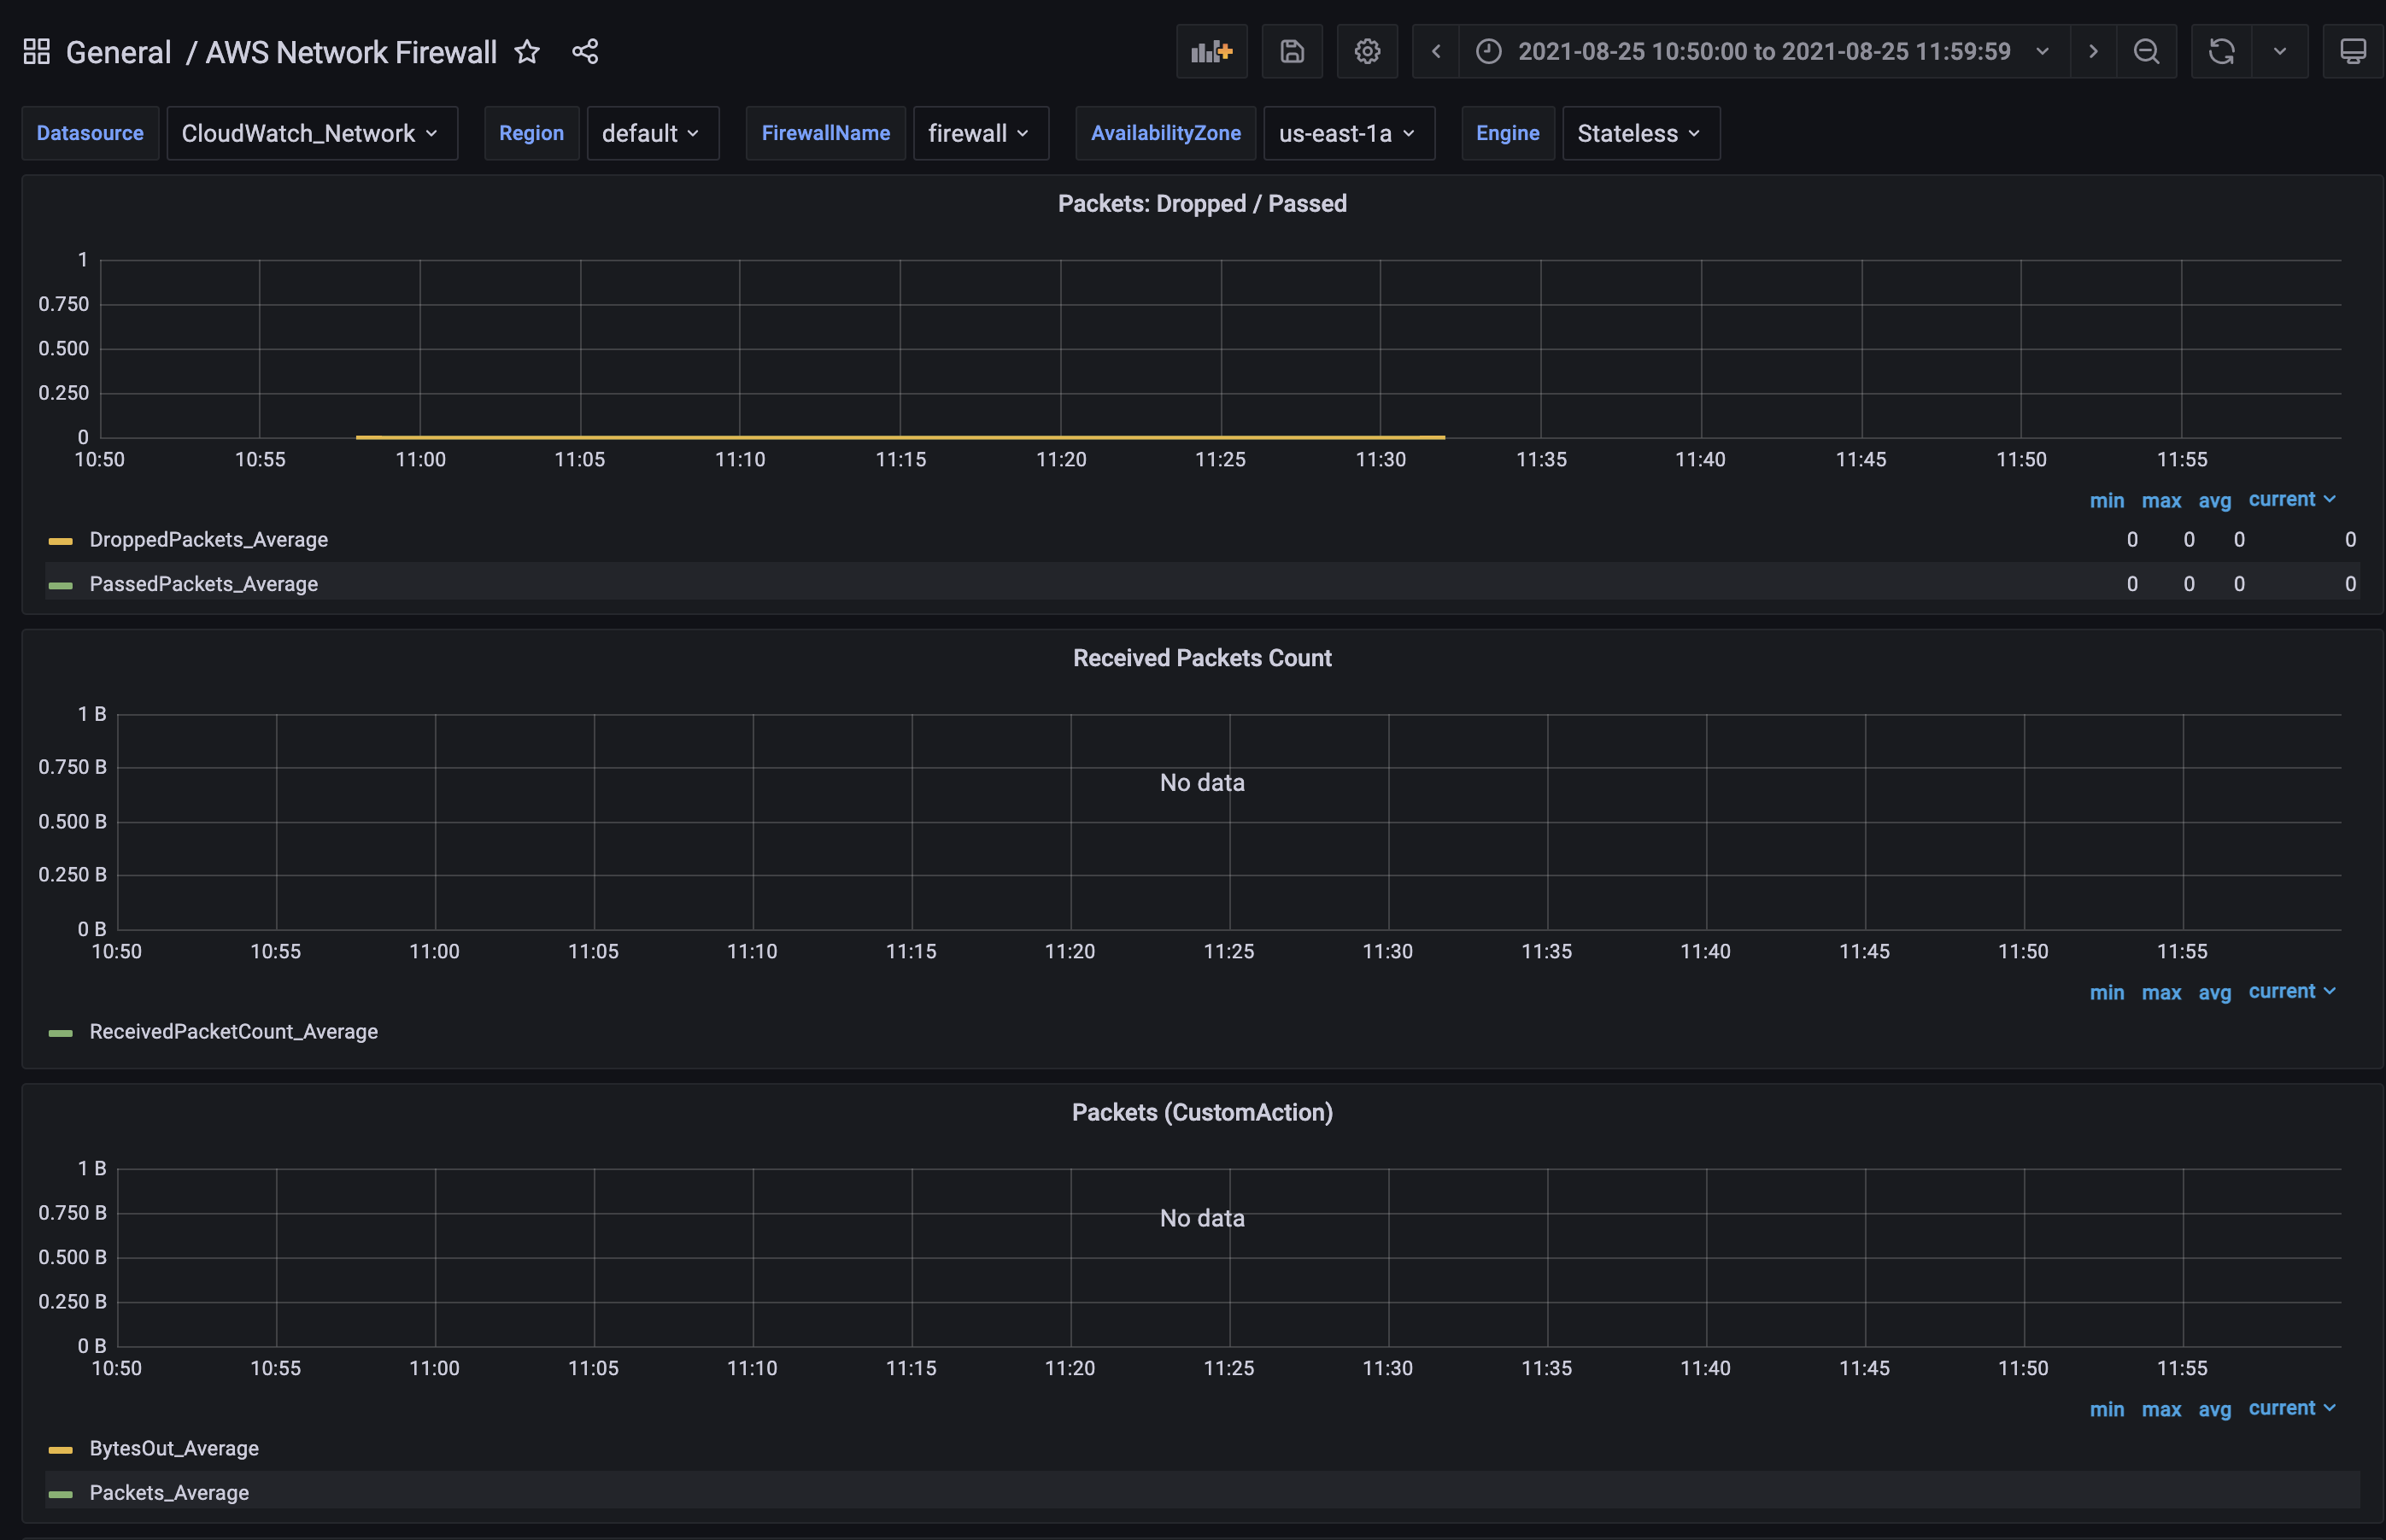
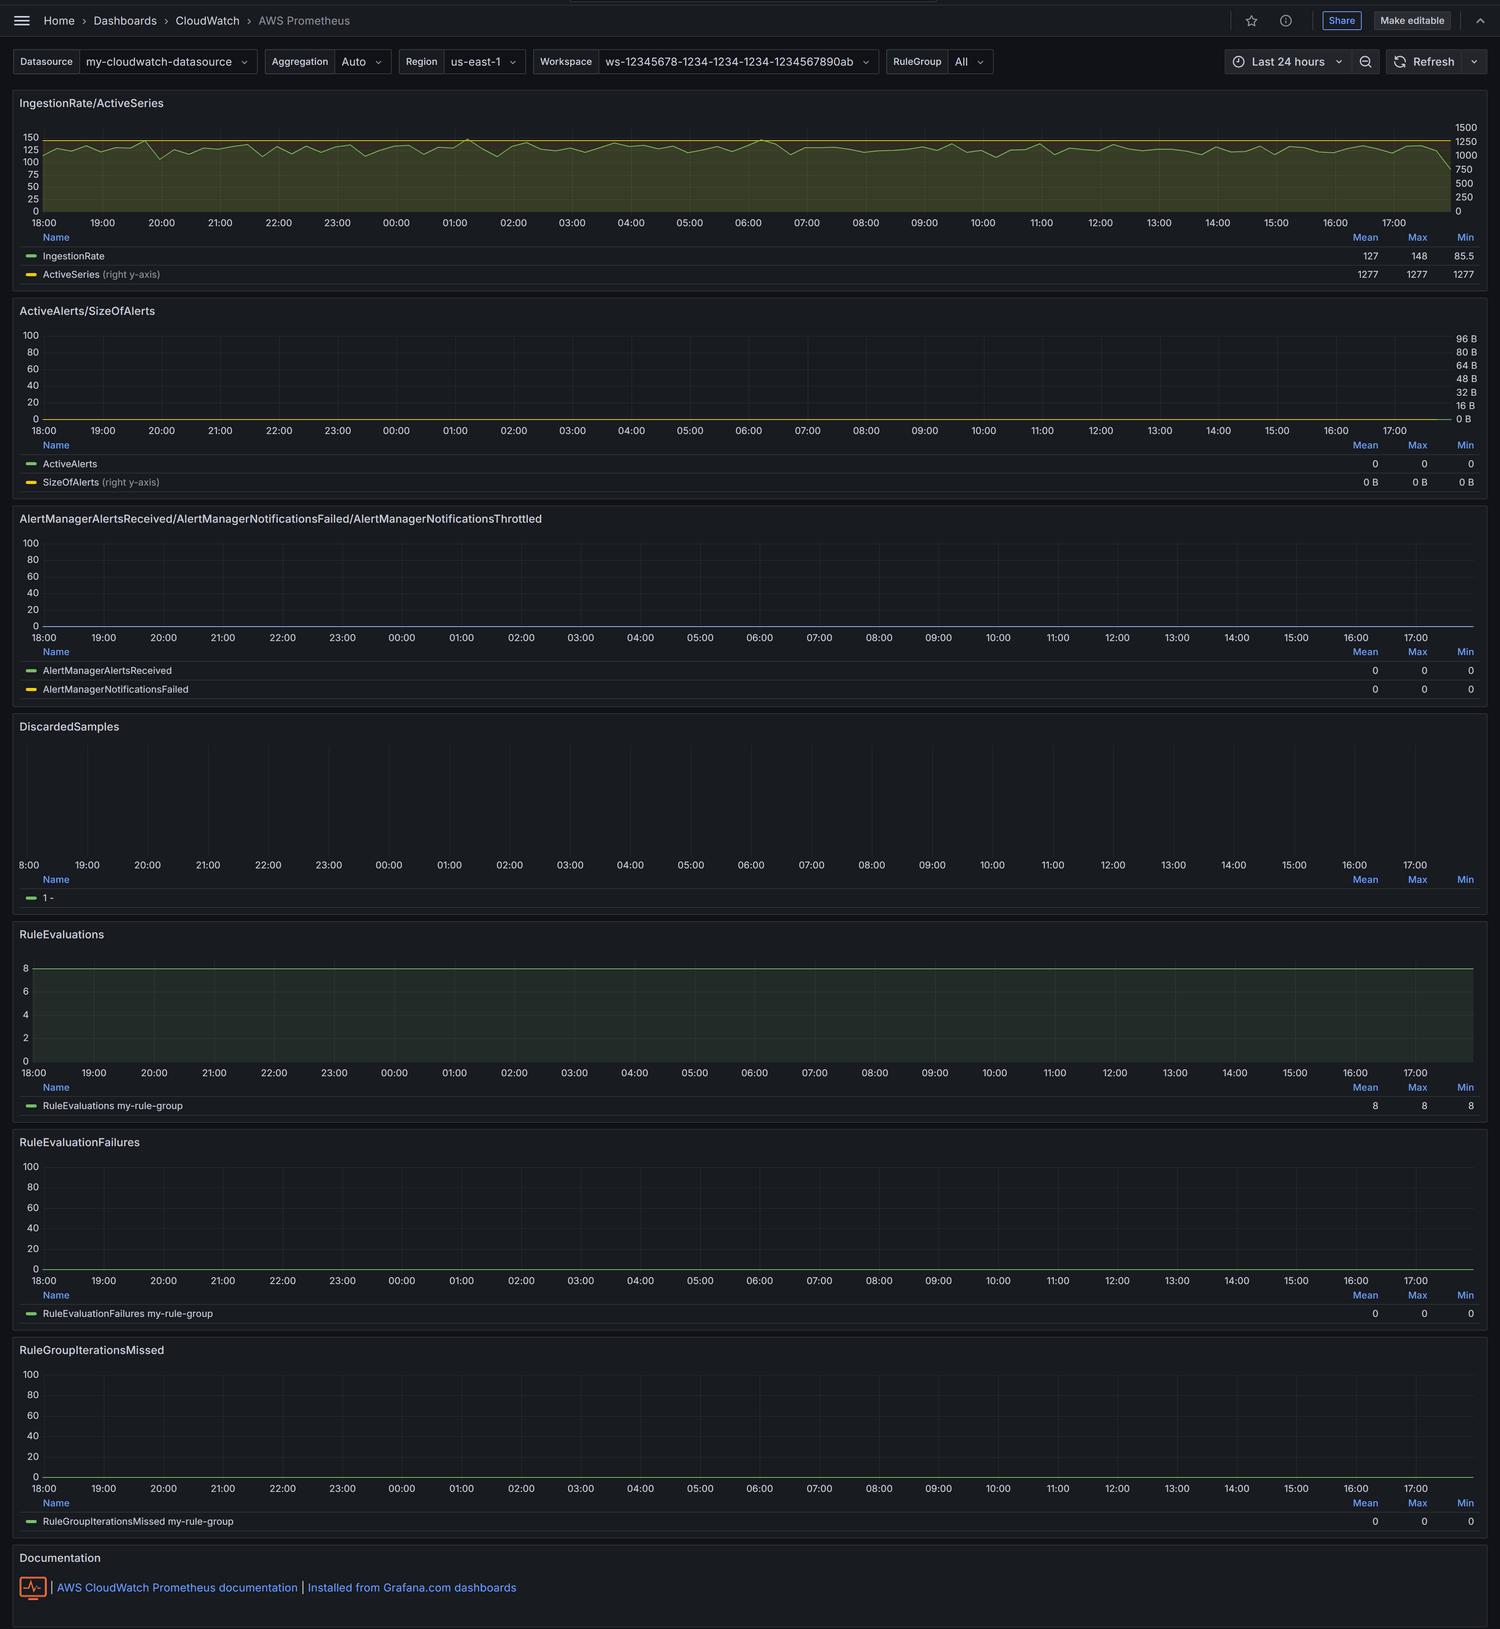
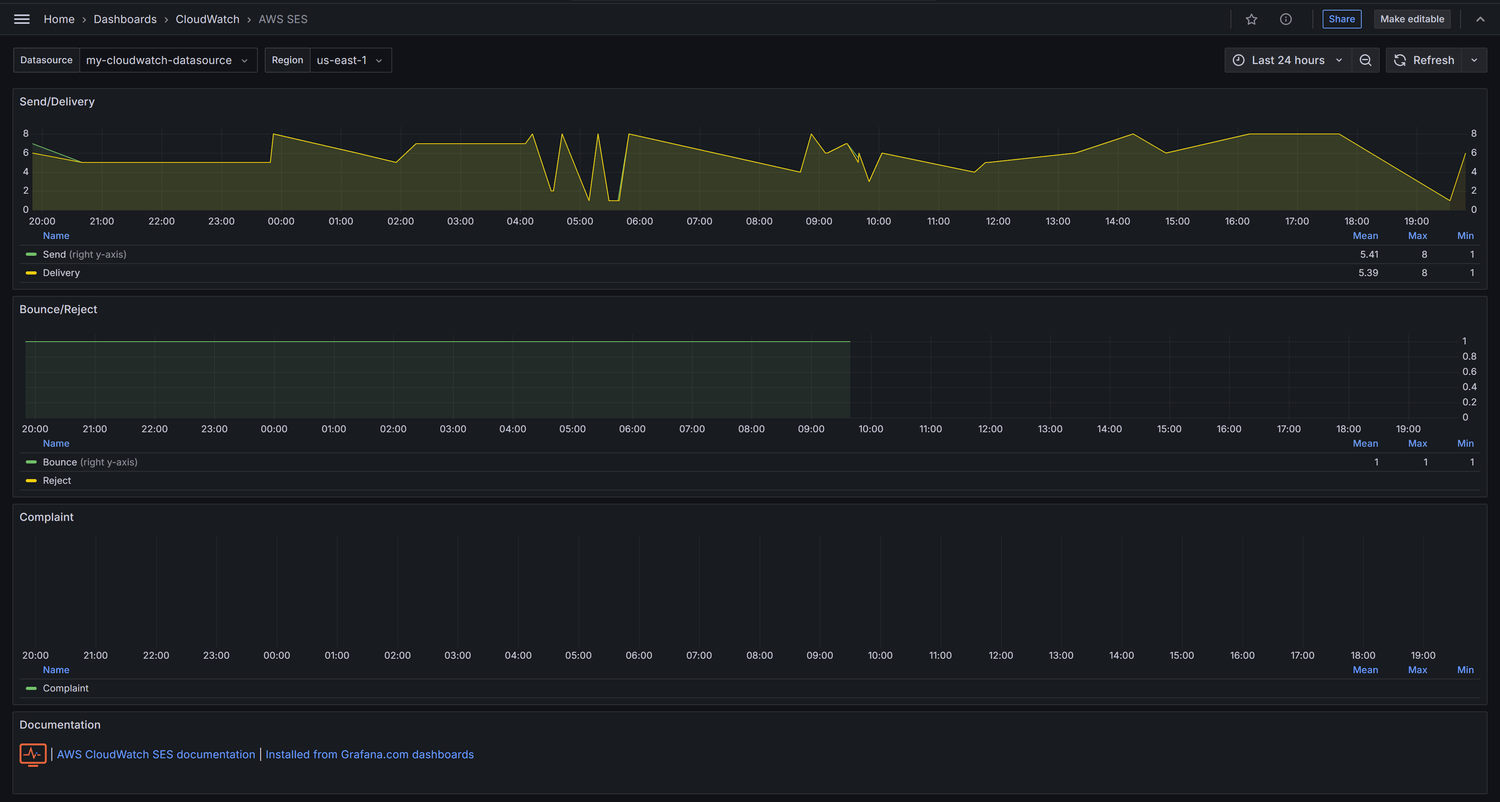
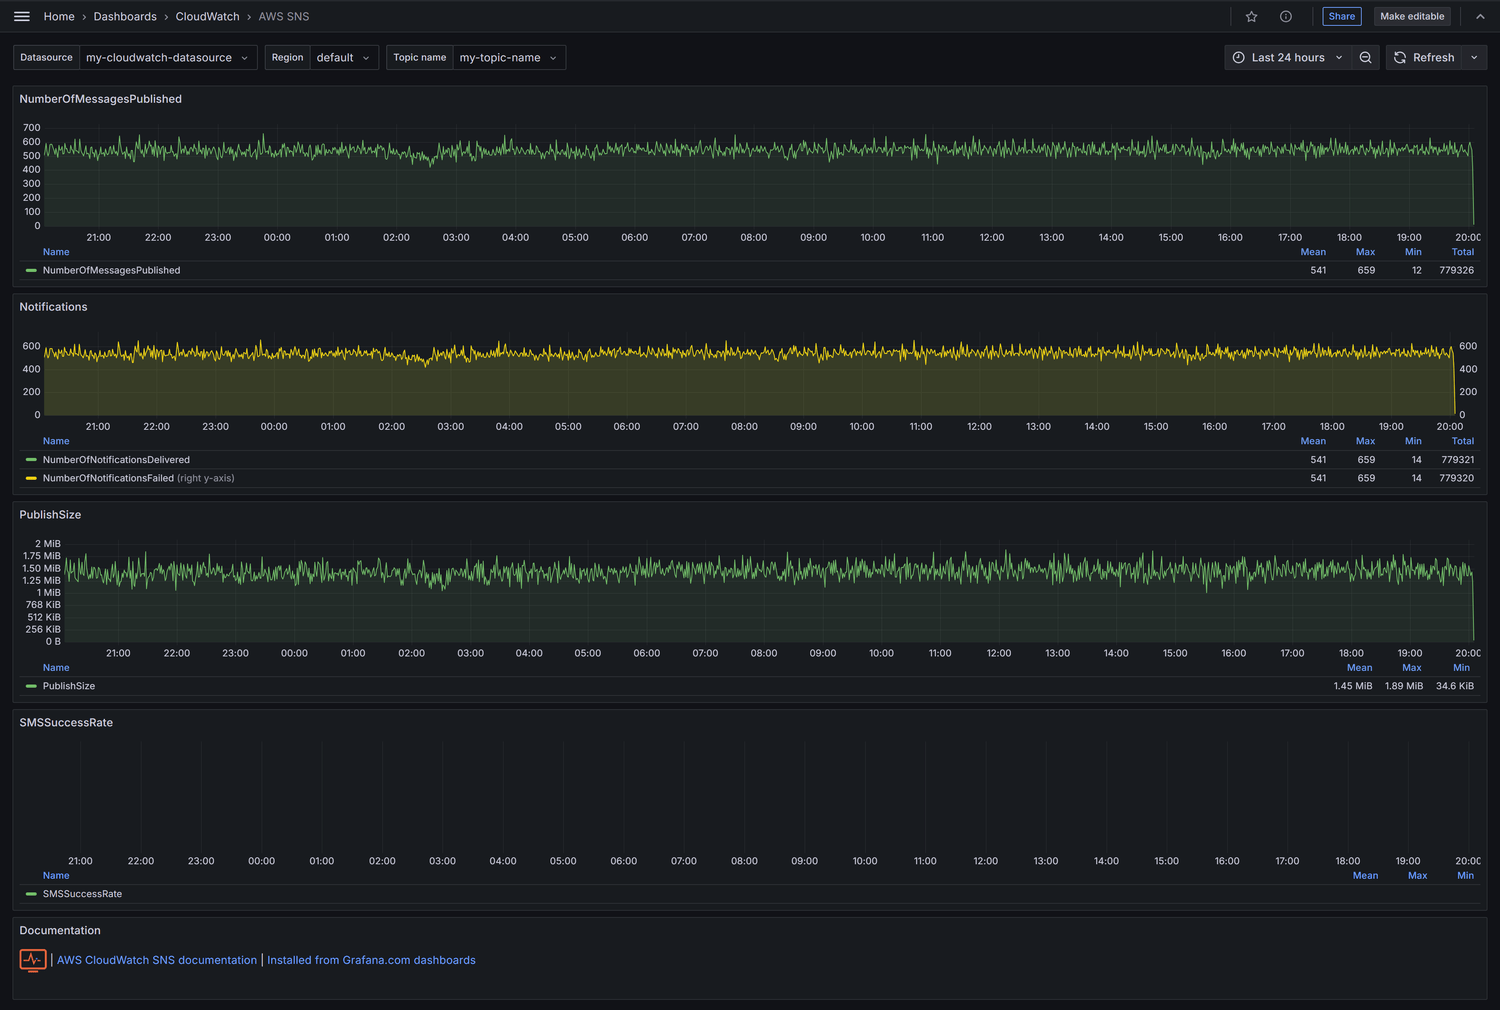
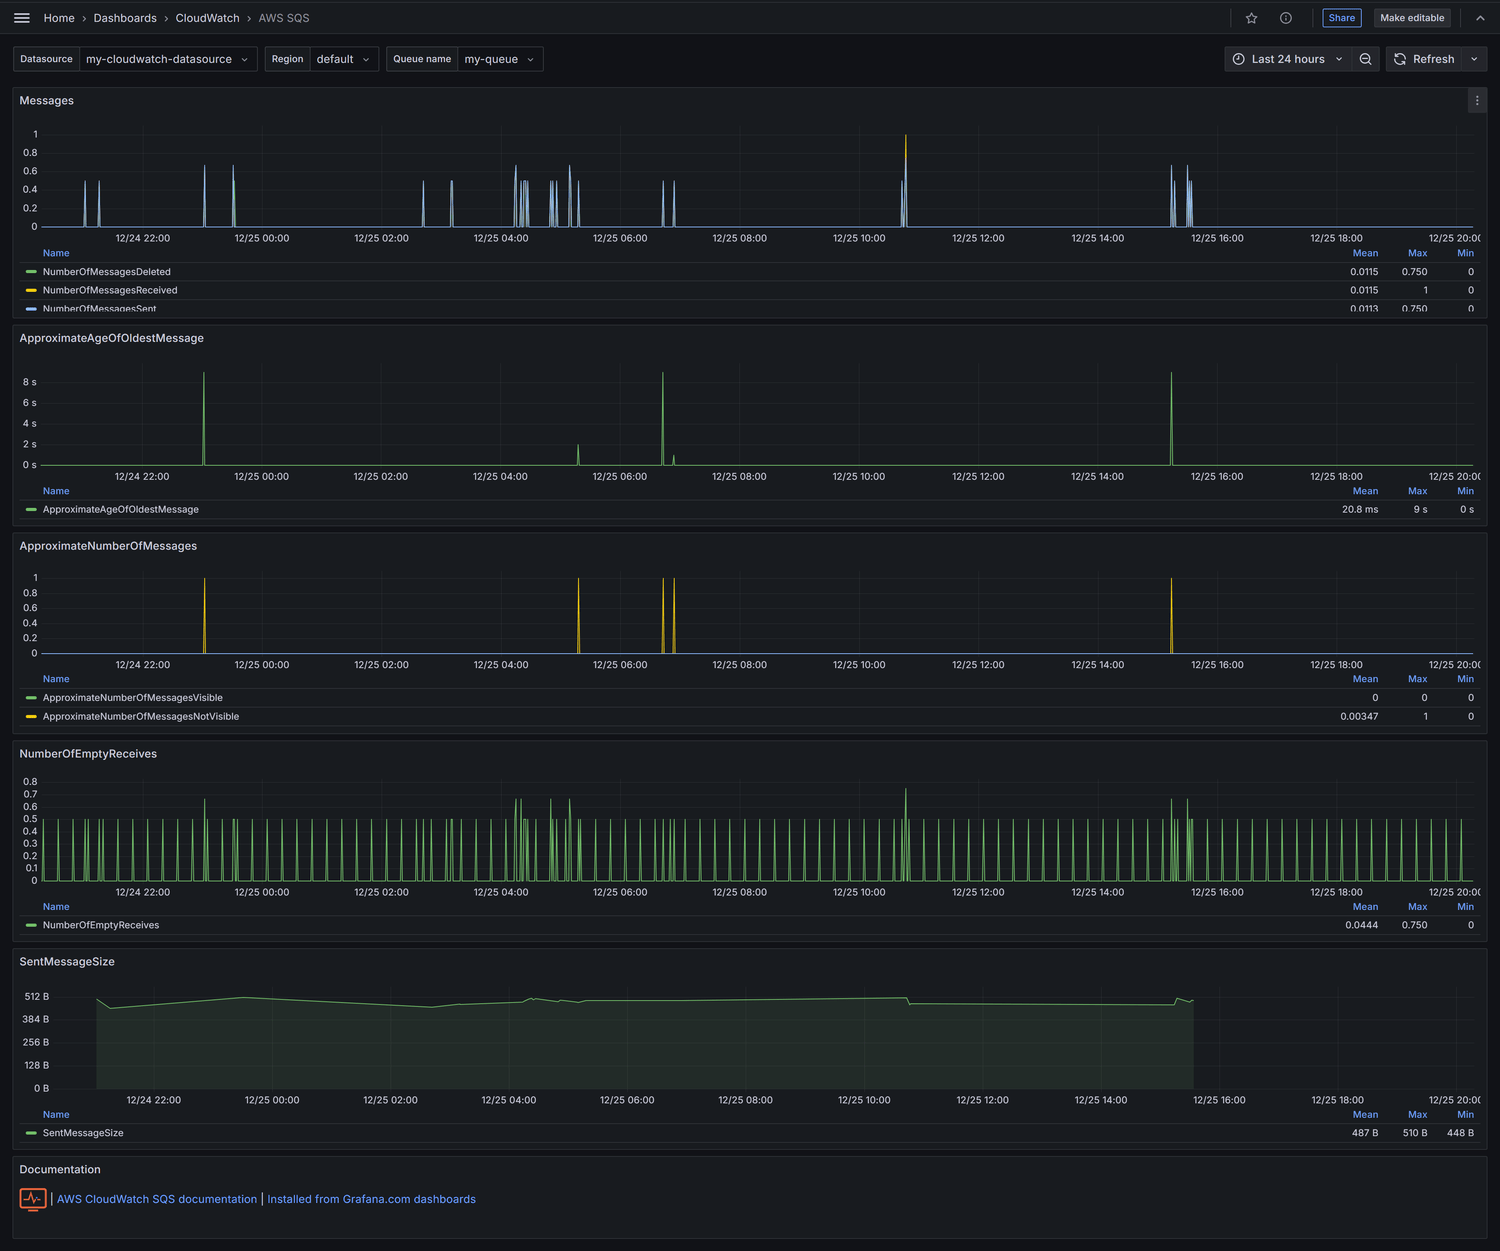
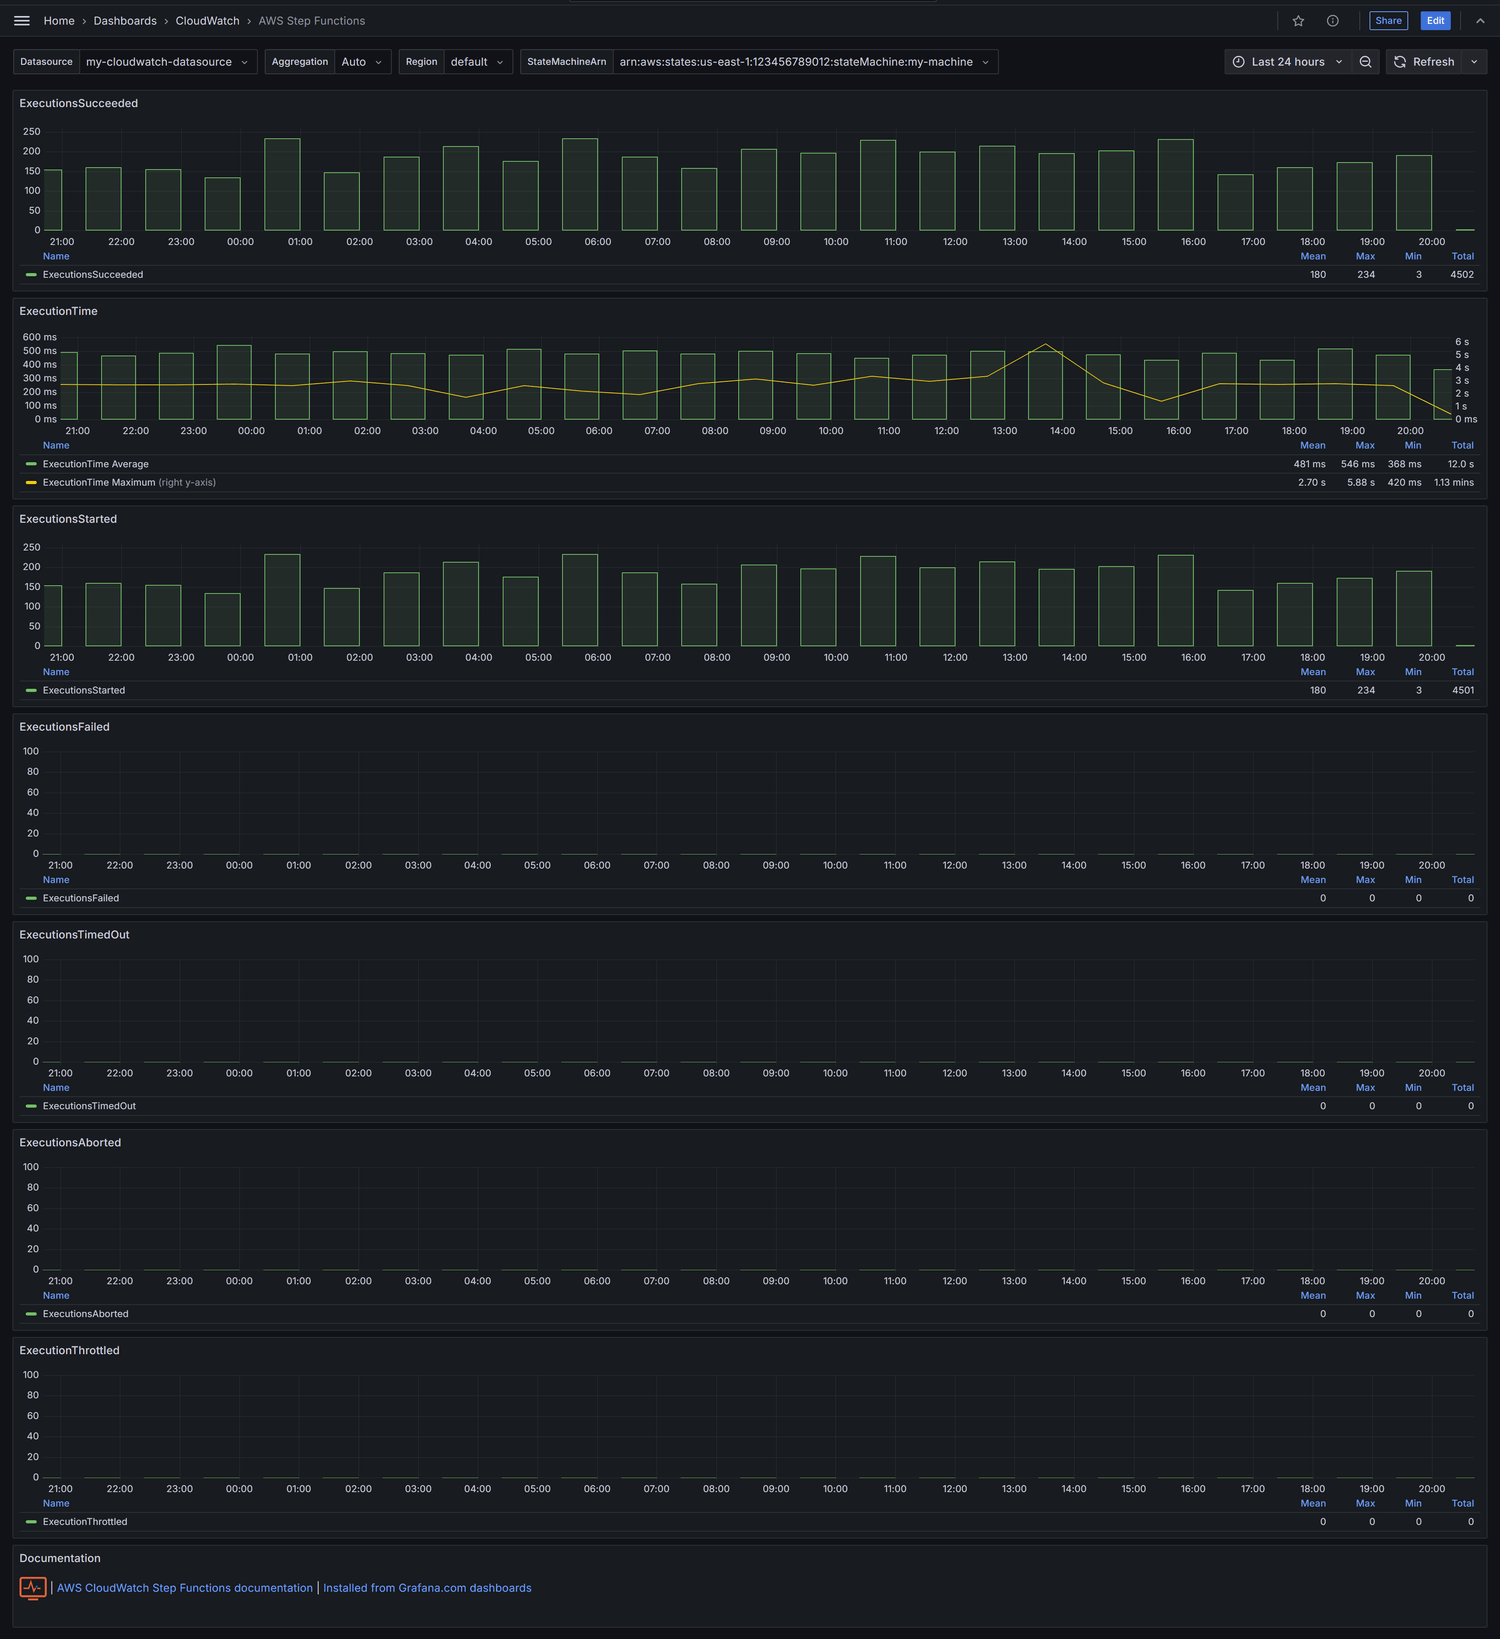
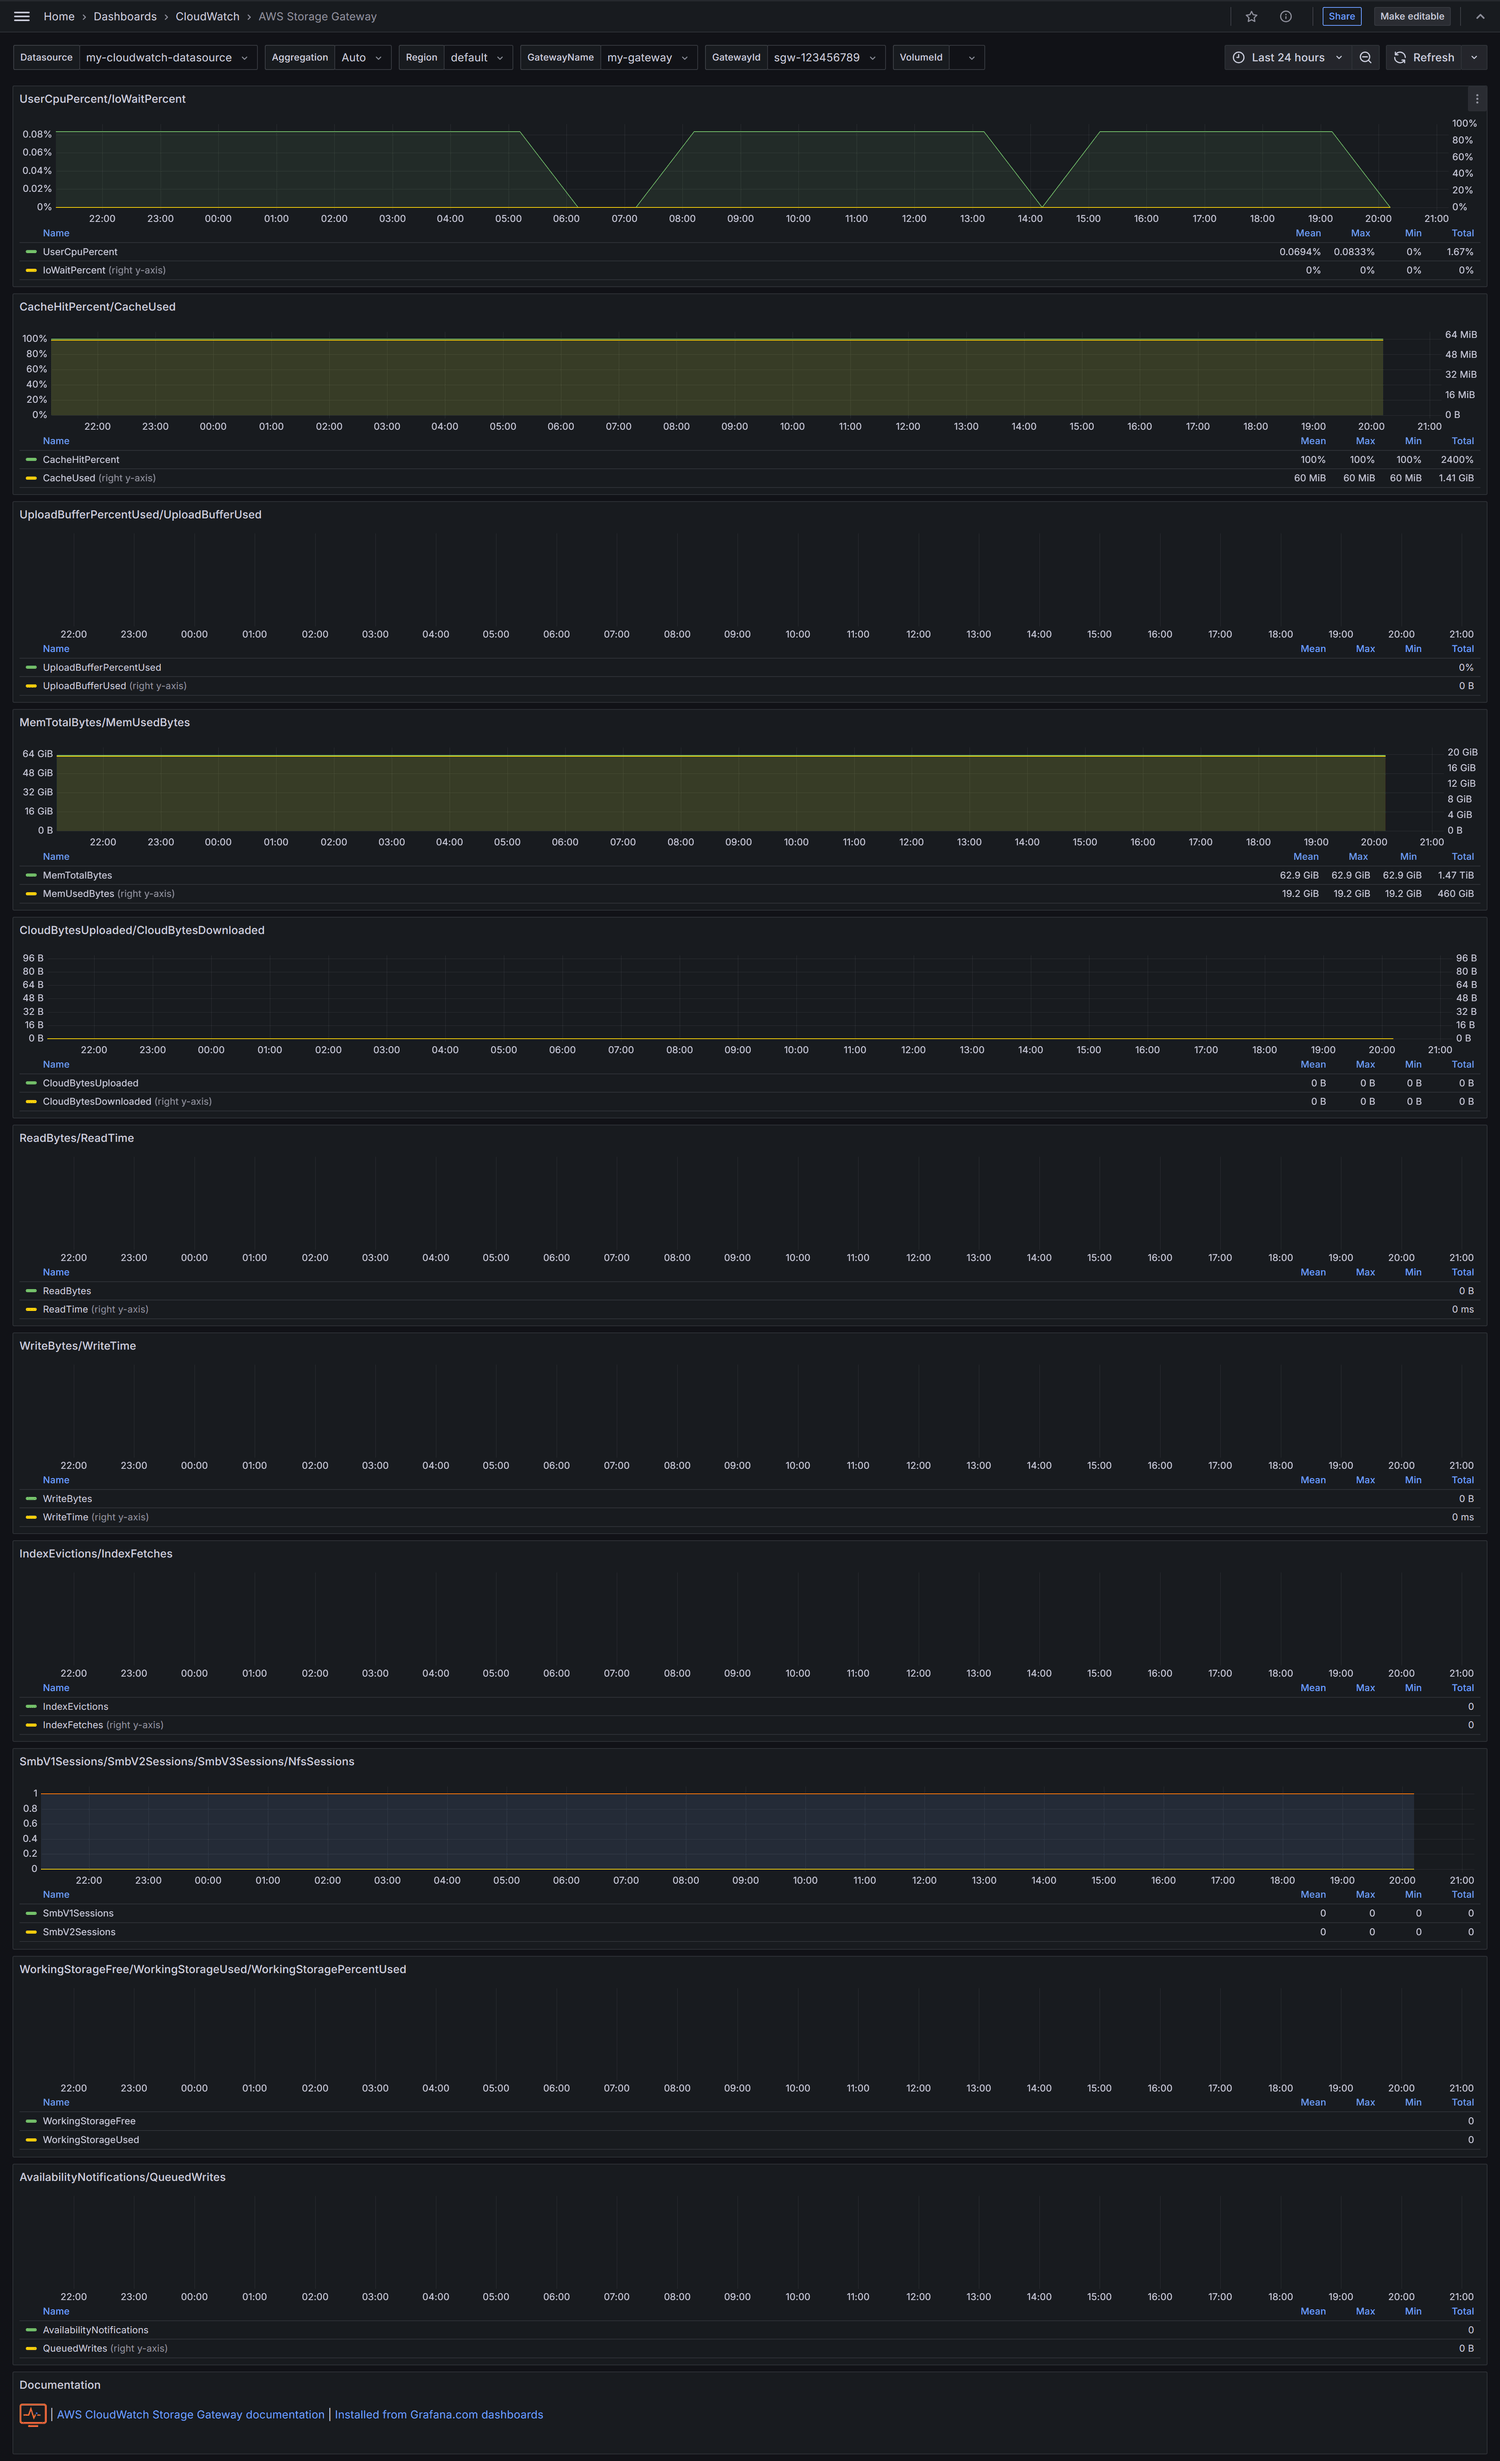
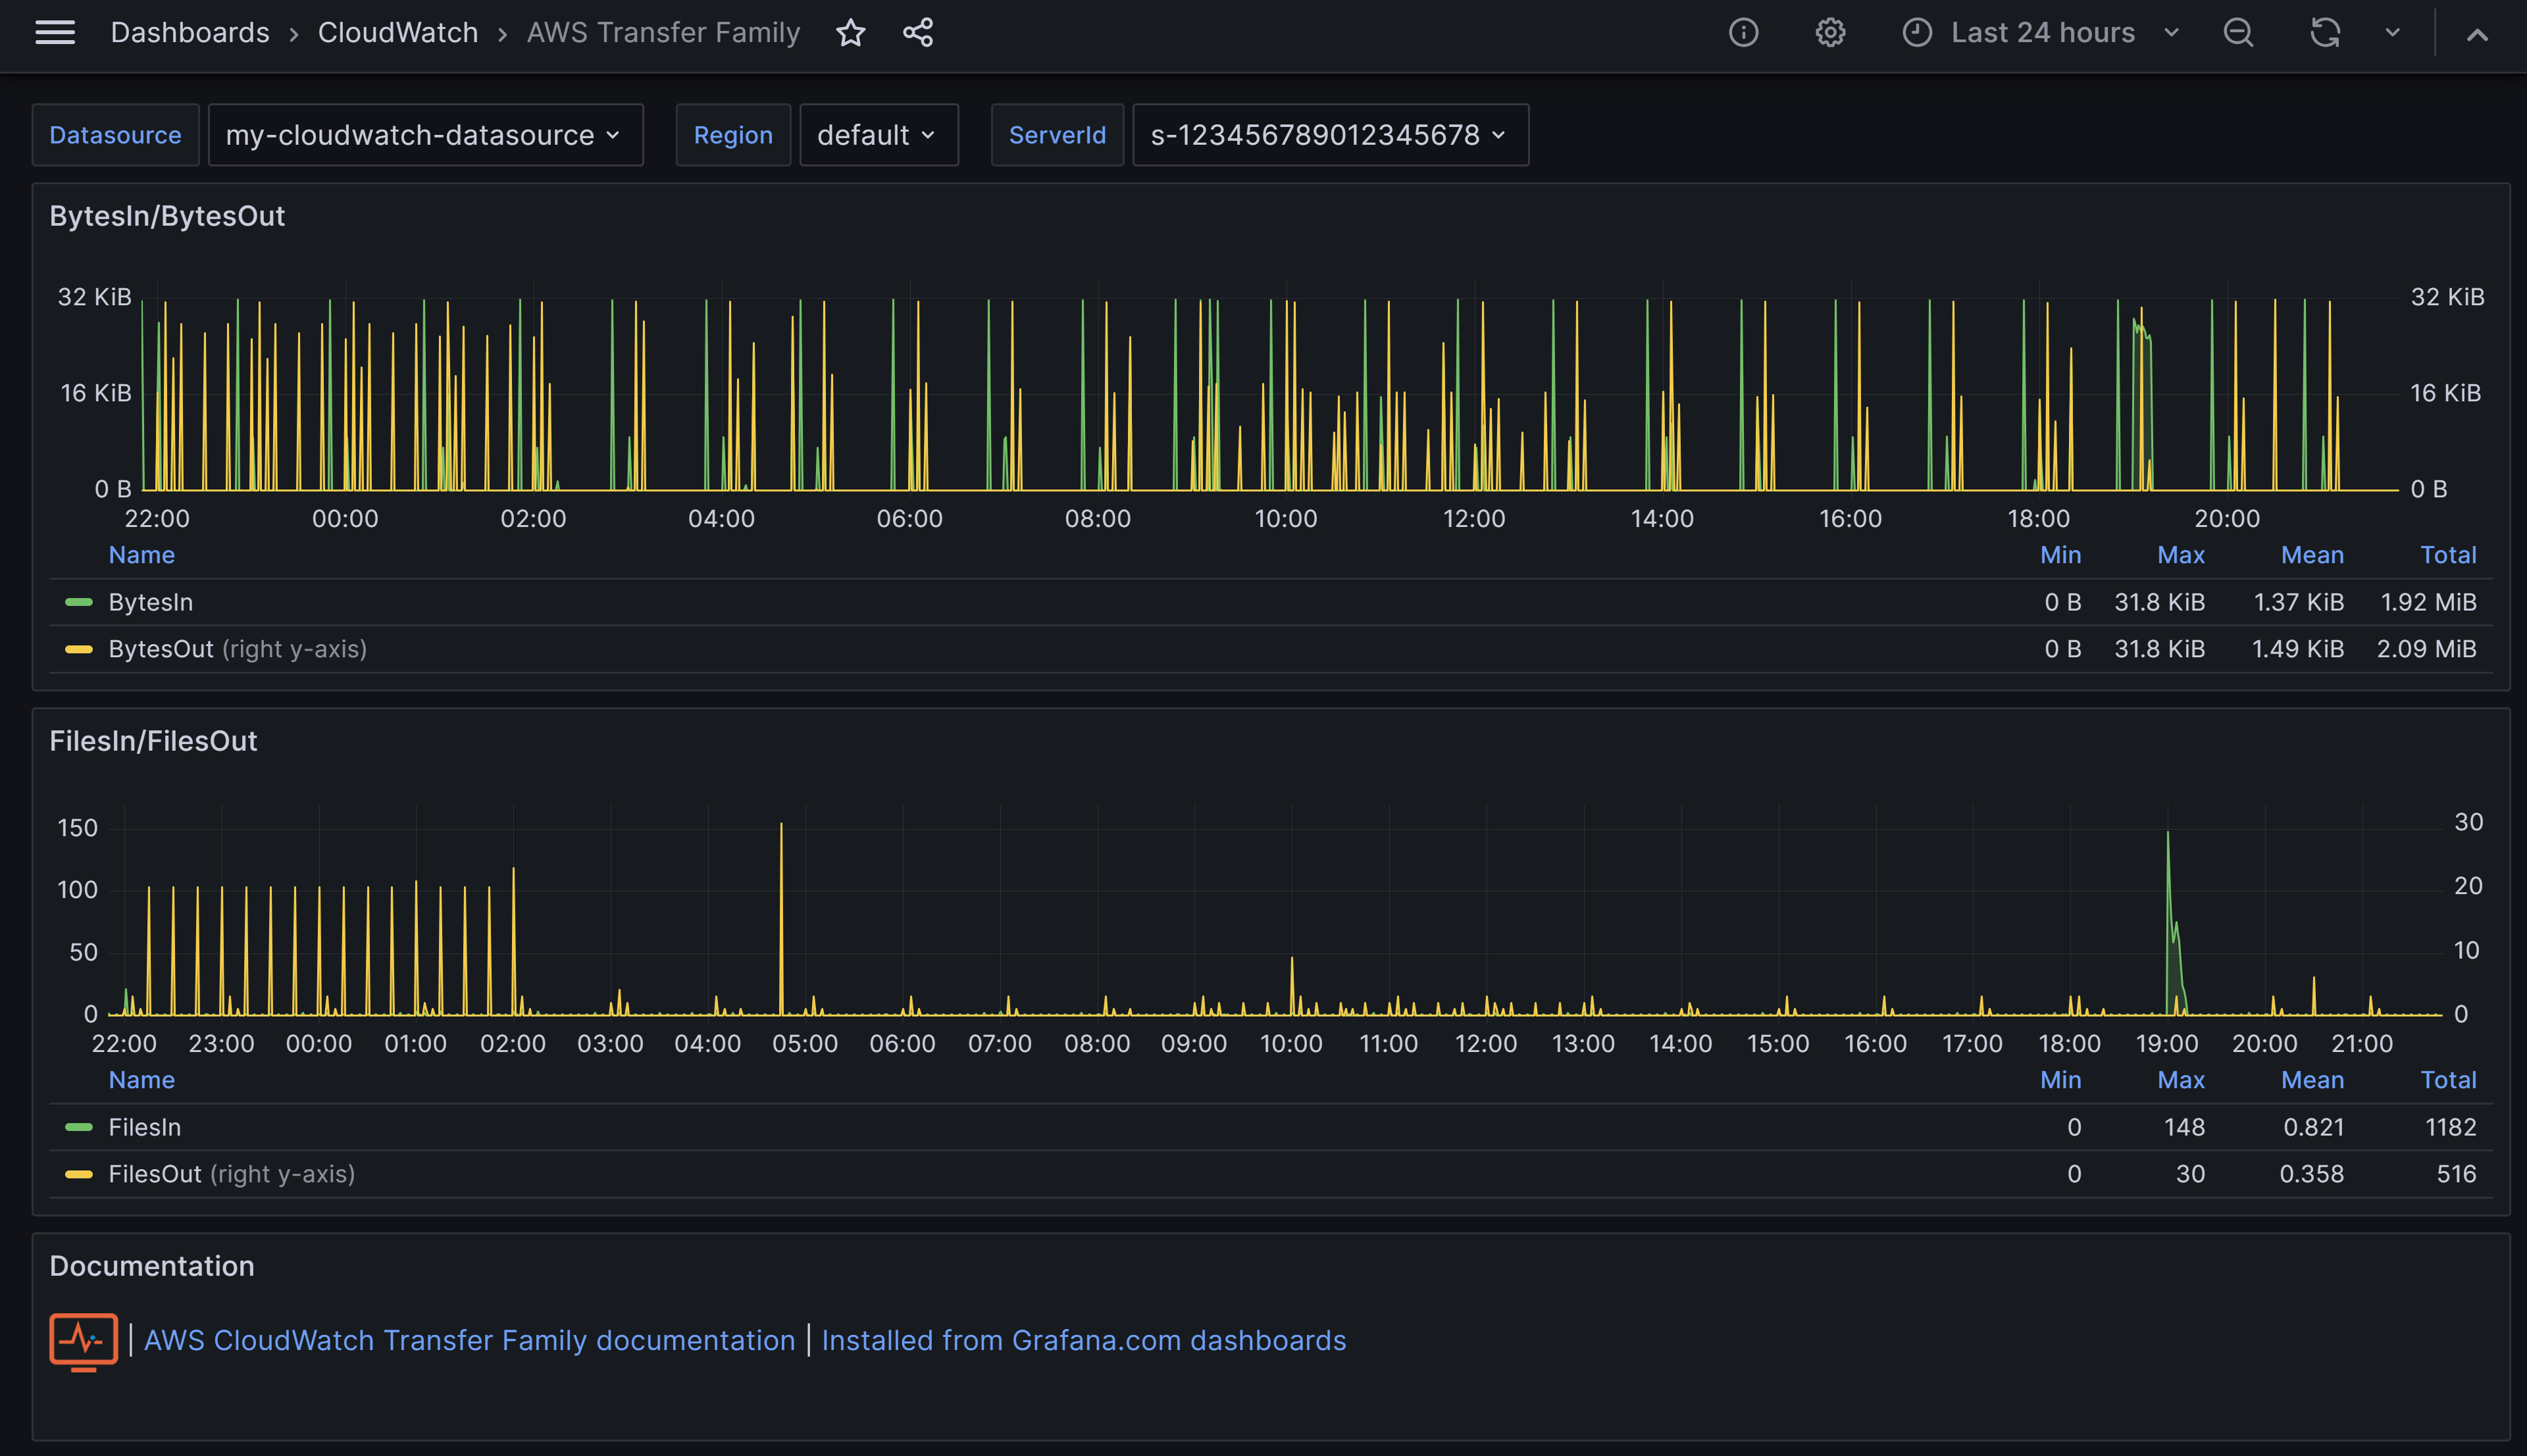
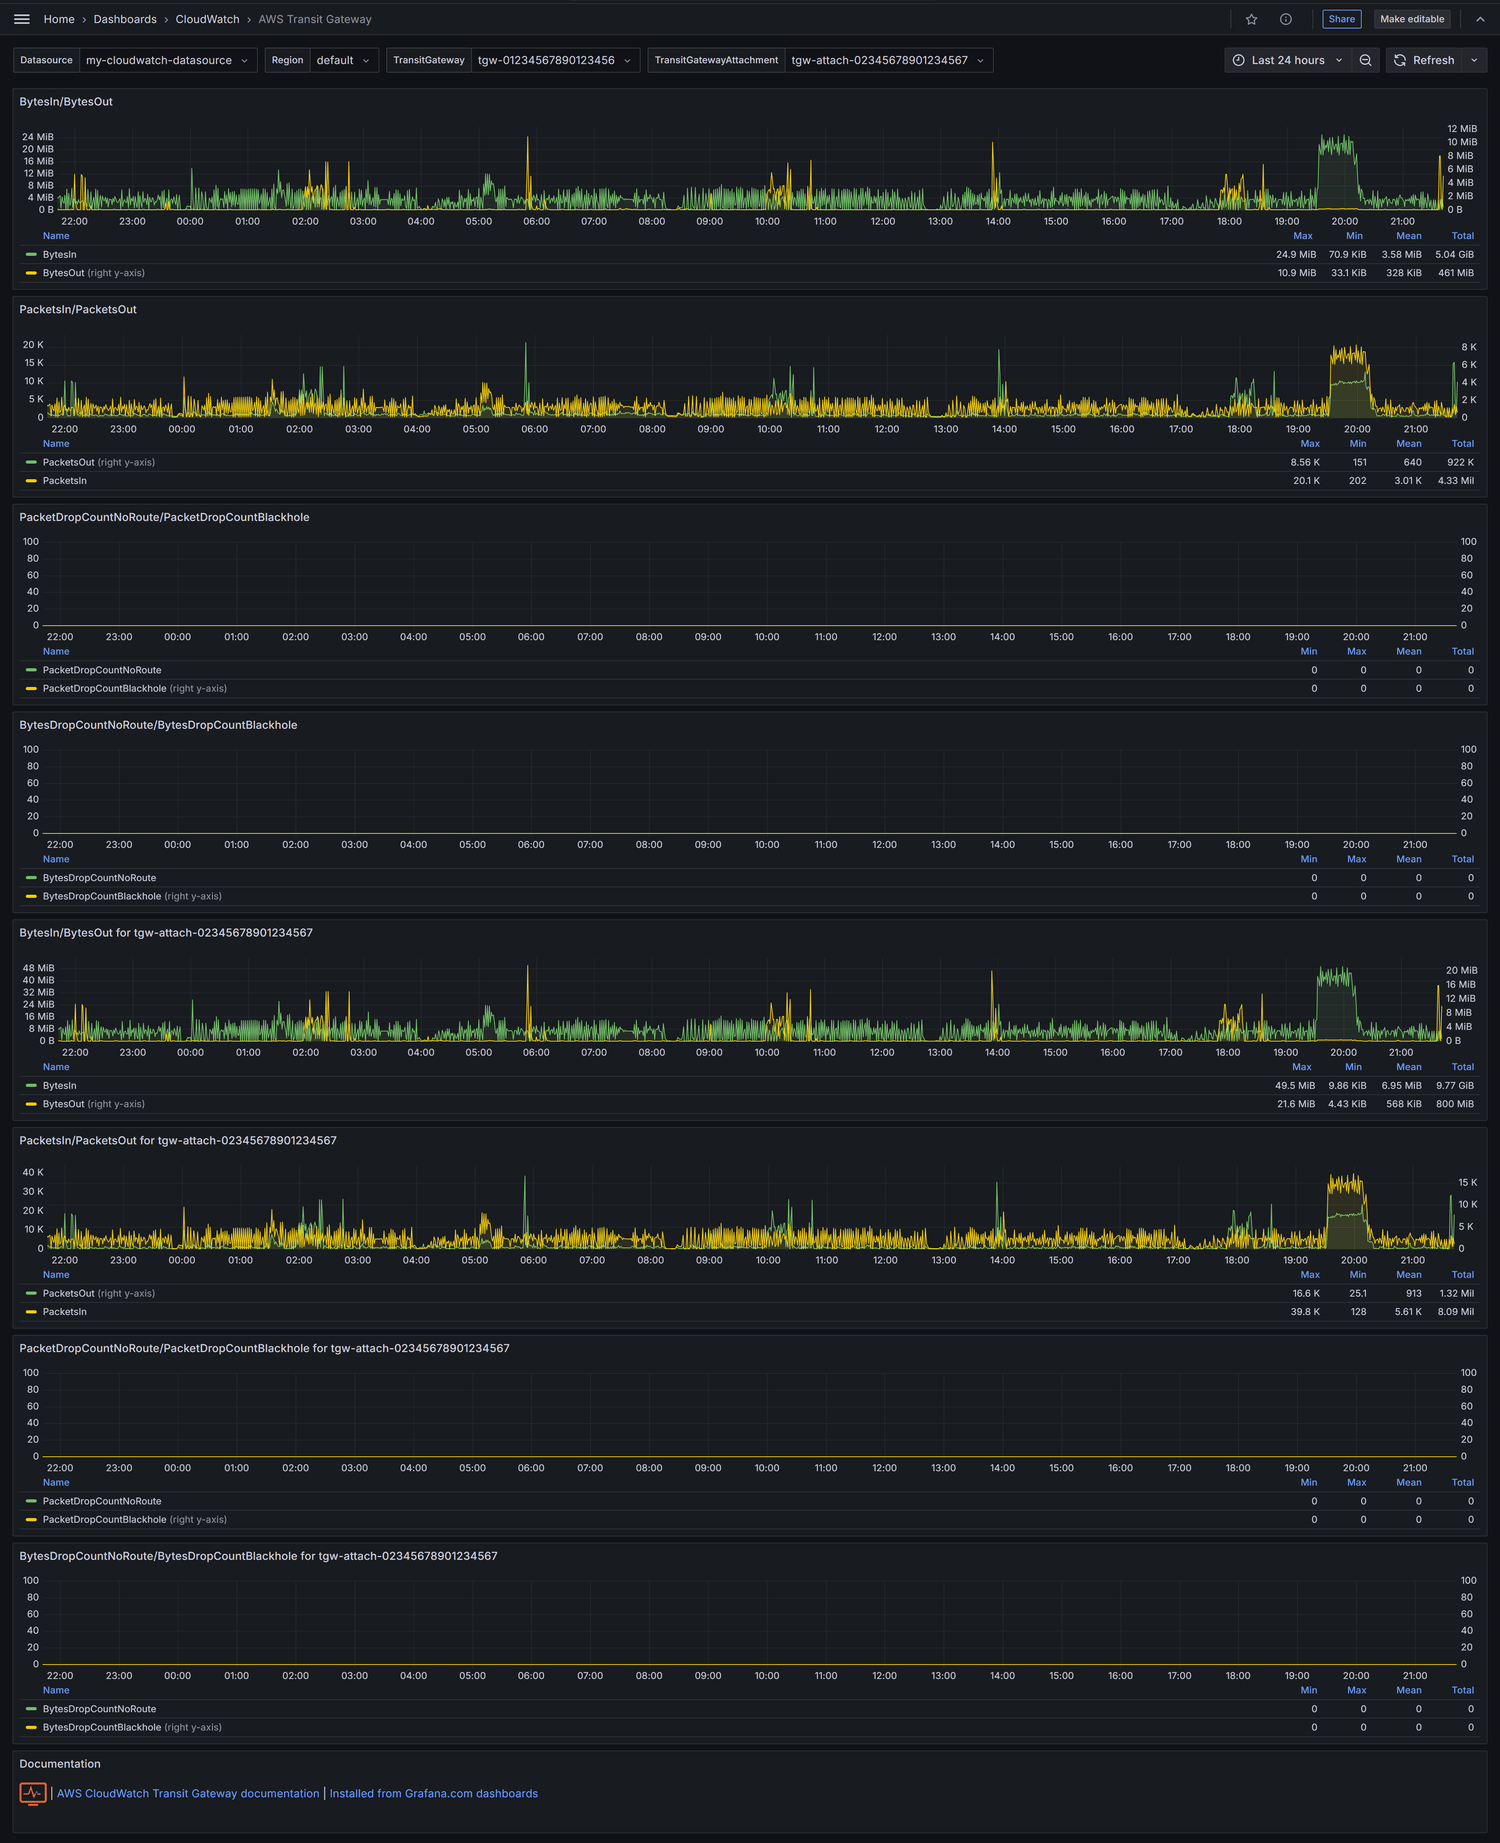
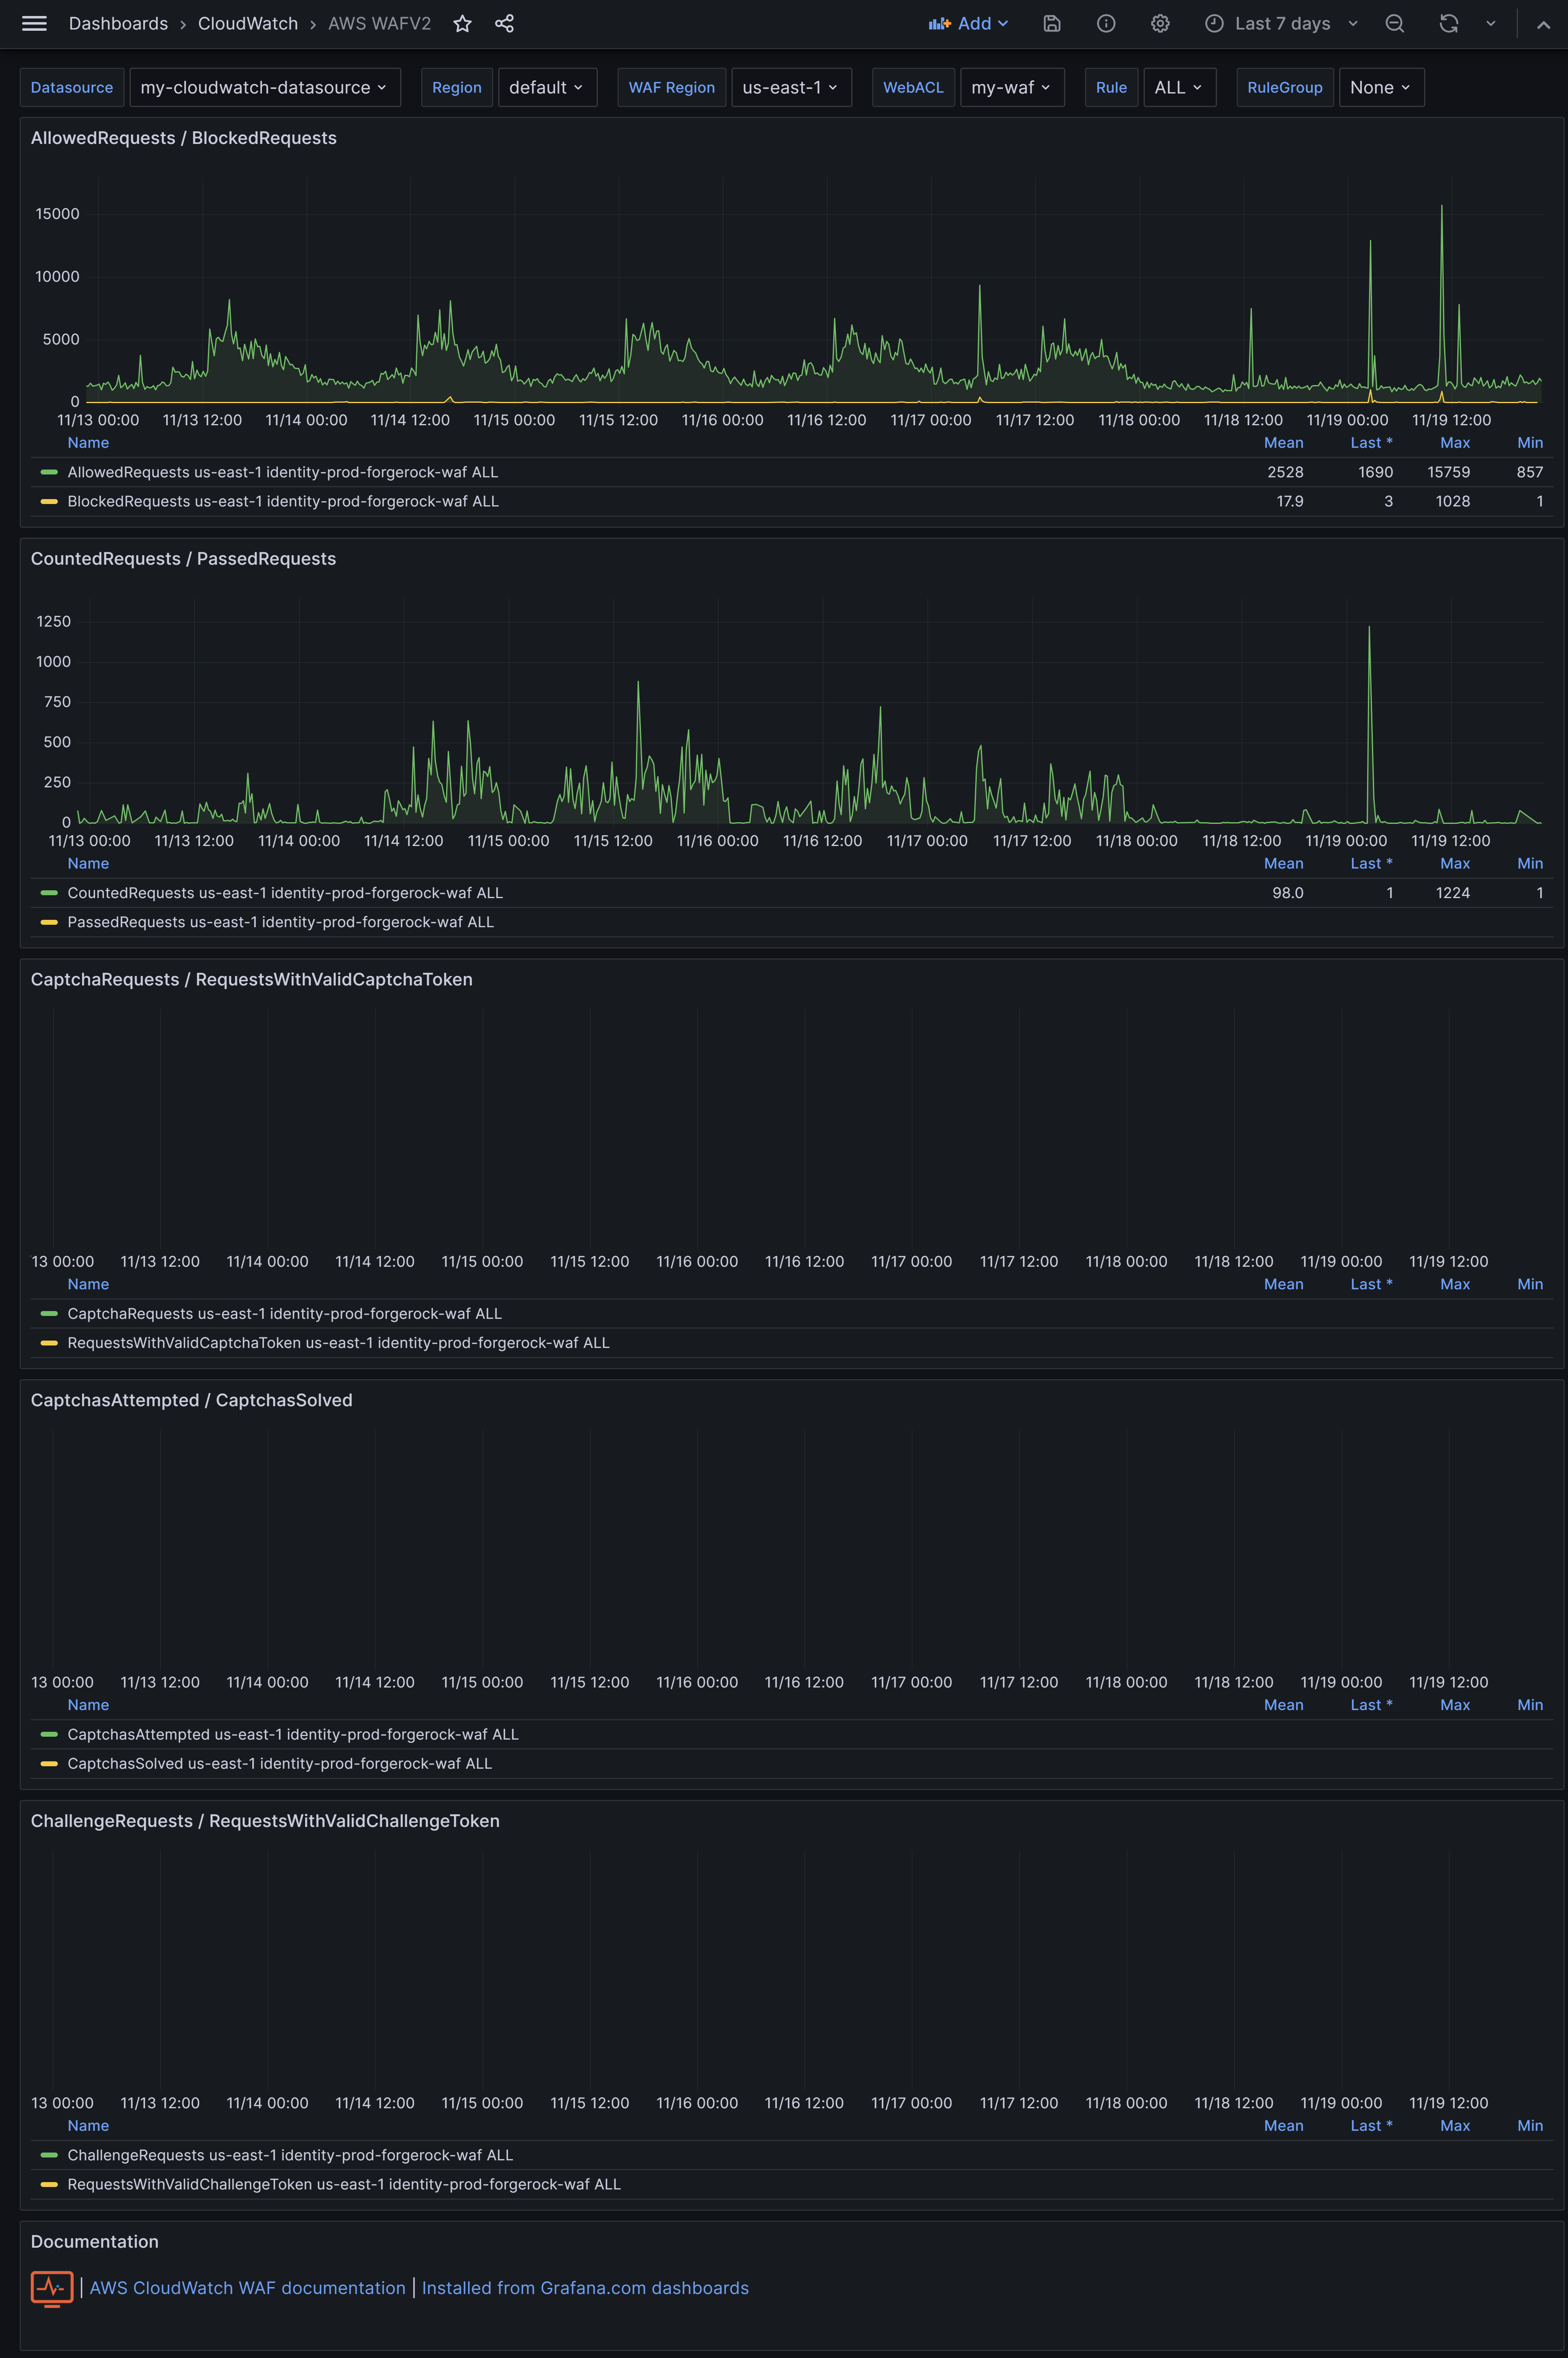
Devops Monitoring Expert, who loves monitoring systems and cutting/bleeding edge technologies: Docker, Kubernetes, ECS, AWS, Google GCP, Terraform, Lambda, Zabbix, Grafana, Elasticsearch, Kibana, Prometheus, Sysdig,...
Summary:
Professional devops / monitoring / consulting services:
more like this
Comprehensive analytics dashboard for AI coding agents — Cursor, Windsurf, Claude Code, VS Code Copilot, Zed, Antigravi…
an efficient and user friendly OTA server equipped with a powerful WEB UI, designed to effortlessly manage both your ES…
PlexWatch is a Discord bot that provides a real-time dashboard for your Plex media server, featuring active stream moni…
search projects, people, and tags