ChartGPU
Beautiful, open source, WebGPU-based charting library
 ChartGPU

WebGPU charting library for large datasets, real-time streaming, multi-chart dashboards, and 3D series. MIT licensed. Zero npm runtime dependencies.
Live demo · Docs · API · Examples
Overview
ChartGPU renders charts with WebGPU (not Canvas2D or WebGL). It is aimed at:
- Dense time series and multi-million-point series
- Streaming updates (
appendDatawith optional ring capacity) - Shared-device multi-chart dashboards
- 2D series plus
cartesian3d(pointCloud3d,surface3d)
There is no WebGL/Canvas fallback. Unsupported browsers must be gated by the host app.
Demo

Streaming multi-chart wall (shared GPU device):

Streaming dashboards · Multi-chart cookbook · Live examples
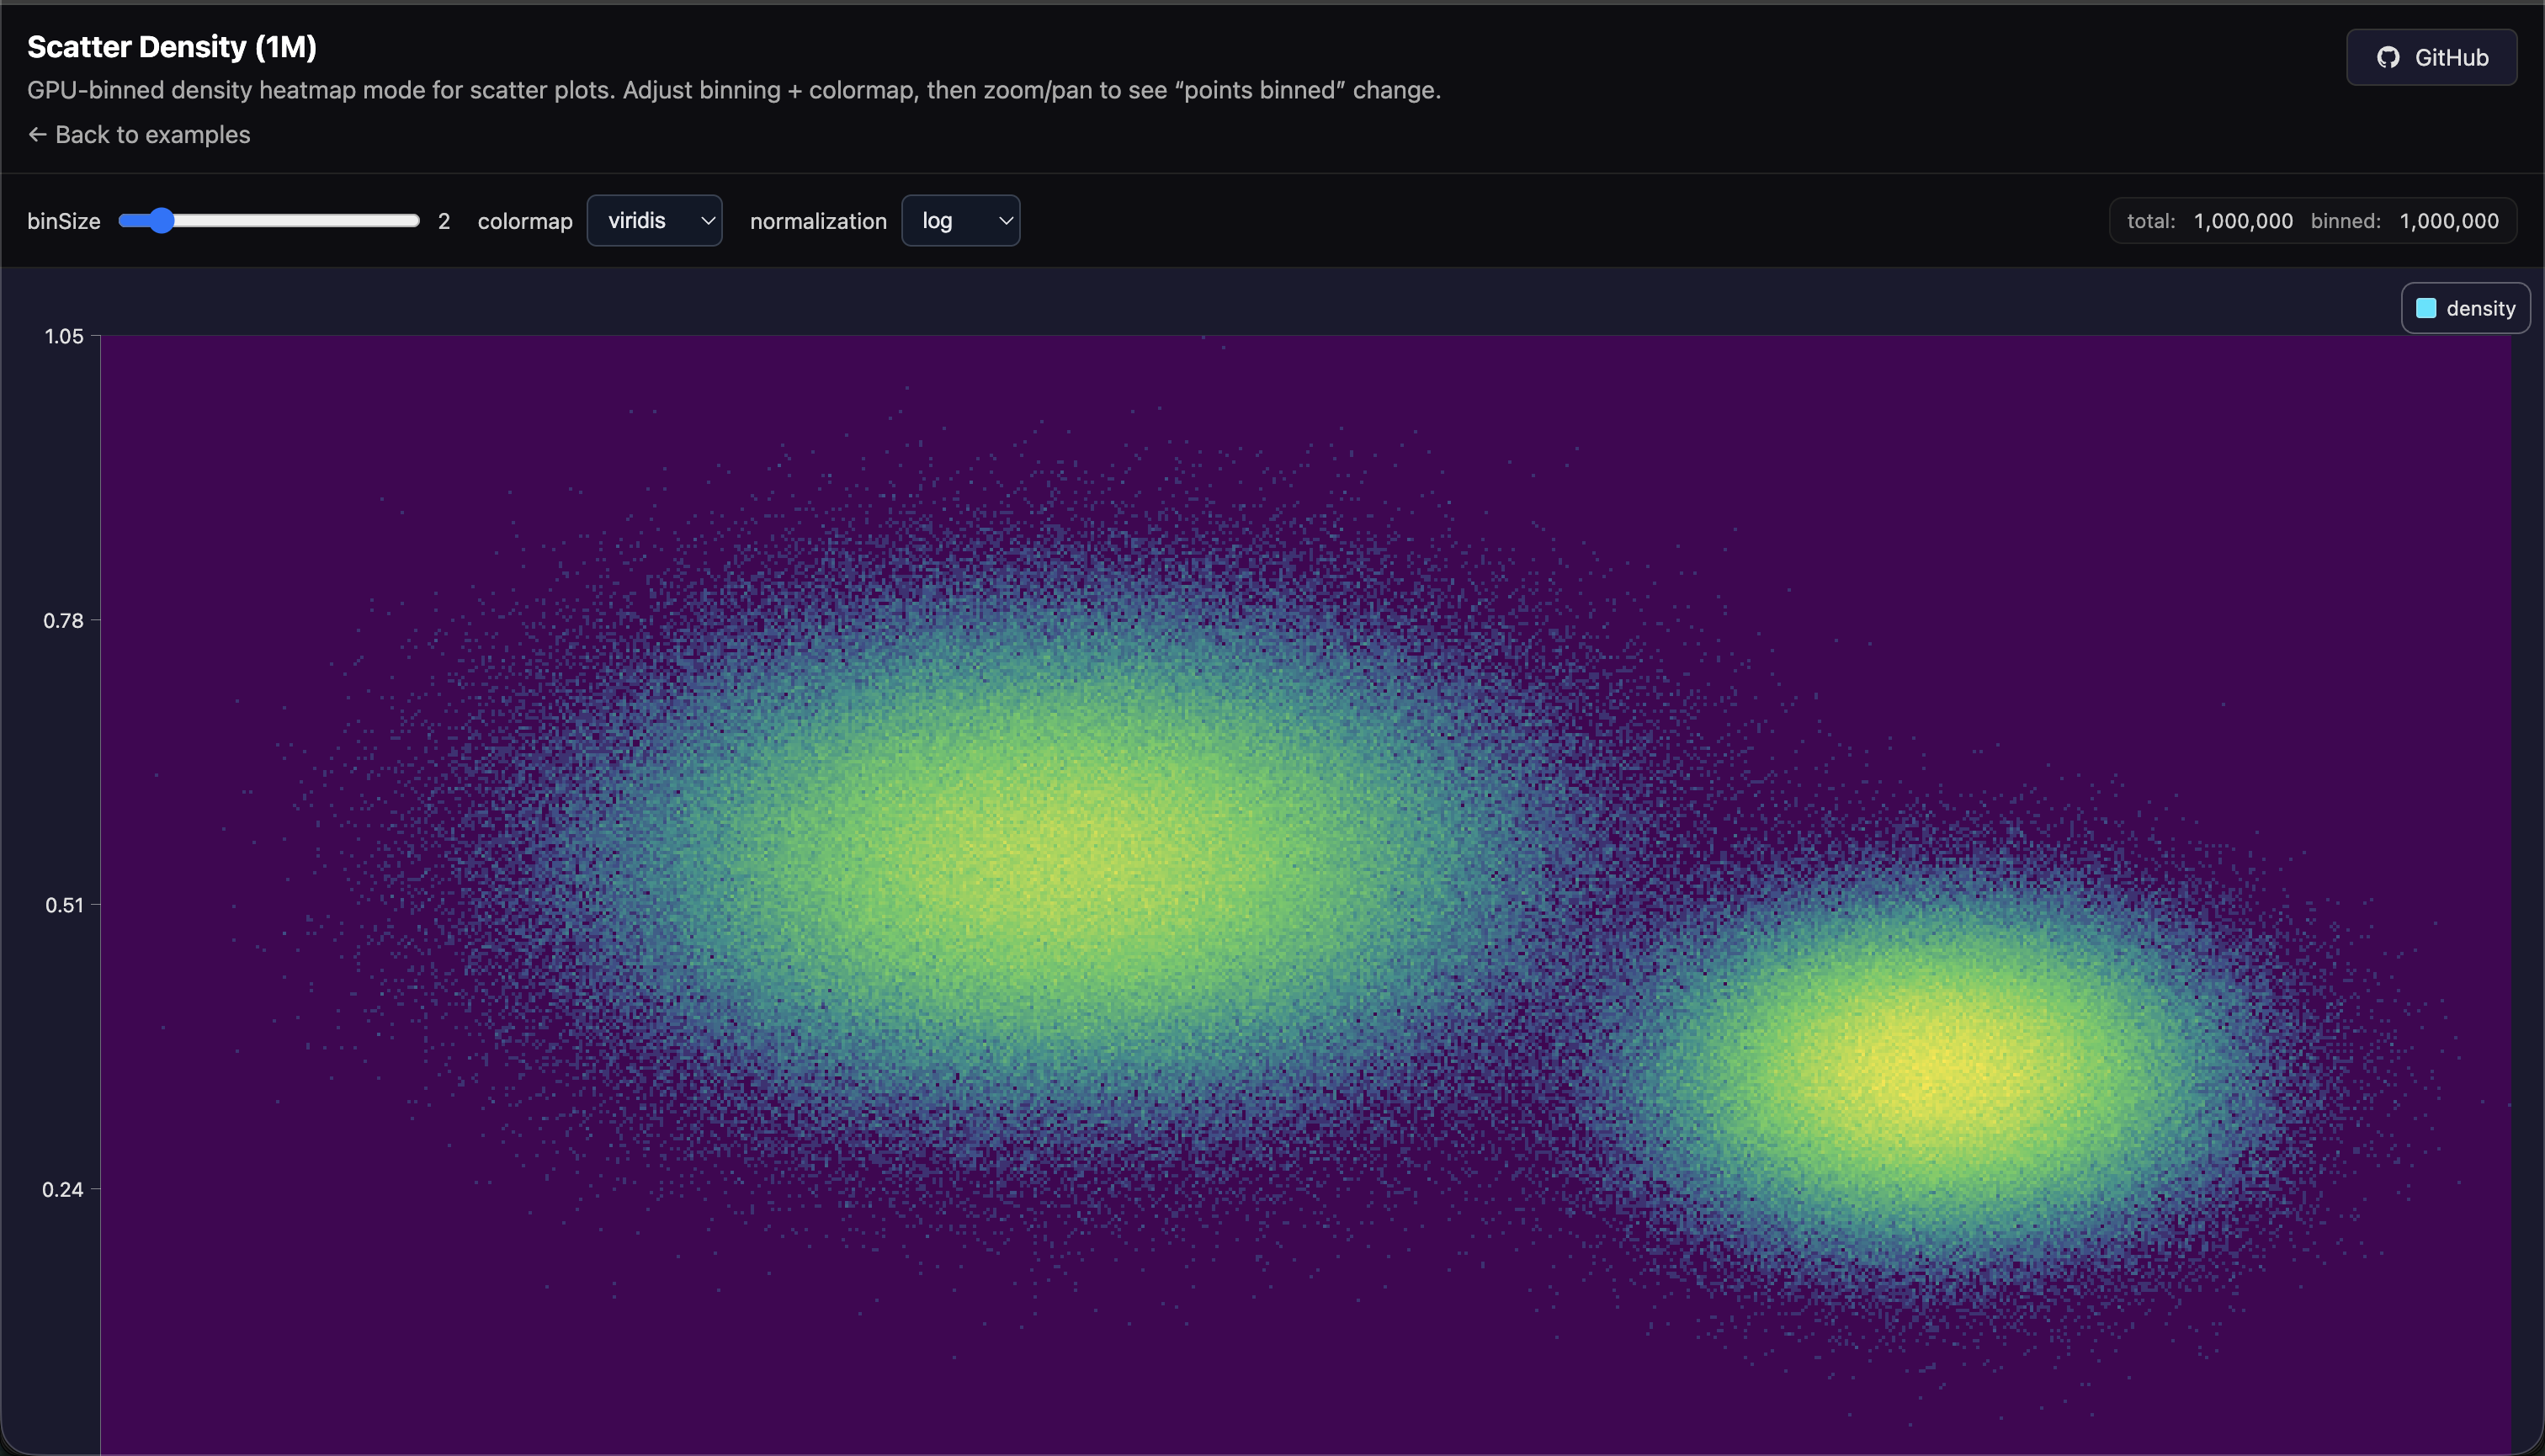
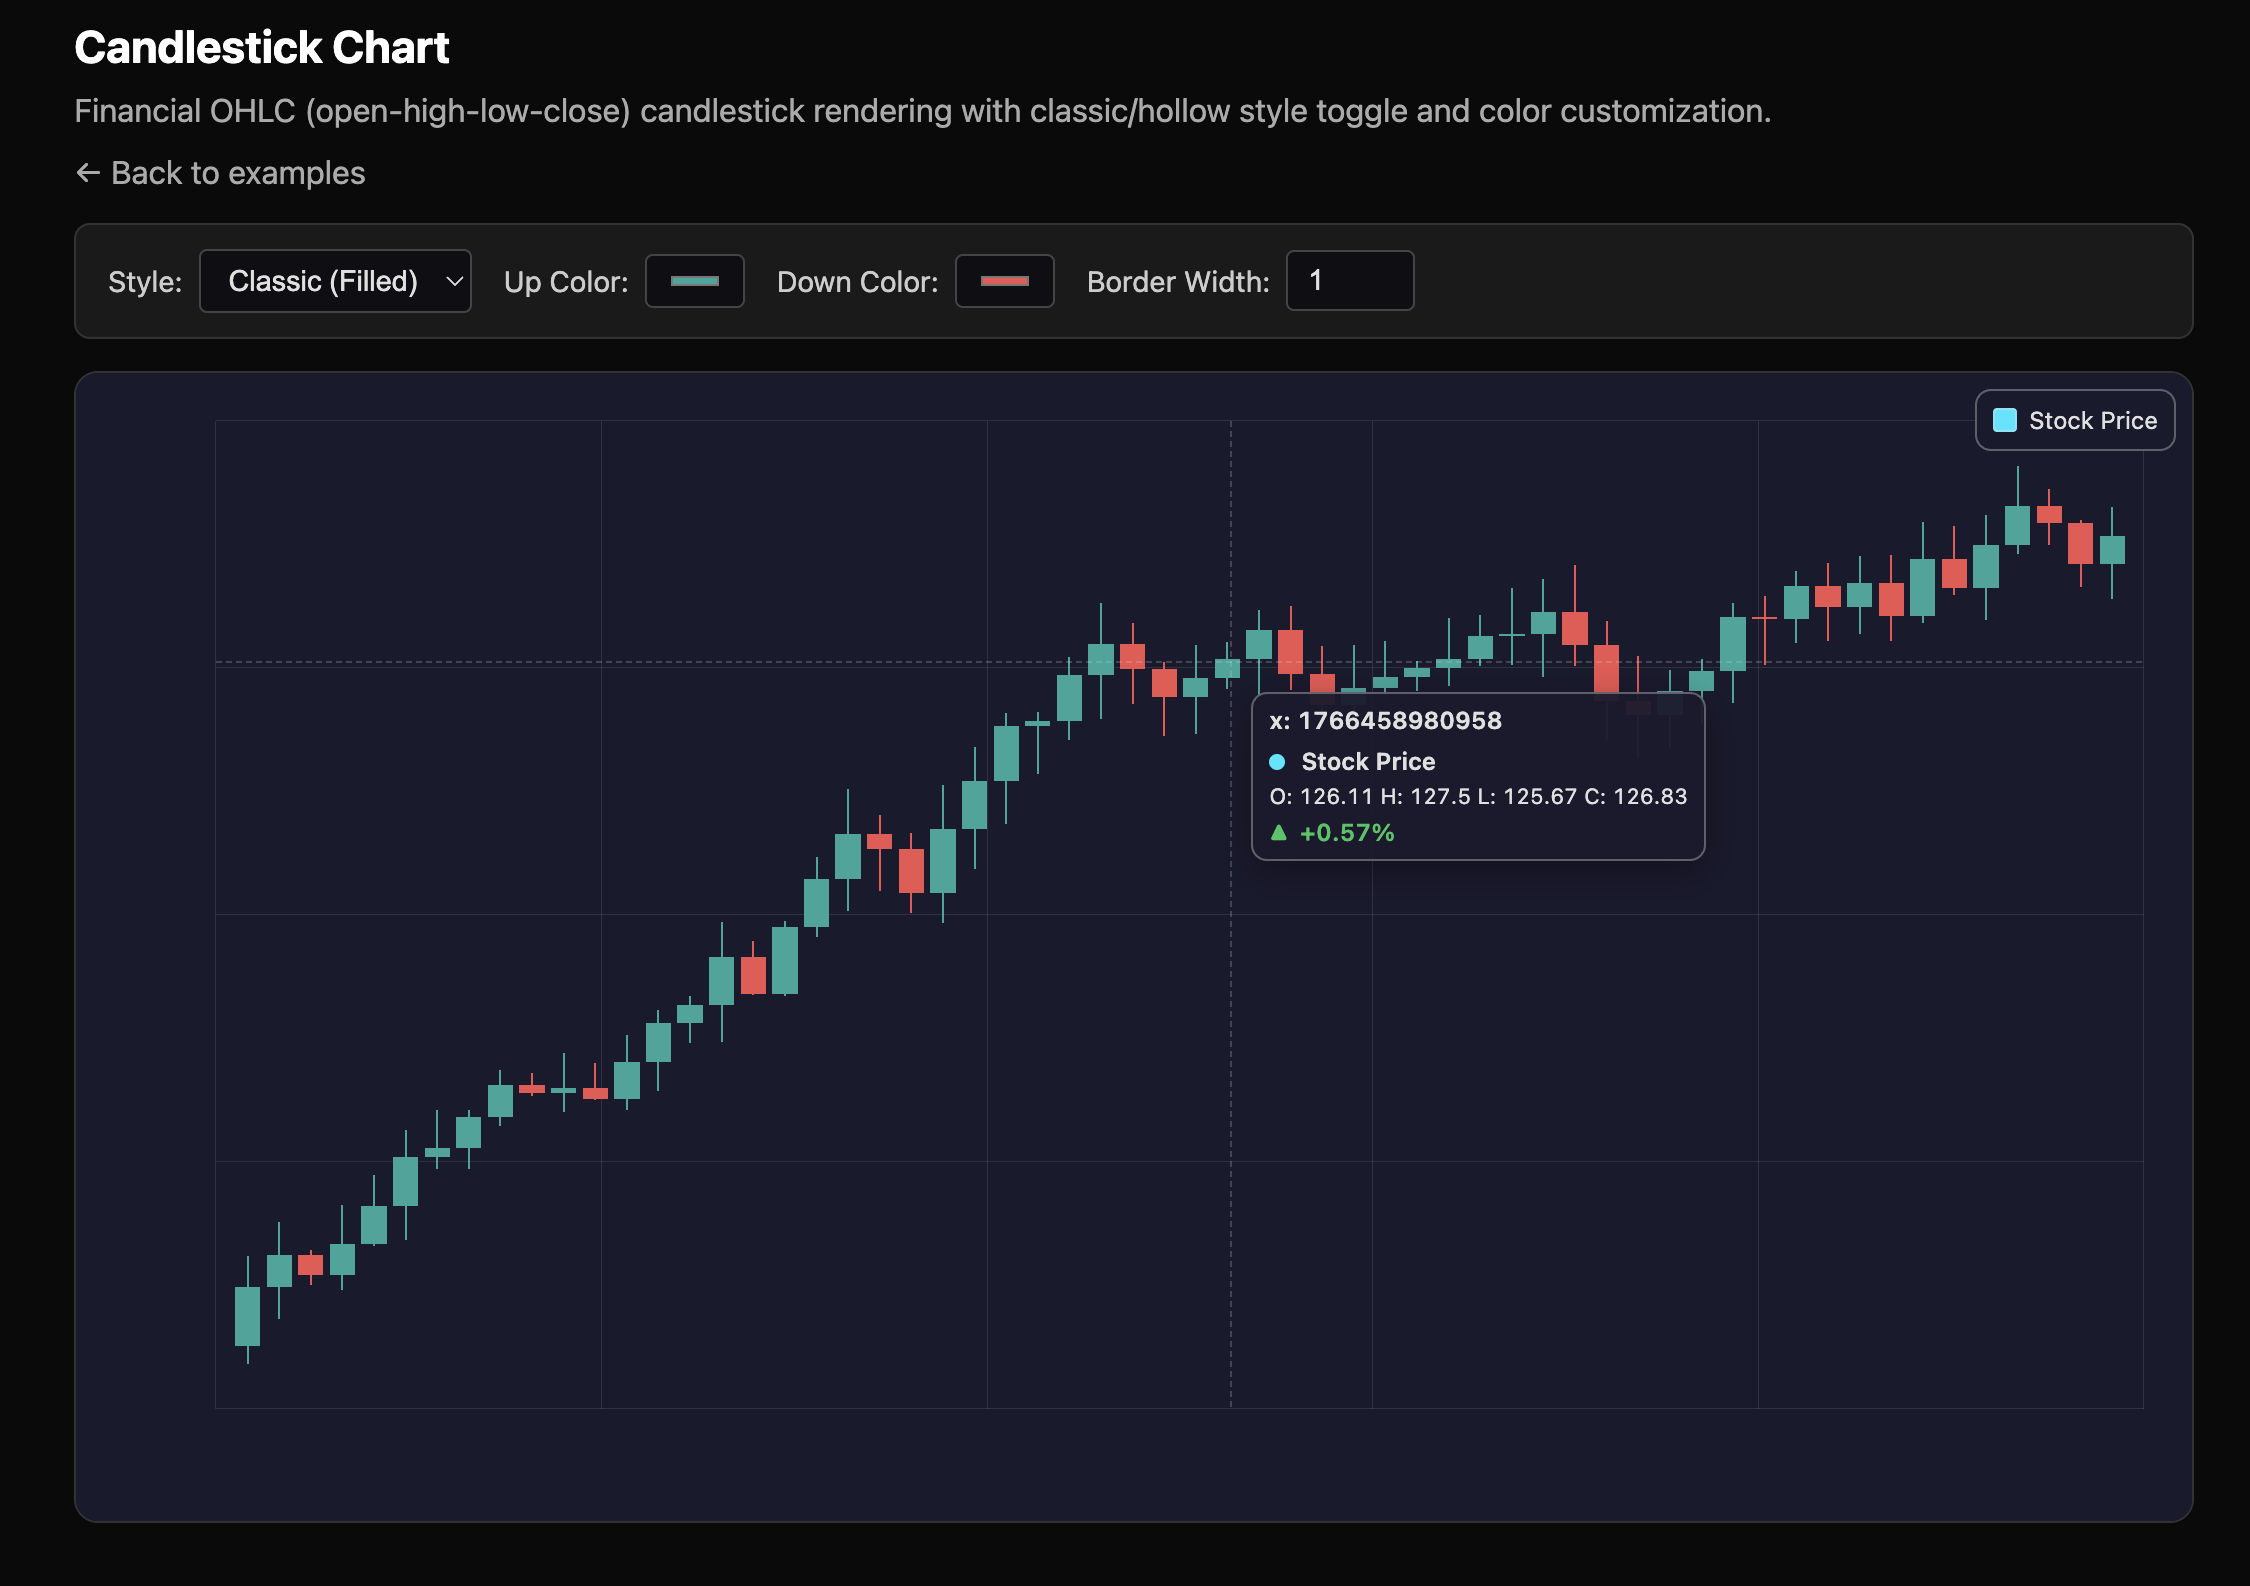
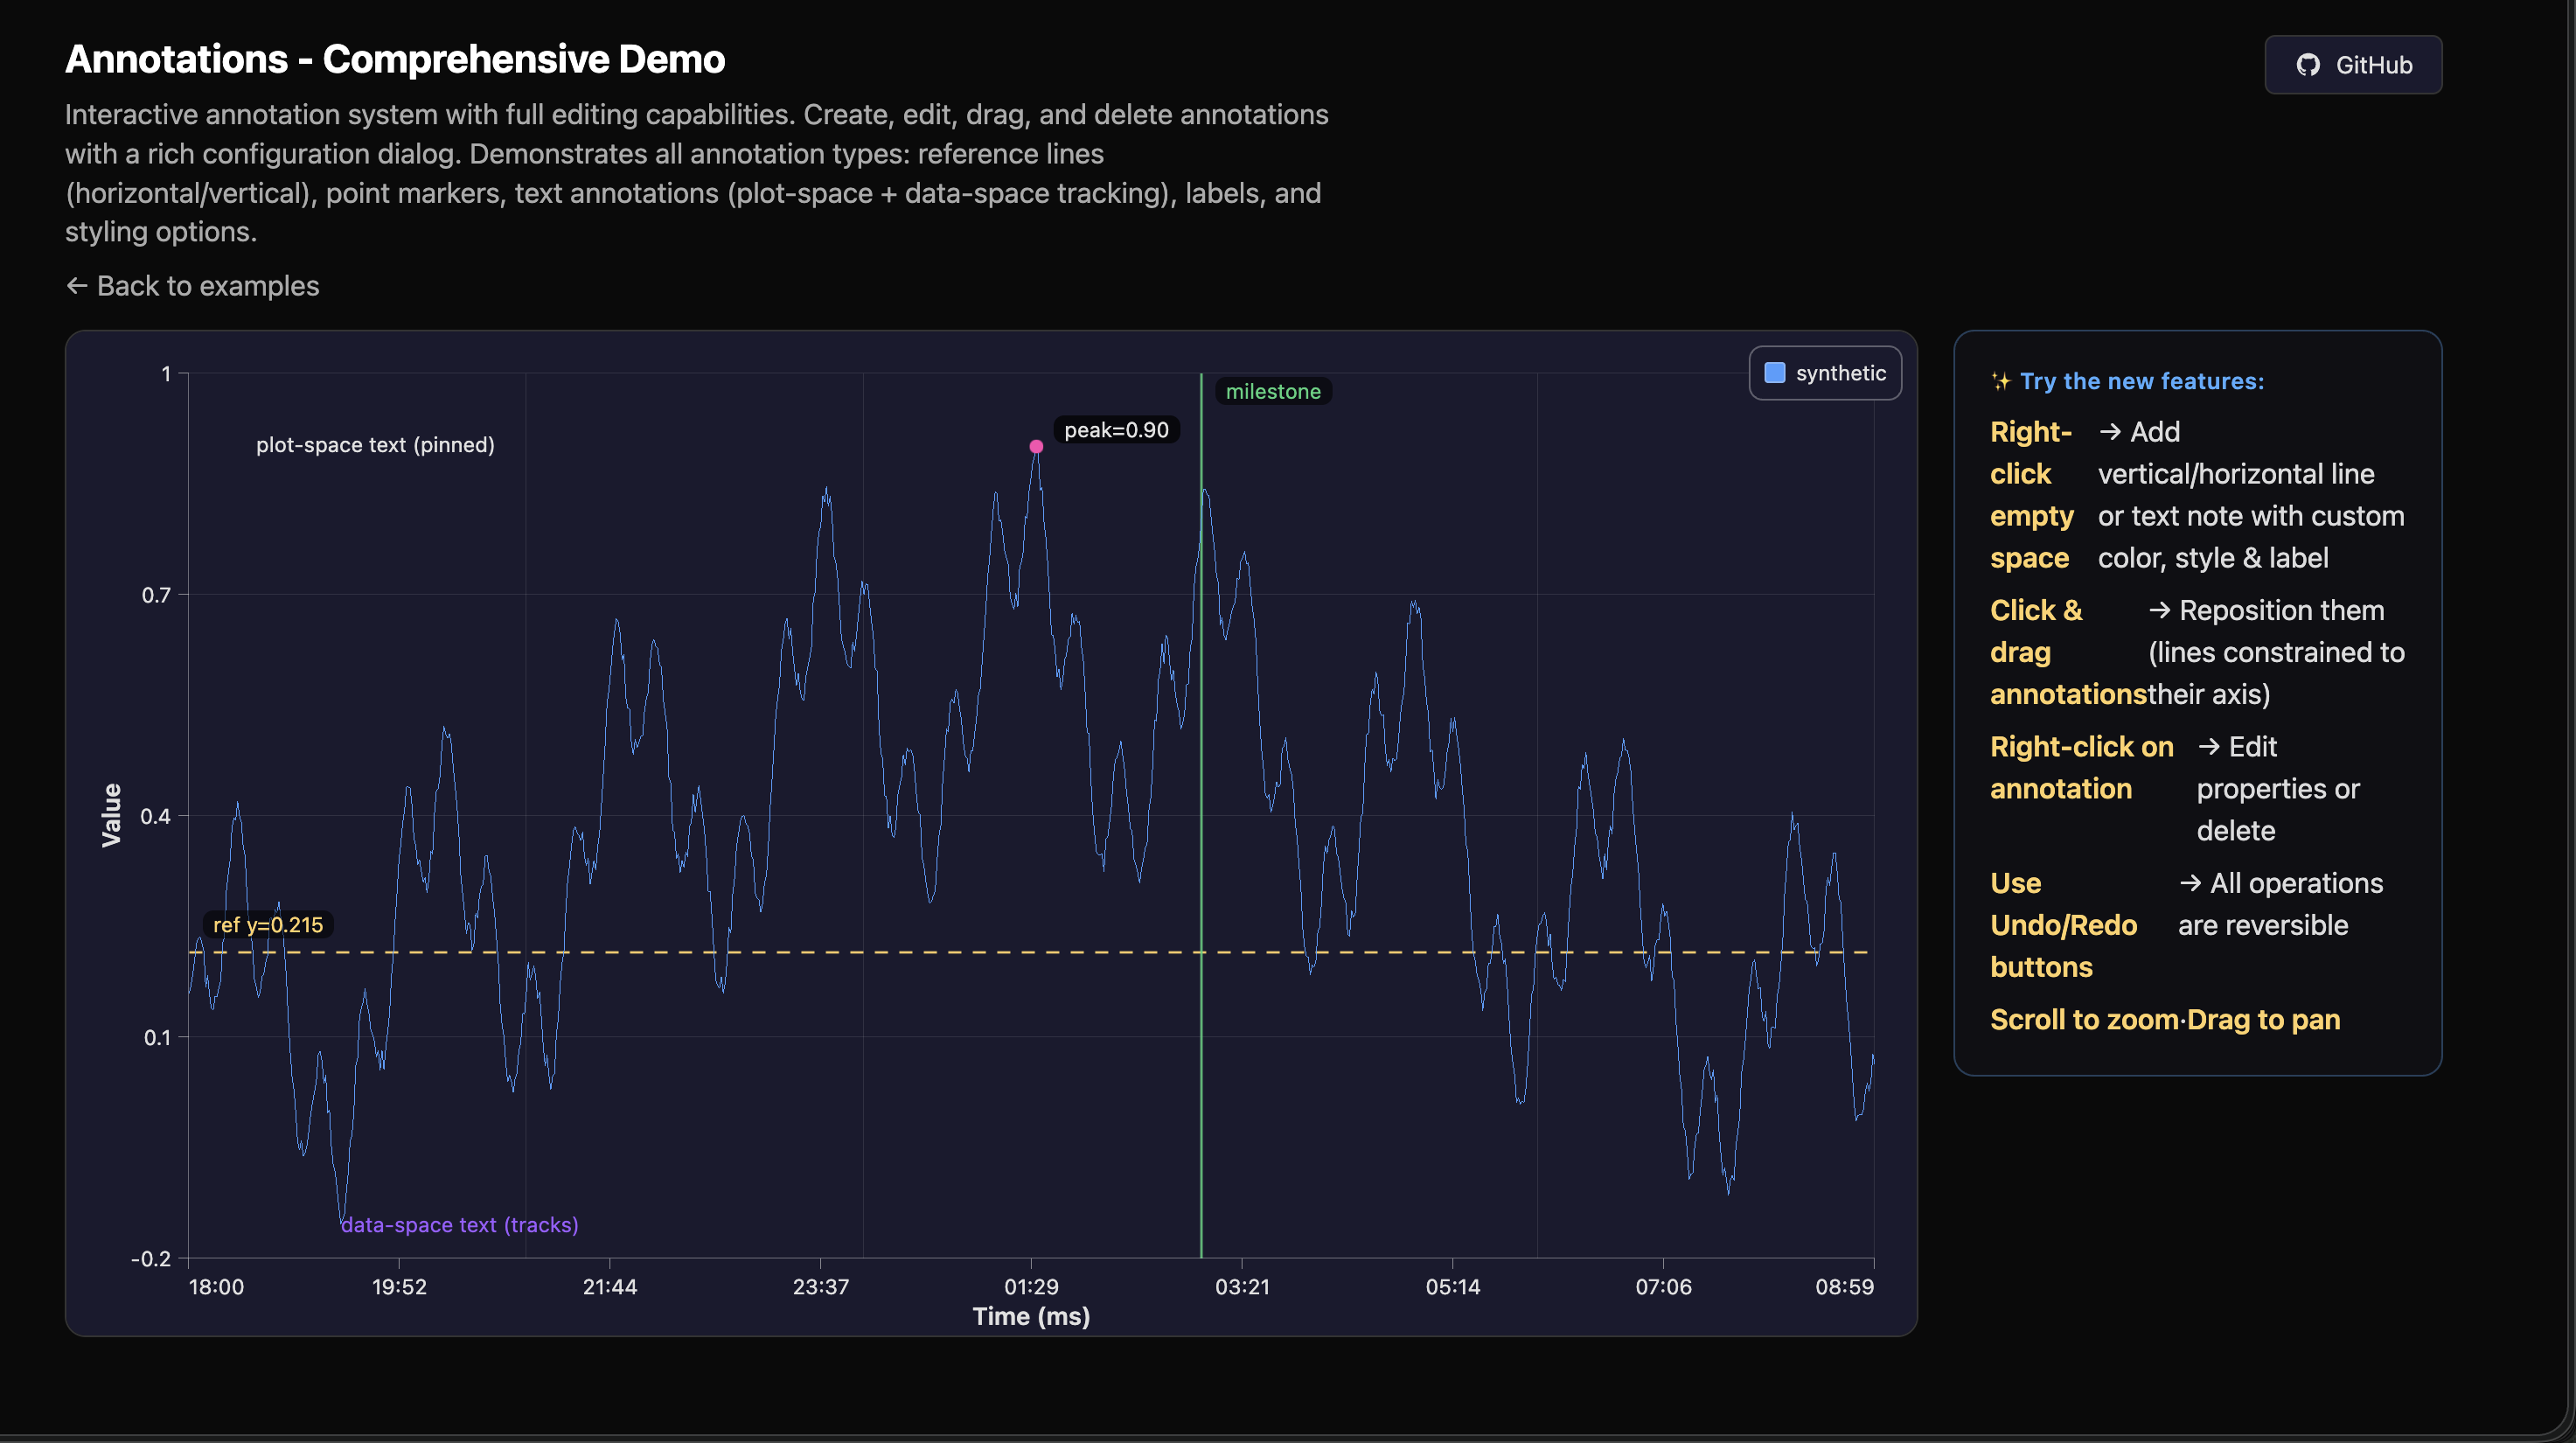
| Scatter density | Candlestick / OHLC | Annotations |
|---|---|---|
 |
 |
 |
Install
npm install @chartgpu/chartgpu
Also published as unscoped chartgpu (same version line). React bindings: chartgpu-react (npm i chartgpu-react @chartgpu/chartgpu).
Minimal example
import { ChartGPU } from '@chartgpu/chartgpu';

const el = document.getElementById('chart')!;
const chart = await ChartGPU.create(el, {
  series: [{
    type: 'line',
    data: {
      x: new Float64Array([0, 1, 2]),
      y: new Float64Array([1, 3, 2]),
    },
  }],
});

// Prefer column-shaped x/y at scale; object/[x,y] tuples are fine for small demos
const x = new Float64Array([3, 4, 5]);
const y = new Float64Array([2.5, 2.1, 2.8]);
chart.appendData(0, { x, y }, { maxPoints: 50_000 });
Requires a WebGPU-capable browser (see Browser support).
Features
- Streaming —
appendDatawith optionalmaxPointsring (FIFO). Heatmap and 3D surfaces use dedicated update APIs (updateHeatmap,updateSurface3D) rather than full option rewrites every tick. - Sampling — LTTB / min / max on the CPU; eligible line series can run decimation on the GPU. Nulls create gaps; optional
connectNulls.performance.lod:auto|strict. - Multi-chart — Share one
GPUDeviceand pipeline cache across charts (≥3 recommended). Zoom sync viaconnectCharts. - Interaction — Zoom, pan, multi-axis Y scales, dark/light/custom themes, annotations.
- 3D —
coordinateSystem: 'cartesian3d'withpointCloud3dandsurface3d. - Dependencies — Zero npm runtime dependencies. MIT license for commercial embedding.
Architecture notes: docs/ARCHITECTURE.md. Performance guide: chartgpu.io/docs/performance. Theming: chartgpu.io/docs/theming.
Series types
Full options: API — options.
| Category | Types / modes | Docs |
|---|---|---|
| Cartesian | line, area, bar, scatter, pie |
line · scatter |
| Finance | candlestick, ohlc |
candlestick |
| Scientific | heatmap, band, errorBar, impulse |
heatmap |
| Variants | step line/area · stacked mountain · scatter mode: 'density' |
charting |
| 3D | pointCloud3d, surface3d |
3D API |
Multi-chart (shared device)
For three or more charts on one page, create a single adapter/device/pipeline cache and pass it into each ChartGPU.create. Charts do not destroy a shared device on dispose.
import { ChartGPU, createPipelineCache, connectCharts } from '@chartgpu/chartgpu';

if (!navigator.gpu) {
  throw new Error('WebGPU not available');
}

const adapter = await navigator.gpu.requestAdapter({ powerPreference: 'high-performance' });
if (!adapter) throw new Error('No GPU adapter');

const device = await adapter.requestDevice();
const pipelineCache = createPipelineCache(device);
const ctx = { adapter, device, pipelineCache };

const a = await ChartGPU.create(document.getElementById('a')!, {
  series: [{ type: 'line', data: { x: new Float64Array([0]), y: new Float64Array([0]) } }],
}, ctx);
const b = await ChartGPU.create(document.getElementById('b')!, {
  series: [{ type: 'line', data: { x: new Float64Array([0]), y: new Float64Array([0]) } }],
}, ctx);
const c = await ChartGPU.create(document.getElementById('c')!, {
  series: [{ type: 'line', data: { x: new Float64Array([0]), y: new Float64Array([0]) } }],
}, ctx);

connectCharts([a, b, c], { syncZoom: true });
// Optional: setRenderMode('external') + renderFrame() for a single app rAF loop
Recipes: multi-chart cookbook · streaming dashboards.
Browser support
WebGPU only. No WebGL path.
| Browser | Support |
|---|---|
| Chrome / Edge | 113+ |
| Safari | 18+ |
| Firefox | Windows 114+; macOS 145+; Linux incomplete — see gpuweb status |
Detect navigator.gpu before creating charts. Do not leave an unsupported user on a blank canvas without UI.
If you need Canvas/SVG or dual WebGL+WebGPU backends, use a library that ships those fallbacks.
Documentation
| Resource | Description |
|---|---|
| Docs hub | Guides and series docs |
| Getting started | Install and first chart |
| API reference | create, options, streaming, interaction, 3D |
| Charting | Series, axes, interaction |
| Streaming dashboards | Shared device, multi-chart |
| Annotations | Lines, markers, labels |
| Performance | Density, sampling, GPU sharing |
| Theming | Dark / light / custom |
| Architecture | Render path (repo) |
| Internals | Contributors |
examples/ |
Local Vite samples |
npm install
npm run dev
# open the examples URL printed by the dev server
Contributing
See CONTRIBUTING.md and docs/ARCHITECTURE.md.
License
MIT. Free for commercial use. No npm runtime dependencies.
more like this
bionic-reading.nvim
Toggle Bionic Reading for Neovim buffers using syllable based highlighting